Cities with the Highest Percentage of Thai Population in Georgia
RELATED REPORTS & OPTIONS
Thai
Georgia
Compare Cities
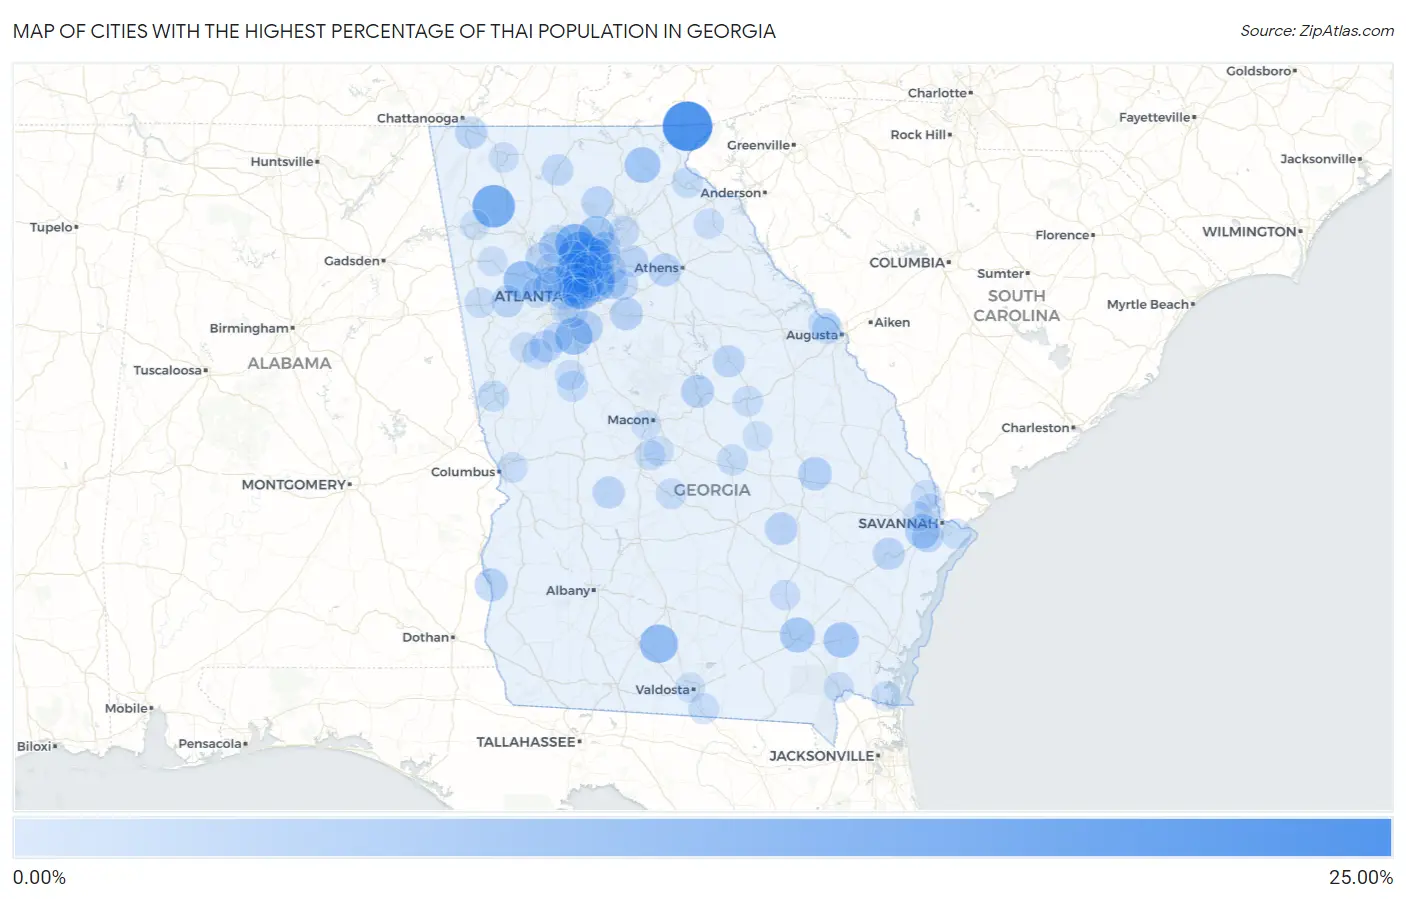
Map of Cities with the Highest Percentage of Thai Population in Georgia
0.00%
25.00%
Cities with the Highest Percentage of Thai Population in Georgia
| City | Thai | vs State | vs National | |
| 1. | Sky Valley | 24.87% | 1.65%(+23.2)#1 | 1.44%(+23.4)#47 |
| 2. | Crescent | 20.52% | 1.65%(+18.9)#2 | 1.44%(+19.1)#66 |
| 3. | Plainville | 15.92% | 1.65%(+14.3)#3 | 1.44%(+14.5)#106 |
| 4. | Alpharetta | 14.60% | 1.65%(+13.0)#4 | 1.44%(+13.2)#120 |
| 5. | Johns Creek | 13.61% | 1.65%(+12.0)#5 | 1.44%(+12.2)#135 |
| 6. | Milton | 12.33% | 1.65%(+10.7)#6 | 1.44%(+10.9)#161 |
| 7. | Scottdale | 11.98% | 1.65%(+10.3)#7 | 1.44%(+10.5)#173 |
| 8. | Dunwoody | 11.45% | 1.65%(+9.80)#8 | 1.44%(+10.0)#182 |
| 9. | Ellenton | 10.81% | 1.65%(+9.16)#9 | 1.44%(+9.37)#204 |
| 10. | Hiram | 10.16% | 1.65%(+8.51)#10 | 1.44%(+8.72)#223 |
| 11. | Bonanza | 9.15% | 1.65%(+7.50)#11 | 1.44%(+7.72)#255 |
| 12. | Lilburn | 9.08% | 1.65%(+7.42)#12 | 1.44%(+7.64)#259 |
| 13. | Mountain Park | 8.70% | 1.65%(+7.05)#13 | 1.44%(+7.26)#278 |
| 14. | Cumming | 7.69% | 1.65%(+6.04)#14 | 1.44%(+6.25)#340 |
| 15. | Helen | 7.52% | 1.65%(+5.87)#15 | 1.44%(+6.09)#353 |
| 16. | Nahunta | 7.07% | 1.65%(+5.42)#16 | 1.44%(+5.63)#385 |
| 17. | Deenwood | 6.71% | 1.65%(+5.06)#17 | 1.44%(+5.27)#418 |
| 18. | Henderson | 5.99% | 1.65%(+4.34)#18 | 1.44%(+4.55)#488 |
| 19. | Doraville | 5.64% | 1.65%(+3.99)#19 | 1.44%(+4.20)#526 |
| 20. | Duluth | 5.16% | 1.65%(+3.51)#20 | 1.44%(+3.72)#589 |
| 21. | Stillmore | 4.78% | 1.65%(+3.12)#21 | 1.44%(+3.34)#647 |
| 22. | Snellville | 4.62% | 1.65%(+2.96)#22 | 1.44%(+3.18)#677 |
| 23. | Hardwick | 4.34% | 1.65%(+2.69)#23 | 1.44%(+2.90)#740 |
| 24. | Sandy Springs | 4.32% | 1.65%(+2.67)#24 | 1.44%(+2.88)#748 |
| 25. | Smyrna | 4.28% | 1.65%(+2.62)#25 | 1.44%(+2.84)#758 |
| 26. | Fort Gaines | 4.25% | 1.65%(+2.60)#26 | 1.44%(+2.81)#771 |
| 27. | Stockbridge | 4.22% | 1.65%(+2.57)#27 | 1.44%(+2.78)#776 |
| 28. | Oxford | 4.18% | 1.65%(+2.53)#28 | 1.44%(+2.74)#785 |
| 29. | Uvalda | 4.13% | 1.65%(+2.48)#29 | 1.44%(+2.70)#802 |
| 30. | Brookhaven | 4.04% | 1.65%(+2.38)#30 | 1.44%(+2.60)#831 |
| 31. | Bogart | 4.00% | 1.65%(+2.34)#31 | 1.44%(+2.56)#844 |
| 32. | North Druid Hills | 3.59% | 1.65%(+1.94)#32 | 1.44%(+2.15)#975 |
| 33. | Berry College | 3.53% | 1.65%(+1.88)#33 | 1.44%(+2.09)#981 |
| 34. | Suwanee | 3.51% | 1.65%(+1.86)#34 | 1.44%(+2.08)#989 |
| 35. | Fort Oglethorpe | 3.46% | 1.65%(+1.81)#35 | 1.44%(+2.02)#1,012 |
| 36. | Peachtree City | 3.44% | 1.65%(+1.79)#36 | 1.44%(+2.00)#1,017 |
| 37. | North Decatur | 3.42% | 1.65%(+1.77)#37 | 1.44%(+1.98)#1,024 |
| 38. | Sparta | 3.29% | 1.65%(+1.64)#38 | 1.44%(+1.85)#1,064 |
| 39. | Dawsonville | 3.25% | 1.65%(+1.60)#39 | 1.44%(+1.82)#1,080 |
| 40. | Kennesaw | 3.23% | 1.65%(+1.58)#40 | 1.44%(+1.80)#1,099 |
| 41. | Flemington | 3.16% | 1.65%(+1.51)#41 | 1.44%(+1.72)#1,133 |
| 42. | Montezuma | 3.12% | 1.65%(+1.47)#42 | 1.44%(+1.69)#1,148 |
| 43. | Georgetown | 3.12% | 1.65%(+1.47)#43 | 1.44%(+1.69)#1,151 |
| 44. | Carl | 3.04% | 1.65%(+1.39)#44 | 1.44%(+1.60)#1,196 |
| 45. | Villa Rica | 3.04% | 1.65%(+1.38)#45 | 1.44%(+1.60)#1,198 |
| 46. | Sugar Hill | 2.73% | 1.65%(+1.07)#46 | 1.44%(+1.29)#1,349 |
| 47. | East Ellijay | 2.64% | 1.65%(+0.988)#47 | 1.44%(+1.20)#1,393 |
| 48. | Evans | 2.48% | 1.65%(+0.824)#48 | 1.44%(+1.04)#1,482 |
| 49. | Atlanta | 2.26% | 1.65%(+0.603)#49 | 1.44%(+0.820)#1,627 |
| 50. | Tucker | 2.09% | 1.65%(+0.441)#50 | 1.44%(+0.657)#1,720 |
| 51. | Dublin | 2.05% | 1.65%(+0.392)#51 | 1.44%(+0.608)#1,761 |
| 52. | Zebulon | 2.03% | 1.65%(+0.377)#52 | 1.44%(+0.593)#1,773 |
| 53. | Toccoa | 2.00% | 1.65%(+0.345)#53 | 1.44%(+0.561)#1,797 |
| 54. | Lagrange | 1.84% | 1.65%(+0.184)#54 | 1.44%(+0.401)#1,937 |
| 55. | Roswell | 1.82% | 1.65%(+0.170)#55 | 1.44%(+0.386)#1,959 |
| 56. | Martinez | 1.82% | 1.65%(+0.161)#56 | 1.44%(+0.378)#1,971 |
| 57. | Loganville | 1.81% | 1.65%(+0.159)#57 | 1.44%(+0.375)#1,974 |
| 58. | Chamblee | 1.80% | 1.65%(+0.151)#58 | 1.44%(+0.367)#1,984 |
| 59. | Druid Hills | 1.80% | 1.65%(+0.142)#59 | 1.44%(+0.358)#1,998 |
| 60. | Norcross | 1.74% | 1.65%(+0.086)#60 | 1.44%(+0.302)#2,053 |
| 61. | Lake Park | 1.73% | 1.65%(+0.081)#61 | 1.44%(+0.297)#2,063 |
| 62. | Hawkinsville | 1.65% | 1.65%(-0.007)#62 | 1.44%(+0.210)#2,147 |
| 63. | Oakwood | 1.62% | 1.65%(-0.036)#63 | 1.44%(+0.180)#2,174 |
| 64. | Bremen | 1.61% | 1.65%(-0.045)#64 | 1.44%(+0.172)#2,182 |
| 65. | Sandersville | 1.61% | 1.65%(-0.047)#65 | 1.44%(+0.169)#2,188 |
| 66. | Fayetteville | 1.55% | 1.65%(-0.107)#66 | 1.44%(+0.109)#2,269 |
| 67. | Warner Robins | 1.54% | 1.65%(-0.116)#67 | 1.44%(+0.100)#2,282 |
| 68. | Peachtree Corners | 1.53% | 1.65%(-0.121)#68 | 1.44%(+0.095)#2,287 |
| 69. | Vinings | 1.51% | 1.65%(-0.140)#69 | 1.44%(+0.076)#2,311 |
| 70. | Holly Springs | 1.50% | 1.65%(-0.154)#70 | 1.44%(+0.062)#2,327 |
| 71. | Decatur | 1.44% | 1.65%(-0.212)#71 | 1.44%(+0.004)#2,404 |
| 72. | Folkston | 1.41% | 1.65%(-0.245)#72 | 1.44%(-0.029)#2,459 |
| 73. | Columbus | 1.41% | 1.65%(-0.246)#73 | 1.44%(-0.030)#2,461 |
| 74. | Franklin Springs | 1.35% | 1.65%(-0.307)#74 | 1.44%(-0.091)#2,548 |
| 75. | Woodstock | 1.34% | 1.65%(-0.309)#75 | 1.44%(-0.093)#2,551 |
| 76. | Newnan | 1.33% | 1.65%(-0.323)#76 | 1.44%(-0.107)#2,572 |
| 77. | Sharpsburg | 1.32% | 1.65%(-0.338)#77 | 1.44%(-0.122)#2,587 |
| 78. | Rincon | 1.30% | 1.65%(-0.352)#78 | 1.44%(-0.136)#2,611 |
| 79. | Williamson | 1.29% | 1.65%(-0.362)#79 | 1.44%(-0.145)#2,631 |
| 80. | Athens-Clarke County Unified Government (Balance) | 1.23% | 1.65%(-0.428)#80 | 1.44%(-0.211)#2,735 |
| 81. | Alma | 1.22% | 1.65%(-0.430)#81 | 1.44%(-0.214)#2,739 |
| 82. | Lawrenceville | 1.16% | 1.65%(-0.498)#82 | 1.44%(-0.282)#2,857 |
| 83. | Dalton | 1.09% | 1.65%(-0.568)#83 | 1.44%(-0.352)#2,990 |
| 84. | Port Wentworth | 1.06% | 1.65%(-0.591)#84 | 1.44%(-0.375)#3,042 |
| 85. | Lithia Springs | 1.05% | 1.65%(-0.599)#85 | 1.44%(-0.383)#3,051 |
| 86. | Wilmington Island | 1.04% | 1.65%(-0.617)#86 | 1.44%(-0.400)#3,089 |
| 87. | Conley | 1.04% | 1.65%(-0.618)#87 | 1.44%(-0.402)#3,097 |
| 88. | St Marys | 1.01% | 1.65%(-0.649)#88 | 1.44%(-0.432)#3,159 |
| 89. | Avondale Estates | 0.97% | 1.65%(-0.684)#89 | 1.44%(-0.468)#3,239 |
| 90. | Mableton | 0.97% | 1.65%(-0.688)#90 | 1.44%(-0.472)#3,244 |
| 91. | Hapeville | 0.96% | 1.65%(-0.694)#91 | 1.44%(-0.478)#3,254 |
| 92. | Bloomingdale | 0.95% | 1.65%(-0.699)#92 | 1.44%(-0.483)#3,268 |
| 93. | Kennesaw State University | 0.95% | 1.65%(-0.707)#93 | 1.44%(-0.491)#3,292 |
| 94. | Rome | 0.94% | 1.65%(-0.718)#94 | 1.44%(-0.502)#3,305 |
| 95. | Macon Bibb County | 0.92% | 1.65%(-0.731)#95 | 1.44%(-0.515)#3,341 |
| 96. | Wrightsville | 0.86% | 1.65%(-0.789)#96 | 1.44%(-0.573)#3,456 |
| 97. | Robins Afb | 0.84% | 1.65%(-0.818)#97 | 1.44%(-0.602)#3,517 |
| 98. | Rockmart | 0.82% | 1.65%(-0.832)#98 | 1.44%(-0.616)#3,556 |
| 99. | Marietta | 0.82% | 1.65%(-0.834)#99 | 1.44%(-0.618)#3,564 |
| 100. | Remerton | 0.81% | 1.65%(-0.842)#100 | 1.44%(-0.626)#3,576 |
Common Questions
What are the Top 10 Cities with the Highest Percentage of Thai Population in Georgia?
Top 10 Cities with the Highest Percentage of Thai Population in Georgia are:
#1
24.87%
#2
15.92%
#3
14.60%
#4
13.61%
#5
12.33%
#6
11.98%
#7
11.45%
#8
10.81%
#9
10.16%
#10
9.15%
What city has the Highest Percentage of Thai Population in Georgia?
Sky Valley has the Highest Percentage of Thai Population in Georgia with 24.87%.
What is the Percentage of Thai Population in the State of Georgia?
Percentage of Thai Population in Georgia is 1.65%.
What is the Percentage of Thai Population in the United States?
Percentage of Thai Population in the United States is 1.44%.