Cities with the Highest Percentage of Thai Population in the United States
RELATED REPORTS & OPTIONS
Thai
United States
Compare Cities
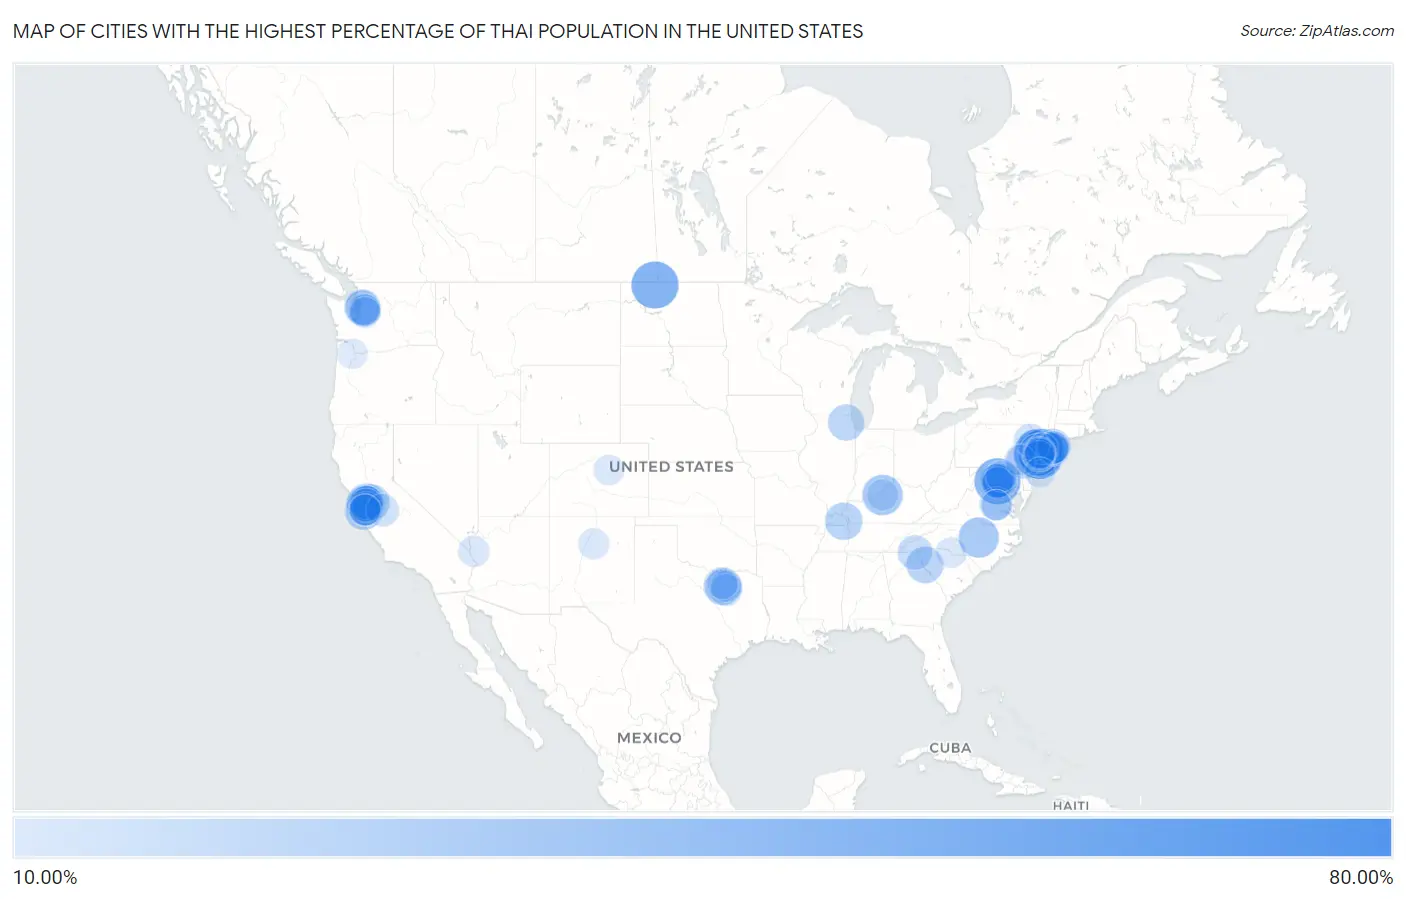
Map of Cities with the Highest Percentage of Thai Population in the United States
0.00%
80.00%
Cities with the Highest Percentage of Thai Population in the United States
| City | Thai | vs State | vs National | |
| 1. | Monroe Manor | 70.11% | 4.67%(+65.4)#1 | 1.44%(+68.7)#1 |
| 2. | Mongaup Valley | 67.45% | 2.12%(+65.3)#1 | 1.44%(+66.0)#2 |
| 3. | Ten Mile Run | 54.84% | 4.67%(+50.2)#2 | 1.44%(+53.4)#3 |
| 4. | Deans | 54.15% | 4.67%(+49.5)#3 | 1.44%(+52.7)#4 |
| 5. | Forsgate | 51.35% | 4.67%(+46.7)#4 | 1.44%(+49.9)#5 |
| 6. | Loraine | 50.00% | 0.28%(+49.7)#1 | 1.44%(+48.6)#6 |
| 7. | Loudoun Valley Estates | 47.76% | 1.97%(+45.8)#1 | 1.44%(+46.3)#7 |
| 8. | Princeton Meadows | 46.93% | 4.67%(+42.3)#5 | 1.44%(+45.5)#8 |
| 9. | Belle Mead | 46.89% | 4.67%(+42.2)#6 | 1.44%(+45.5)#9 |
| 10. | Dayton | 44.80% | 4.67%(+40.1)#7 | 1.44%(+43.4)#10 |
| 11. | Iselin | 44.78% | 4.67%(+40.1)#8 | 1.44%(+43.3)#11 |
| 12. | Monmouth Junction | 43.50% | 4.67%(+38.8)#9 | 1.44%(+42.1)#12 |
| 13. | Huntington Center | 41.53% | 0.37%(+41.2)#1 | 1.44%(+40.1)#13 |
| 14. | Heathcote | 39.23% | 4.67%(+34.6)#10 | 1.44%(+37.8)#14 |
| 15. | Sully Square | 38.87% | 1.97%(+36.9)#2 | 1.44%(+37.4)#15 |
| 16. | Troy Hills | 38.30% | 4.67%(+33.6)#11 | 1.44%(+36.9)#16 |
| 17. | Millbourne Borough | 36.84% | 1.28%(+35.6)#1 | 1.44%(+35.4)#17 |
| 18. | Hurstbourne Acres | 36.22% | 0.44%(+35.8)#1 | 1.44%(+34.8)#18 |
| 19. | Sunset Lake | 36.16% | 4.67%(+31.5)#12 | 1.44%(+34.7)#19 |
| 20. | Morrisville | 35.98% | 1.19%(+34.8)#1 | 1.44%(+34.5)#20 |
| 21. | Parsippany | 33.44% | 4.67%(+28.8)#13 | 1.44%(+32.0)#21 |
| 22. | Plainsboro Center | 32.75% | 4.67%(+28.1)#14 | 1.44%(+31.3)#22 |
| 23. | Brambleton | 32.43% | 1.97%(+30.5)#3 | 1.44%(+31.0)#23 |
| 24. | Frazer | 32.12% | 1.28%(+30.8)#2 | 1.44%(+30.7)#24 |
| 25. | Hebron | 31.09% | 1.75%(+29.3)#1 | 1.44%(+29.6)#25 |
| 26. | Camino Tassajara | 30.92% | 2.32%(+28.6)#1 | 1.44%(+29.5)#26 |
| 27. | Moorefield | 30.45% | 1.97%(+28.5)#4 | 1.44%(+29.0)#27 |
| 28. | Cupertino | 30.36% | 2.32%(+28.0)#2 | 1.44%(+28.9)#28 |
| 29. | Dexter | 30.30% | 0.44%(+29.9)#2 | 1.44%(+28.9)#29 |
| 30. | Robbinsville Center | 30.02% | 4.67%(+25.3)#15 | 1.44%(+28.6)#30 |
| 31. | Manhasset Hills | 29.92% | 2.12%(+27.8)#2 | 1.44%(+28.5)#31 |
| 32. | Fremont | 29.82% | 2.32%(+27.5)#3 | 1.44%(+28.4)#32 |
| 33. | Norris Canyon | 29.66% | 2.32%(+27.3)#4 | 1.44%(+28.2)#33 |
| 34. | Blawenburg | 29.46% | 4.67%(+24.8)#16 | 1.44%(+28.0)#34 |
| 35. | Mountain House | 28.90% | 2.32%(+26.6)#5 | 1.44%(+27.5)#35 |
| 36. | Lowndesville | 28.80% | 0.56%(+28.2)#1 | 1.44%(+27.4)#36 |
| 37. | South Barrington | 28.35% | 2.15%(+26.2)#1 | 1.44%(+26.9)#37 |
| 38. | Bothell East | 28.33% | 2.01%(+26.3)#1 | 1.44%(+26.9)#38 |
| 39. | Oak Grove | 27.52% | 1.97%(+25.5)#5 | 1.44%(+26.1)#39 |
| 40. | Mcnair | 27.24% | 1.97%(+25.3)#6 | 1.44%(+25.8)#40 |
| 41. | Dublin | 27.23% | 2.32%(+24.9)#6 | 1.44%(+25.8)#41 |
| 42. | Harlingen | 25.87% | 4.67%(+21.2)#17 | 1.44%(+24.4)#42 |
| 43. | Arcola | 25.52% | 1.97%(+23.6)#7 | 1.44%(+24.1)#43 |
| 44. | Bradley Gardens | 25.40% | 4.67%(+20.7)#18 | 1.44%(+24.0)#44 |
| 45. | Franklin Park | 25.27% | 4.67%(+20.6)#19 | 1.44%(+23.8)#45 |
| 46. | Exton | 25.06% | 1.28%(+23.8)#3 | 1.44%(+23.6)#46 |
| 47. | Sky Valley | 24.87% | 1.65%(+23.2)#1 | 1.44%(+23.4)#47 |
| 48. | Mill Creek East | 24.52% | 2.01%(+22.5)#2 | 1.44%(+23.1)#48 |
| 49. | Lake Hiawatha | 24.07% | 4.67%(+19.4)#20 | 1.44%(+22.6)#49 |
| 50. | Wyndham | 22.91% | 1.97%(+20.9)#8 | 1.44%(+21.5)#50 |
| 51. | North New Hyde Park | 22.80% | 2.12%(+20.7)#3 | 1.44%(+21.4)#51 |
| 52. | Milpitas | 22.77% | 2.32%(+20.4)#7 | 1.44%(+21.3)#52 |
| 53. | San Ramon | 22.71% | 2.32%(+20.4)#8 | 1.44%(+21.3)#53 |
| 54. | Secaucus | 22.44% | 4.67%(+17.8)#21 | 1.44%(+21.0)#54 |
| 55. | Weston | 21.83% | 4.67%(+17.2)#22 | 1.44%(+20.4)#55 |
| 56. | Herricks | 21.66% | 2.12%(+19.5)#4 | 1.44%(+20.2)#56 |
| 57. | Navy | 21.61% | 1.97%(+19.6)#9 | 1.44%(+20.2)#57 |
| 58. | Kendall Park | 21.60% | 4.67%(+16.9)#23 | 1.44%(+20.2)#58 |
| 59. | Pleasanton | 21.56% | 2.32%(+19.2)#9 | 1.44%(+20.1)#59 |
| 60. | Redmond | 21.38% | 2.01%(+19.4)#3 | 1.44%(+19.9)#60 |
| 61. | Livingston | 21.26% | 2.32%(+18.9)#10 | 1.44%(+19.8)#61 |
| 62. | Searingtown | 20.85% | 2.12%(+18.7)#5 | 1.44%(+19.4)#62 |
| 63. | Mountainhome | 20.72% | 1.28%(+19.4)#4 | 1.44%(+19.3)#63 |
| 64. | Carteret Borough | 20.71% | 4.67%(+16.0)#24 | 1.44%(+19.3)#64 |
| 65. | Coppell | 20.61% | 1.75%(+18.9)#2 | 1.44%(+19.2)#65 |
| 66. | Crescent | 20.52% | 1.65%(+18.9)#2 | 1.44%(+19.1)#66 |
| 67. | Floris | 20.22% | 1.97%(+18.3)#10 | 1.44%(+18.8)#67 |
| 68. | Hicksville | 20.06% | 2.12%(+17.9)#6 | 1.44%(+18.6)#68 |
| 69. | Blackwells Mills | 20.03% | 4.67%(+15.4)#25 | 1.44%(+18.6)#69 |
| 70. | Sunnyvale | 19.99% | 1.75%(+18.2)#3 | 1.44%(+18.6)#70 |
| 71. | Sunnyvale | 19.55% | 2.32%(+17.2)#11 | 1.44%(+18.1)#71 |
| 72. | Valle Hill | 19.23% | 0.16%(+19.1)#1 | 1.44%(+17.8)#72 |
| 73. | Menlo Park Terrace | 19.22% | 4.67%(+14.5)#26 | 1.44%(+17.8)#73 |
| 74. | Garden City Park | 18.83% | 2.12%(+16.7)#7 | 1.44%(+17.4)#74 |
| 75. | Hatfield Borough | 18.83% | 1.28%(+17.5)#5 | 1.44%(+17.4)#75 |
| 76. | Hope | 18.72% | 4.67%(+14.0)#27 | 1.44%(+17.3)#76 |
| 77. | Hurstbourne | 18.72% | 0.44%(+18.3)#3 | 1.44%(+17.3)#77 |
| 78. | Murphy | 18.40% | 1.75%(+16.7)#4 | 1.44%(+17.0)#78 |
| 79. | Short Hills | 18.37% | 4.67%(+13.7)#28 | 1.44%(+16.9)#79 |
| 80. | Union Hill Novelty Hill | 18.28% | 2.01%(+16.3)#4 | 1.44%(+16.8)#80 |
| 81. | Goose Creek | 18.10% | 1.97%(+16.1)#11 | 1.44%(+16.7)#81 |
| 82. | Oatman | 18.09% | 0.96%(+17.1)#1 | 1.44%(+16.6)#82 |
| 83. | Santa Clara | 17.95% | 2.32%(+15.6)#12 | 1.44%(+16.5)#83 |
| 84. | Princeton Junction | 17.85% | 4.67%(+13.2)#29 | 1.44%(+16.4)#84 |
| 85. | Lamy | 17.80% | 0.28%(+17.5)#1 | 1.44%(+16.4)#85 |
| 86. | Frisco | 17.74% | 1.75%(+16.0)#5 | 1.44%(+16.3)#86 |
| 87. | Churchtown | 17.70% | 1.28%(+16.4)#6 | 1.44%(+16.3)#87 |
| 88. | Sammamish | 17.69% | 2.01%(+15.7)#5 | 1.44%(+16.2)#88 |
| 89. | Voorhees | 17.58% | 4.67%(+12.9)#30 | 1.44%(+16.1)#89 |
| 90. | South Riding | 17.54% | 1.97%(+15.6)#12 | 1.44%(+16.1)#90 |
| 91. | Clarksburg | 17.51% | 1.89%(+15.6)#1 | 1.44%(+16.1)#91 |
| 92. | Pine Brook | 17.26% | 4.67%(+12.6)#31 | 1.44%(+15.8)#92 |
| 93. | Marvin | 17.12% | 1.19%(+15.9)#2 | 1.44%(+15.7)#93 |
| 94. | Inverness | 16.96% | 0.65%(+16.3)#1 | 1.44%(+15.5)#94 |
| 95. | Bethany | 16.77% | 0.81%(+16.0)#1 | 1.44%(+15.3)#95 |
| 96. | Pleasant Plains | 16.76% | 4.67%(+12.1)#32 | 1.44%(+15.3)#96 |
| 97. | Short Pump | 16.61% | 1.97%(+14.6)#13 | 1.44%(+15.2)#97 |
| 98. | Sierra Ridge | 16.54% | 0.65%(+15.9)#2 | 1.44%(+15.1)#98 |
| 99. | Innsbrook | 16.53% | 1.97%(+14.6)#14 | 1.44%(+15.1)#99 |
| 100. | Pomona | 16.49% | 4.67%(+11.8)#33 | 1.44%(+15.1)#100 |
Common Questions
What are the Top 10 Cities with the Highest Percentage of Thai Population in the United States?
Top 10 Cities with the Highest Percentage of Thai Population in the United States are:
#1
54.84%
#2
50.00%
#3
47.76%
#4
46.93%
#5
46.89%
#6
44.80%
#7
44.78%
#8
43.50%
#9
39.23%
#10
36.22%
What city has the Highest Percentage of Thai Population in the United States?
Ten Mile Run has the Highest Percentage of Thai Population in the United States with 54.84%.
What is the Percentage of Thai Population in the United States?
Percentage of Thai Population in the United States is 1.44%.