Cities with the Highest Percentage of Thai Population in Ohio
RELATED REPORTS & OPTIONS
Thai
Ohio
Compare Cities
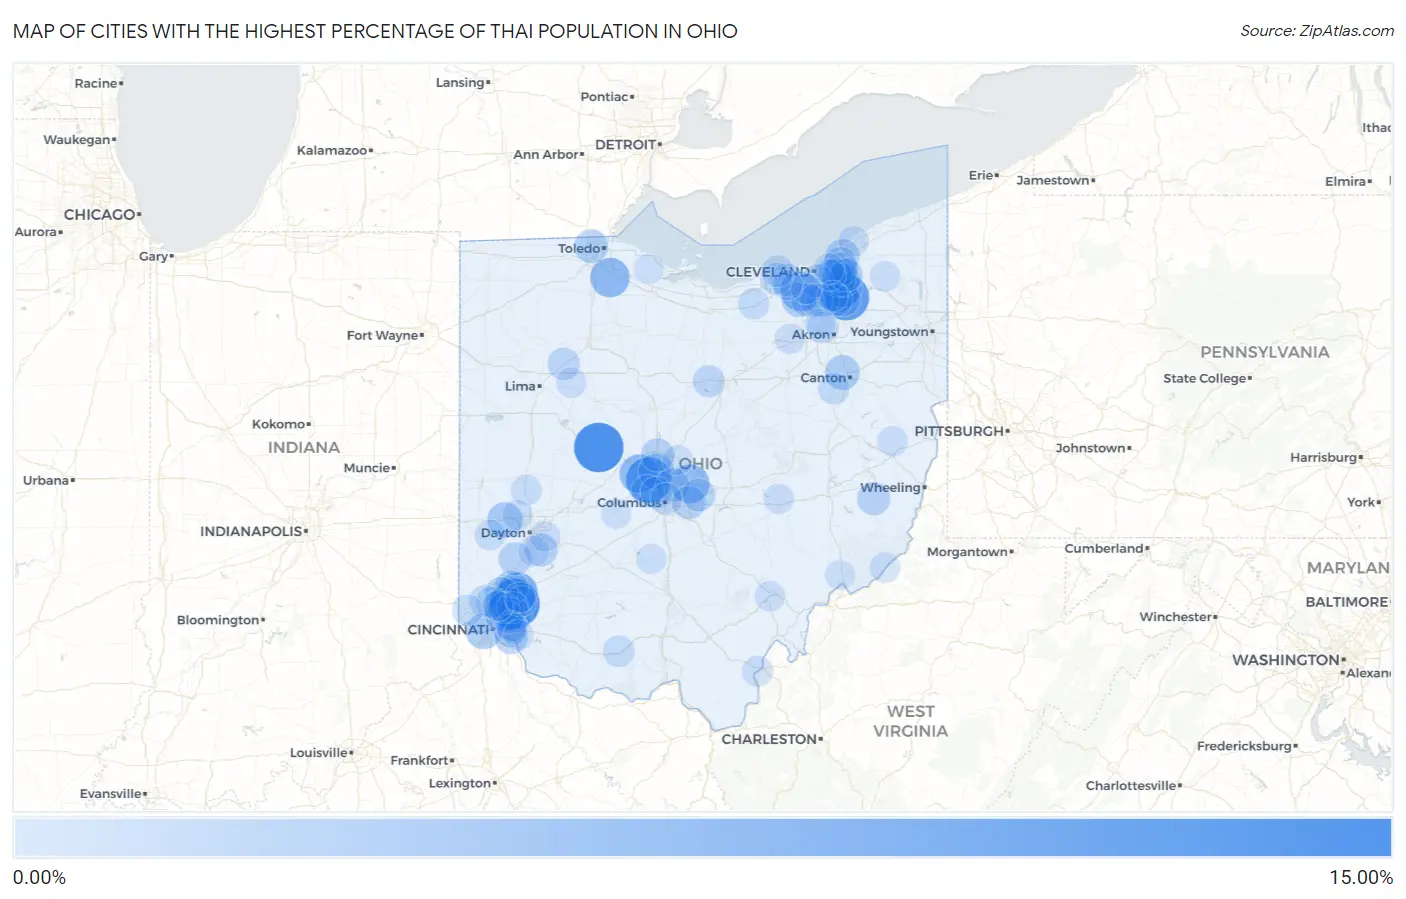
Map of Cities with the Highest Percentage of Thai Population in Ohio
0.00%
15.00%
Cities with the Highest Percentage of Thai Population in Ohio
| City | Thai | vs State | vs National | |
| 1. | East Liberty | 14.11% | 0.92%(+13.2)#1 | 1.44%(+12.7)#128 |
| 2. | Sixteen Mile Stand | 14.01% | 0.92%(+13.1)#2 | 1.44%(+12.6)#129 |
| 3. | Reminderville | 11.63% | 0.92%(+10.7)#3 | 1.44%(+10.2)#177 |
| 4. | Dublin | 11.23% | 0.92%(+10.3)#4 | 1.44%(+9.79)#191 |
| 5. | Mason | 7.85% | 0.92%(+6.94)#5 | 1.44%(+6.42)#329 |
| 6. | Blue Ash | 7.62% | 0.92%(+6.70)#6 | 1.44%(+6.18)#344 |
| 7. | Middleburg Heights | 7.25% | 0.92%(+6.33)#7 | 1.44%(+5.81)#370 |
| 8. | Luckey | 7.23% | 0.92%(+6.32)#8 | 1.44%(+5.80)#372 |
| 9. | Glenwillow | 7.18% | 0.92%(+6.27)#9 | 1.44%(+5.75)#376 |
| 10. | New Albany | 6.93% | 0.92%(+6.02)#10 | 1.44%(+5.49)#398 |
| 11. | Gomer | 6.77% | 0.92%(+5.85)#11 | 1.44%(+5.33)#413 |
| 12. | New California | 6.76% | 0.92%(+5.84)#12 | 1.44%(+5.32)#414 |
| 13. | Solon | 6.41% | 0.92%(+5.49)#13 | 1.44%(+4.97)#444 |
| 14. | Delshire | 4.92% | 0.92%(+4.01)#14 | 1.44%(+3.49)#626 |
| 15. | Powell | 4.84% | 0.92%(+3.92)#15 | 1.44%(+3.40)#637 |
| 16. | Amberley | 4.81% | 0.92%(+3.90)#16 | 1.44%(+3.37)#641 |
| 17. | Brookville | 4.74% | 0.92%(+3.82)#17 | 1.44%(+3.30)#652 |
| 18. | Twinsburg | 4.54% | 0.92%(+3.62)#18 | 1.44%(+3.10)#696 |
| 19. | Hills And Dales | 4.33% | 0.92%(+3.41)#19 | 1.44%(+2.89)#743 |
| 20. | The Village Of Indian Hill | 4.30% | 0.92%(+3.38)#20 | 1.44%(+2.86)#755 |
| 21. | Willoughby Hills | 4.04% | 0.92%(+3.13)#21 | 1.44%(+2.60)#828 |
| 22. | Sharonville | 3.98% | 0.92%(+3.06)#22 | 1.44%(+2.54)#848 |
| 23. | Concorde Hills | 3.87% | 0.92%(+2.96)#23 | 1.44%(+2.44)#890 |
| 24. | Strongsville | 3.85% | 0.92%(+2.94)#24 | 1.44%(+2.41)#901 |
| 25. | Ottawa Hills | 3.70% | 0.92%(+2.79)#25 | 1.44%(+2.26)#938 |
| 26. | Pepper Pike | 3.64% | 0.92%(+2.73)#26 | 1.44%(+2.21)#957 |
| 27. | Minerva Park | 3.43% | 0.92%(+2.52)#27 | 1.44%(+1.99)#1,019 |
| 28. | Four Bridges | 3.42% | 0.92%(+2.50)#28 | 1.44%(+1.98)#1,026 |
| 29. | Orange | 3.41% | 0.92%(+2.49)#29 | 1.44%(+1.97)#1,030 |
| 30. | Delaware | 3.38% | 0.92%(+2.46)#30 | 1.44%(+1.94)#1,035 |
| 31. | Highland Heights | 3.36% | 0.92%(+2.45)#31 | 1.44%(+1.93)#1,040 |
| 32. | Beachwood | 3.36% | 0.92%(+2.44)#32 | 1.44%(+1.92)#1,041 |
| 33. | Brecksville | 3.33% | 0.92%(+2.41)#33 | 1.44%(+1.89)#1,050 |
| 34. | Moreland Hills | 3.31% | 0.92%(+2.40)#34 | 1.44%(+1.88)#1,054 |
| 35. | Beckett Ridge | 3.31% | 0.92%(+2.39)#35 | 1.44%(+1.87)#1,056 |
| 36. | Coldstream | 3.26% | 0.92%(+2.35)#36 | 1.44%(+1.82)#1,076 |
| 37. | Barnesville | 3.26% | 0.92%(+2.34)#37 | 1.44%(+1.82)#1,077 |
| 38. | Reynoldsburg | 3.25% | 0.92%(+2.33)#38 | 1.44%(+1.81)#1,086 |
| 39. | Carlisle | 3.24% | 0.92%(+2.33)#39 | 1.44%(+1.81)#1,090 |
| 40. | Mayfield Heights | 3.23% | 0.92%(+2.31)#40 | 1.44%(+1.79)#1,100 |
| 41. | Cuyahoga Heights | 3.19% | 0.92%(+2.27)#41 | 1.44%(+1.75)#1,120 |
| 42. | Hunting Valley | 3.12% | 0.92%(+2.21)#42 | 1.44%(+1.69)#1,149 |
| 43. | Bellbrook | 3.11% | 0.92%(+2.20)#43 | 1.44%(+1.68)#1,157 |
| 44. | North Royalton | 3.11% | 0.92%(+2.19)#44 | 1.44%(+1.67)#1,159 |
| 45. | Kenwood | 3.10% | 0.92%(+2.19)#45 | 1.44%(+1.66)#1,163 |
| 46. | Pataskala | 3.05% | 0.92%(+2.13)#46 | 1.44%(+1.61)#1,190 |
| 47. | Westlake | 2.97% | 0.92%(+2.06)#47 | 1.44%(+1.53)#1,223 |
| 48. | Hilliard | 2.89% | 0.92%(+1.98)#48 | 1.44%(+1.45)#1,261 |
| 49. | Broadview Heights | 2.69% | 0.92%(+1.78)#49 | 1.44%(+1.26)#1,369 |
| 50. | Sherwood | 2.64% | 0.92%(+1.72)#50 | 1.44%(+1.20)#1,394 |
| 51. | Bluffton | 2.63% | 0.92%(+1.71)#51 | 1.44%(+1.19)#1,402 |
| 52. | Ontario | 2.45% | 0.92%(+1.54)#52 | 1.44%(+1.02)#1,498 |
| 53. | Avon | 2.42% | 0.92%(+1.51)#53 | 1.44%(+0.984)#1,512 |
| 54. | Pleasant Run | 2.42% | 0.92%(+1.50)#54 | 1.44%(+0.978)#1,518 |
| 55. | Avon Lake | 2.36% | 0.92%(+1.45)#55 | 1.44%(+0.926)#1,548 |
| 56. | Macedonia | 2.33% | 0.92%(+1.42)#56 | 1.44%(+0.896)#1,573 |
| 57. | Upper Arlington | 2.33% | 0.92%(+1.42)#57 | 1.44%(+0.894)#1,575 |
| 58. | Fairlawn | 2.33% | 0.92%(+1.41)#58 | 1.44%(+0.888)#1,576 |
| 59. | Columbus | 2.28% | 0.92%(+1.36)#59 | 1.44%(+0.839)#1,614 |
| 60. | Reedurban | 2.25% | 0.92%(+1.33)#60 | 1.44%(+0.812)#1,633 |
| 61. | Peebles | 2.22% | 0.92%(+1.30)#61 | 1.44%(+0.778)#1,655 |
| 62. | Shaker Heights | 2.15% | 0.92%(+1.23)#62 | 1.44%(+0.713)#1,687 |
| 63. | Madeira | 2.07% | 0.92%(+1.15)#63 | 1.44%(+0.631)#1,738 |
| 64. | Oberlin | 2.05% | 0.92%(+1.13)#64 | 1.44%(+0.613)#1,757 |
| 65. | Navarre | 2.03% | 0.92%(+1.12)#65 | 1.44%(+0.597)#1,770 |
| 66. | Glendale | 2.00% | 0.92%(+1.08)#66 | 1.44%(+0.559)#1,799 |
| 67. | Forest Park | 1.99% | 0.92%(+1.08)#67 | 1.44%(+0.557)#1,803 |
| 68. | Montgomery | 1.95% | 0.92%(+1.03)#68 | 1.44%(+0.513)#1,841 |
| 69. | Blue Jay | 1.82% | 0.92%(+0.902)#69 | 1.44%(+0.381)#1,963 |
| 70. | Gallipolis | 1.80% | 0.92%(+0.882)#70 | 1.44%(+0.361)#1,994 |
| 71. | Evendale | 1.76% | 0.92%(+0.849)#71 | 1.44%(+0.327)#2,031 |
| 72. | Centerville | 1.71% | 0.92%(+0.798)#72 | 1.44%(+0.276)#2,082 |
| 73. | Cleveland Heights | 1.70% | 0.92%(+0.779)#73 | 1.44%(+0.258)#2,106 |
| 74. | Troy | 1.69% | 0.92%(+0.775)#74 | 1.44%(+0.254)#2,109 |
| 75. | Northfield | 1.66% | 0.92%(+0.748)#75 | 1.44%(+0.226)#2,132 |
| 76. | Mentor | 1.63% | 0.92%(+0.712)#76 | 1.44%(+0.190)#2,164 |
| 77. | West Alexandria | 1.60% | 0.92%(+0.679)#77 | 1.44%(+0.158)#2,204 |
| 78. | Loveland Park | 1.59% | 0.92%(+0.674)#78 | 1.44%(+0.152)#2,209 |
| 79. | Parma Heights | 1.58% | 0.92%(+0.668)#79 | 1.44%(+0.147)#2,222 |
| 80. | Jewett | 1.54% | 0.92%(+0.628)#80 | 1.44%(+0.107)#2,276 |
| 81. | Beavercreek | 1.52% | 0.92%(+0.608)#81 | 1.44%(+0.087)#2,298 |
| 82. | Newtown | 1.52% | 0.92%(+0.608)#82 | 1.44%(+0.086)#2,299 |
| 83. | Athens | 1.49% | 0.92%(+0.577)#83 | 1.44%(+0.056)#2,332 |
| 84. | North Zanesville | 1.48% | 0.92%(+0.565)#84 | 1.44%(+0.044)#2,347 |
| 85. | Matamoras | 1.47% | 0.92%(+0.557)#85 | 1.44%(+0.036)#2,363 |
| 86. | Ada | 1.45% | 0.92%(+0.538)#86 | 1.44%(+0.017)#2,383 |
| 87. | Middlefield | 1.45% | 0.92%(+0.536)#87 | 1.44%(+0.015)#2,385 |
| 88. | Gloria Glens Park | 1.45% | 0.92%(+0.533)#88 | 1.44%(+0.012)#2,389 |
| 89. | Dry Run | 1.44% | 0.92%(+0.527)#89 | 1.44%(+0.005)#2,400 |
| 90. | Woodlawn | 1.42% | 0.92%(+0.508)#90 | 1.44%(-0.013)#2,433 |
| 91. | Landen | 1.40% | 0.92%(+0.483)#91 | 1.44%(-0.038)#2,477 |
| 92. | Clayton | 1.39% | 0.92%(+0.476)#92 | 1.44%(-0.046)#2,487 |
| 93. | North Olmsted | 1.37% | 0.92%(+0.455)#93 | 1.44%(-0.067)#2,513 |
| 94. | London | 1.36% | 0.92%(+0.441)#94 | 1.44%(-0.080)#2,530 |
| 95. | Williamsport | 1.36% | 0.92%(+0.441)#95 | 1.44%(-0.080)#2,531 |
| 96. | Devola | 1.35% | 0.92%(+0.433)#96 | 1.44%(-0.089)#2,545 |
| 97. | Montrose Ghent | 1.30% | 0.92%(+0.382)#97 | 1.44%(-0.139)#2,619 |
| 98. | Withamsville | 1.29% | 0.92%(+0.378)#98 | 1.44%(-0.143)#2,625 |
| 99. | Sunbury | 1.28% | 0.92%(+0.368)#99 | 1.44%(-0.154)#2,644 |
| 100. | Oak Harbor | 1.27% | 0.92%(+0.353)#100 | 1.44%(-0.168)#2,667 |
Common Questions
What are the Top 10 Cities with the Highest Percentage of Thai Population in Ohio?
Top 10 Cities with the Highest Percentage of Thai Population in Ohio are:
#1
14.11%
#2
14.01%
#3
11.63%
#4
11.23%
#5
7.85%
#6
7.62%
#7
7.25%
#8
7.23%
#9
7.18%
#10
6.93%
What city has the Highest Percentage of Thai Population in Ohio?
East Liberty has the Highest Percentage of Thai Population in Ohio with 14.11%.
What is the Percentage of Thai Population in the State of Ohio?
Percentage of Thai Population in Ohio is 0.92%.
What is the Percentage of Thai Population in the United States?
Percentage of Thai Population in the United States is 1.44%.