Cities with the Highest Percentage of Thai Population in Oregon
RELATED REPORTS & OPTIONS
Thai
Oregon
Compare Cities
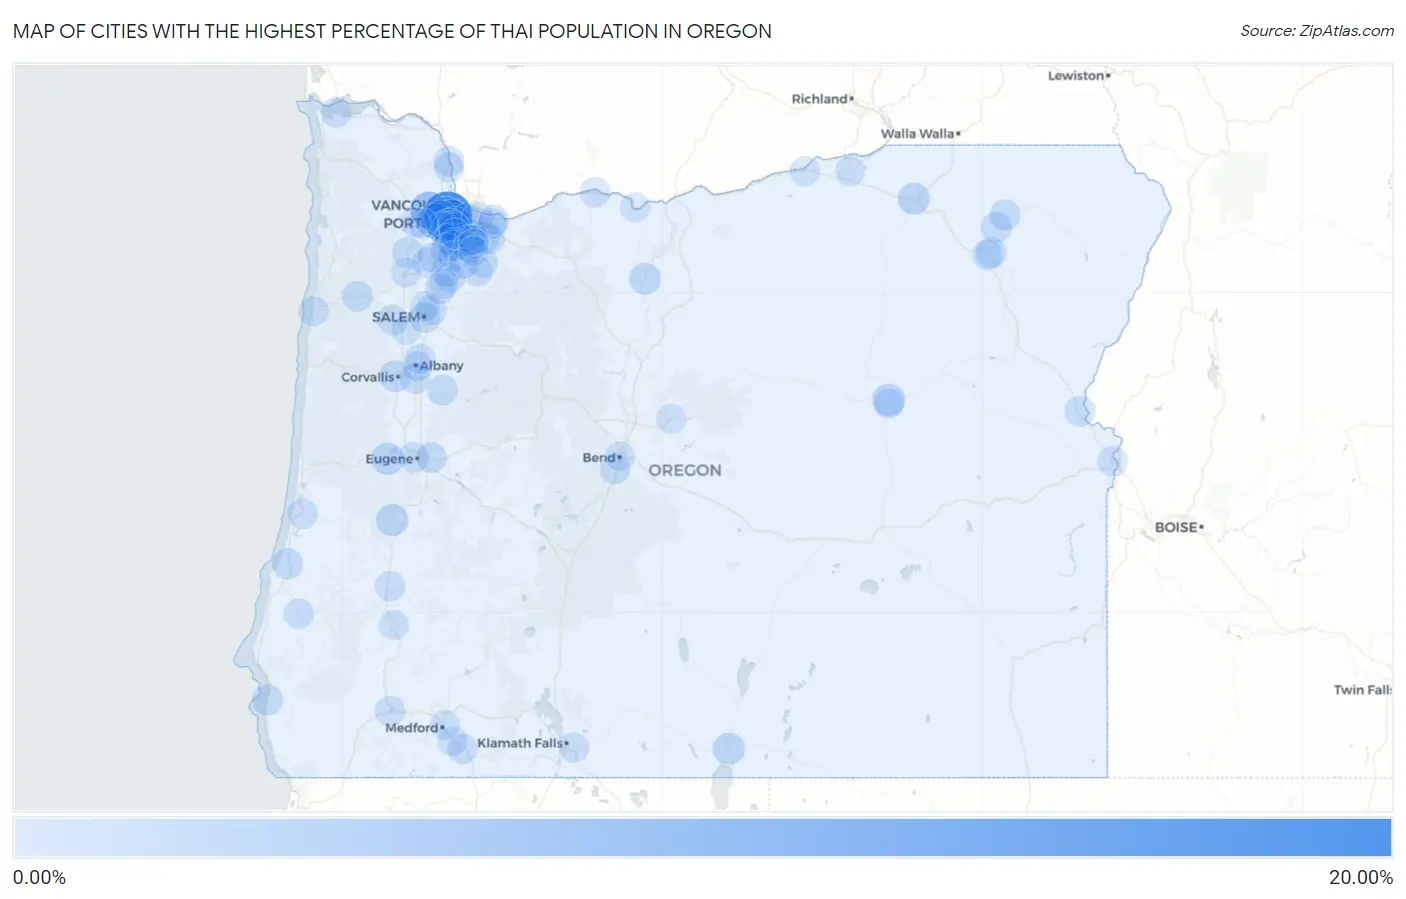
Map of Cities with the Highest Percentage of Thai Population in Oregon
0.00%
20.00%
Cities with the Highest Percentage of Thai Population in Oregon
| City | Thai | vs State | vs National | |
| 1. | Bethany | 16.77% | 0.81%(+16.0)#1 | 1.44%(+15.3)#95 |
| 2. | Oak Hills | 11.43% | 0.81%(+10.6)#2 | 1.44%(+10.00)#183 |
| 3. | Cedar Mill | 9.06% | 0.81%(+8.25)#3 | 1.44%(+7.62)#260 |
| 4. | North Plains | 5.71% | 0.81%(+4.89)#4 | 1.44%(+4.27)#517 |
| 5. | Hillsboro | 4.72% | 0.81%(+3.91)#5 | 1.44%(+3.29)#654 |
| 6. | Rockcreek | 3.48% | 0.81%(+2.66)#6 | 1.44%(+2.04)#1,003 |
| 7. | Beaverton | 3.25% | 0.81%(+2.44)#7 | 1.44%(+1.81)#1,084 |
| 8. | West Haven Sylvan | 3.24% | 0.81%(+2.42)#8 | 1.44%(+1.80)#1,096 |
| 9. | Lake Oswego | 2.40% | 0.81%(+1.59)#9 | 1.44%(+0.965)#1,521 |
| 10. | Dunthorpe | 2.32% | 0.81%(+1.51)#10 | 1.44%(+0.883)#1,583 |
| 11. | Cedar Hills | 2.23% | 0.81%(+1.41)#11 | 1.44%(+0.788)#1,647 |
| 12. | John Day | 2.11% | 0.81%(+1.30)#12 | 1.44%(+0.677)#1,712 |
| 13. | Veneta | 2.05% | 0.81%(+1.24)#13 | 1.44%(+0.610)#1,759 |
| 14. | Drain | 1.80% | 0.81%(+0.989)#14 | 1.44%(+0.364)#1,989 |
| 15. | Lakeview | 1.73% | 0.81%(+0.918)#15 | 1.44%(+0.293)#2,065 |
| 16. | Gopher Flats | 1.56% | 0.81%(+0.750)#16 | 1.44%(+0.125)#2,250 |
| 17. | Aloha | 1.42% | 0.81%(+0.611)#17 | 1.44%(-0.014)#2,438 |
| 18. | Happy Valley | 1.42% | 0.81%(+0.611)#18 | 1.44%(-0.014)#2,439 |
| 19. | Maupin | 1.40% | 0.81%(+0.592)#19 | 1.44%(-0.033)#2,467 |
| 20. | Corvallis | 1.31% | 0.81%(+0.493)#20 | 1.44%(-0.132)#2,603 |
| 21. | Tigard | 1.10% | 0.81%(+0.286)#21 | 1.44%(-0.339)#2,965 |
| 22. | Marlene | 1.10% | 0.81%(+0.285)#22 | 1.44%(-0.340)#2,968 |
| 23. | Cherry Grove | 1.02% | 0.81%(+0.210)#23 | 1.44%(-0.415)#3,122 |
| 24. | Milwaukie | 1.01% | 0.81%(+0.202)#24 | 1.44%(-0.423)#3,141 |
| 25. | Raleigh Hills | 1.01% | 0.81%(+0.197)#25 | 1.44%(-0.428)#3,152 |
| 26. | Bull Mountain | 0.90% | 0.81%(+0.089)#26 | 1.44%(-0.536)#3,384 |
| 27. | Portland | 0.88% | 0.81%(+0.069)#27 | 1.44%(-0.556)#3,420 |
| 28. | Nesika Beach | 0.85% | 0.81%(+0.033)#28 | 1.44%(-0.592)#3,501 |
| 29. | West Slope | 0.81% | 0.81%(-0.002)#29 | 1.44%(-0.627)#3,578 |
| 30. | Donald | 0.78% | 0.81%(-0.030)#30 | 1.44%(-0.656)#3,669 |
| 31. | Summerville | 0.77% | 0.81%(-0.043)#31 | 1.44%(-0.668)#3,705 |
| 32. | Yamhill | 0.76% | 0.81%(-0.052)#32 | 1.44%(-0.677)#3,728 |
| 33. | Island City | 0.76% | 0.81%(-0.053)#33 | 1.44%(-0.678)#3,731 |
| 34. | Durham | 0.75% | 0.81%(-0.059)#34 | 1.44%(-0.685)#3,752 |
| 35. | Coos Bay | 0.75% | 0.81%(-0.060)#35 | 1.44%(-0.685)#3,753 |
| 36. | Elgin | 0.75% | 0.81%(-0.064)#36 | 1.44%(-0.689)#3,758 |
| 37. | Maywood Park | 0.67% | 0.81%(-0.141)#37 | 1.44%(-0.766)#3,989 |
| 38. | Sherwood | 0.66% | 0.81%(-0.157)#38 | 1.44%(-0.782)#4,041 |
| 39. | Deschutes River Woods | 0.59% | 0.81%(-0.222)#39 | 1.44%(-0.848)#4,281 |
| 40. | Huntington | 0.59% | 0.81%(-0.226)#40 | 1.44%(-0.851)#4,296 |
| 41. | Dallas | 0.58% | 0.81%(-0.228)#41 | 1.44%(-0.853)#4,302 |
| 42. | Salem | 0.55% | 0.81%(-0.261)#42 | 1.44%(-0.886)#4,419 |
| 43. | Sodaville | 0.55% | 0.81%(-0.263)#43 | 1.44%(-0.888)#4,426 |
| 44. | Tualatin | 0.54% | 0.81%(-0.269)#44 | 1.44%(-0.894)#4,442 |
| 45. | Bayshore | 0.52% | 0.81%(-0.289)#45 | 1.44%(-0.914)#4,499 |
| 46. | Hayesville | 0.52% | 0.81%(-0.294)#46 | 1.44%(-0.920)#4,520 |
| 47. | Eugene | 0.51% | 0.81%(-0.297)#47 | 1.44%(-0.923)#4,534 |
| 48. | Grand Ronde | 0.50% | 0.81%(-0.316)#48 | 1.44%(-0.941)#4,595 |
| 49. | Springfield | 0.49% | 0.81%(-0.321)#49 | 1.44%(-0.947)#4,618 |
| 50. | Columbia City | 0.45% | 0.81%(-0.361)#50 | 1.44%(-0.986)#4,775 |
| 51. | Wilsonville | 0.44% | 0.81%(-0.370)#51 | 1.44%(-0.995)#4,797 |
| 52. | Beavercreek | 0.44% | 0.81%(-0.371)#52 | 1.44%(-0.996)#4,802 |
| 53. | Astoria | 0.42% | 0.81%(-0.390)#53 | 1.44%(-1.02)#4,893 |
| 54. | Metzger | 0.41% | 0.81%(-0.405)#54 | 1.44%(-1.03)#4,962 |
| 55. | La Grande | 0.39% | 0.81%(-0.423)#55 | 1.44%(-1.05)#5,054 |
| 56. | Tangent | 0.38% | 0.81%(-0.427)#56 | 1.44%(-1.05)#5,077 |
| 57. | Ontario | 0.38% | 0.81%(-0.433)#57 | 1.44%(-1.06)#5,113 |
| 58. | Reedsport | 0.37% | 0.81%(-0.441)#58 | 1.44%(-1.07)#5,147 |
| 59. | West Linn | 0.32% | 0.81%(-0.488)#59 | 1.44%(-1.11)#5,363 |
| 60. | Roseburg | 0.32% | 0.81%(-0.491)#60 | 1.44%(-1.12)#5,381 |
| 61. | Mulino | 0.32% | 0.81%(-0.494)#61 | 1.44%(-1.12)#5,400 |
| 62. | Cornelius | 0.32% | 0.81%(-0.495)#62 | 1.44%(-1.12)#5,404 |
| 63. | Gervais | 0.31% | 0.81%(-0.505)#63 | 1.44%(-1.13)#5,438 |
| 64. | Oak Grove | 0.30% | 0.81%(-0.516)#64 | 1.44%(-1.14)#5,499 |
| 65. | Santa Clara | 0.29% | 0.81%(-0.522)#65 | 1.44%(-1.15)#5,524 |
| 66. | Altamont | 0.28% | 0.81%(-0.537)#66 | 1.44%(-1.16)#5,596 |
| 67. | Grants Pass | 0.26% | 0.81%(-0.551)#67 | 1.44%(-1.18)#5,665 |
| 68. | Myrtle Point | 0.26% | 0.81%(-0.552)#68 | 1.44%(-1.18)#5,669 |
| 69. | Damascus | 0.26% | 0.81%(-0.556)#69 | 1.44%(-1.18)#5,689 |
| 70. | Dundee | 0.25% | 0.81%(-0.564)#70 | 1.44%(-1.19)#5,743 |
| 71. | Hood River | 0.24% | 0.81%(-0.571)#71 | 1.44%(-1.20)#5,787 |
| 72. | Forest Grove | 0.23% | 0.81%(-0.583)#72 | 1.44%(-1.21)#5,855 |
| 73. | Ashland | 0.22% | 0.81%(-0.588)#73 | 1.44%(-1.21)#5,888 |
| 74. | Wood Village | 0.22% | 0.81%(-0.592)#74 | 1.44%(-1.22)#5,906 |
| 75. | Albany | 0.21% | 0.81%(-0.601)#75 | 1.44%(-1.23)#5,963 |
| 76. | Gresham | 0.20% | 0.81%(-0.610)#76 | 1.44%(-1.24)#6,028 |
| 77. | Canby | 0.18% | 0.81%(-0.630)#77 | 1.44%(-1.26)#6,142 |
| 78. | Millersburg | 0.17% | 0.81%(-0.643)#78 | 1.44%(-1.27)#6,212 |
| 79. | Oatfield | 0.17% | 0.81%(-0.644)#79 | 1.44%(-1.27)#6,217 |
| 80. | Tri City | 0.16% | 0.81%(-0.655)#80 | 1.44%(-1.28)#6,298 |
| 81. | Lincoln City | 0.15% | 0.81%(-0.659)#81 | 1.44%(-1.28)#6,328 |
| 82. | St Helens | 0.15% | 0.81%(-0.662)#82 | 1.44%(-1.29)#6,350 |
| 83. | Prineville | 0.15% | 0.81%(-0.666)#83 | 1.44%(-1.29)#6,372 |
| 84. | Canyon City | 0.12% | 0.81%(-0.692)#84 | 1.44%(-1.32)#6,526 |
| 85. | Hubbard | 0.12% | 0.81%(-0.695)#85 | 1.44%(-1.32)#6,548 |
| 86. | Talent | 0.080% | 0.81%(-0.732)#86 | 1.44%(-1.36)#6,770 |
| 87. | Boardman | 0.078% | 0.81%(-0.734)#87 | 1.44%(-1.36)#6,786 |
| 88. | Gladstone | 0.075% | 0.81%(-0.737)#88 | 1.44%(-1.36)#6,814 |
| 89. | Hermiston | 0.062% | 0.81%(-0.750)#89 | 1.44%(-1.38)#6,882 |
| 90. | Medford | 0.051% | 0.81%(-0.761)#90 | 1.44%(-1.39)#6,956 |
| 91. | The Dalles | 0.044% | 0.81%(-0.768)#91 | 1.44%(-1.39)#7,002 |
| 92. | River Road | 0.035% | 0.81%(-0.778)#92 | 1.44%(-1.40)#7,066 |
| 93. | Independence | 0.030% | 0.81%(-0.782)#93 | 1.44%(-1.41)#7,089 |
| 94. | Keizer | 0.028% | 0.81%(-0.784)#94 | 1.44%(-1.41)#7,101 |
| 95. | Bend | 0.025% | 0.81%(-0.787)#95 | 1.44%(-1.41)#7,112 |
| 96. | Newberg | 0.012% | 0.81%(-0.800)#96 | 1.44%(-1.43)#7,165 |
| 97. | Oregon City | 0.011% | 0.81%(-0.801)#97 | 1.44%(-1.43)#7,172 |
| 98. | Mcminnville | 0.0087% | 0.81%(-0.803)#98 | 1.44%(-1.43)#7,181 |
| 99. | Woodburn | 0.0076% | 0.81%(-0.805)#99 | 1.44%(-1.43)#7,187 |
Common Questions
What are the Top 10 Cities with the Highest Percentage of Thai Population in Oregon?
Top 10 Cities with the Highest Percentage of Thai Population in Oregon are:
#1
16.77%
#2
11.43%
#3
9.06%
#4
5.71%
#5
4.72%
#6
3.48%
#7
3.25%
#8
3.24%
#9
2.40%
#10
2.23%
What city has the Highest Percentage of Thai Population in Oregon?
Bethany has the Highest Percentage of Thai Population in Oregon with 16.77%.
What is the Percentage of Thai Population in the State of Oregon?
Percentage of Thai Population in Oregon is 0.81%.
What is the Percentage of Thai Population in the United States?
Percentage of Thai Population in the United States is 1.44%.