Cities with the Highest Percentage of Immigrants from Europe in Indiana
RELATED REPORTS & OPTIONS
Europe
Indiana
Compare Cities
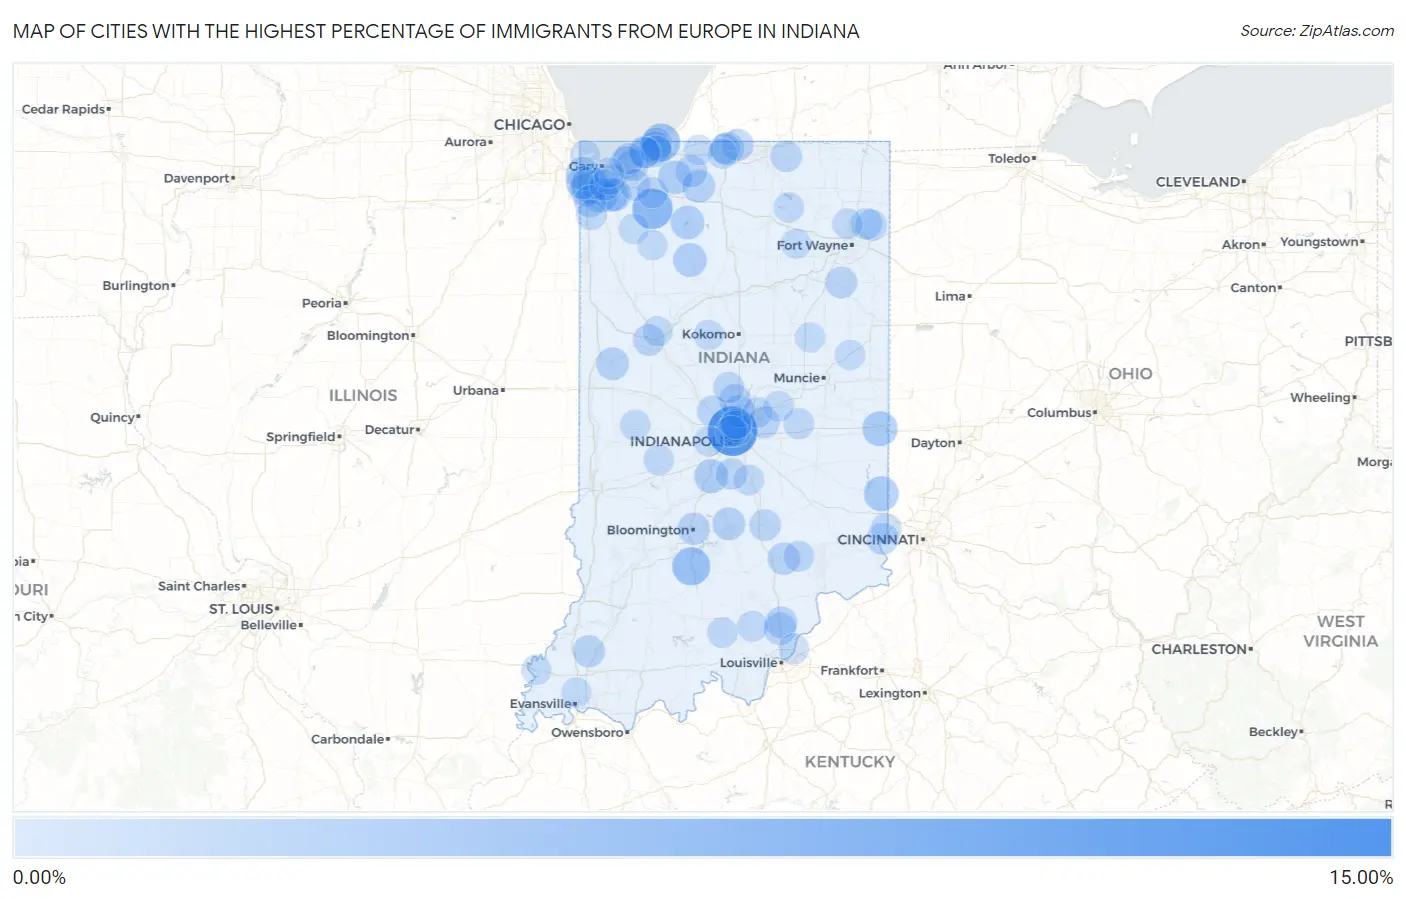
Map of Cities with the Highest Percentage of Immigrants from Europe in Indiana
0.00%
15.00%
Cities with the Highest Percentage of Immigrants from Europe in Indiana
| City | Europe | vs State | vs National | |
| 1. | Foster | 12.77% | 0.58%(+12.2)#1 | 1.46%(+11.3)#120 |
| 2. | Spring Hill | 11.11% | 0.58%(+10.5)#2 | 1.46%(+9.66)#166 |
| 3. | Lyford | 9.54% | 0.58%(+8.96)#3 | 1.46%(+8.08)#240 |
| 4. | Philadelphia | 8.52% | 0.58%(+7.94)#4 | 1.46%(+7.07)#306 |
| 5. | Hoffman Lake | 7.62% | 0.58%(+7.04)#5 | 1.46%(+6.17)#393 |
| 6. | Shipshewana Lake | 6.56% | 0.58%(+5.98)#6 | 1.46%(+5.11)#548 |
| 7. | Ontario | 6.54% | 0.58%(+5.96)#7 | 1.46%(+5.09)#553 |
| 8. | La Crosse | 6.16% | 0.58%(+5.58)#8 | 1.46%(+4.71)#632 |
| 9. | Avoca | 4.93% | 0.58%(+4.35)#9 | 1.46%(+3.47)#991 |
| 10. | Michiana Shores | 4.76% | 0.58%(+4.18)#10 | 1.46%(+3.31)#1,058 |
| 11. | Harrison Lake | 4.72% | 0.58%(+4.14)#11 | 1.46%(+3.27)#1,077 |
| 12. | Schererville | 4.35% | 0.58%(+3.77)#12 | 1.46%(+2.90)#1,251 |
| 13. | Floyds Knobs | 3.50% | 0.58%(+2.92)#13 | 1.46%(+2.04)#1,758 |
| 14. | Ardmore | 3.29% | 0.58%(+2.71)#14 | 1.46%(+1.84)#1,914 |
| 15. | Crown Point | 3.28% | 0.58%(+2.70)#15 | 1.46%(+1.83)#1,922 |
| 16. | Spring Grove | 3.28% | 0.58%(+2.70)#16 | 1.46%(+1.82)#1,927 |
| 17. | Mount Carmel | 3.23% | 0.58%(+2.65)#17 | 1.46%(+1.77)#1,981 |
| 18. | Bethany | 2.70% | 0.58%(+2.12)#18 | 1.46%(+1.25)#2,524 |
| 19. | Star City | 2.65% | 0.58%(+2.07)#19 | 1.46%(+1.20)#2,590 |
| 20. | Bass Lake | 2.65% | 0.58%(+2.07)#20 | 1.46%(+1.20)#2,594 |
| 21. | Kingsbury | 2.64% | 0.58%(+2.06)#21 | 1.46%(+1.19)#2,606 |
| 22. | Gilmer Park | 2.57% | 0.58%(+1.99)#22 | 1.46%(+1.12)#2,709 |
| 23. | Winfield | 2.55% | 0.58%(+1.97)#23 | 1.46%(+1.09)#2,743 |
| 24. | St John | 2.44% | 0.58%(+1.86)#24 | 1.46%(+0.985)#2,894 |
| 25. | Munster | 2.41% | 0.58%(+1.83)#25 | 1.46%(+0.954)#2,923 |
| 26. | Dyer | 2.30% | 0.58%(+1.72)#26 | 1.46%(+0.848)#3,091 |
| 27. | Rocky Ripple | 2.28% | 0.58%(+1.70)#27 | 1.46%(+0.824)#3,126 |
| 28. | Indian Village | 2.26% | 0.58%(+1.68)#28 | 1.46%(+0.800)#3,157 |
| 29. | Attica | 2.19% | 0.58%(+1.61)#29 | 1.46%(+0.729)#3,285 |
| 30. | Walkerton | 2.18% | 0.58%(+1.60)#30 | 1.46%(+0.720)#3,300 |
| 31. | Nashville | 2.16% | 0.58%(+1.58)#31 | 1.46%(+0.704)#3,328 |
| 32. | Memphis | 1.96% | 0.58%(+1.38)#32 | 1.46%(+0.507)#3,695 |
| 33. | Burns Harbor | 1.95% | 0.58%(+1.37)#33 | 1.46%(+0.495)#3,726 |
| 34. | Hayden | 1.94% | 0.58%(+1.36)#34 | 1.46%(+0.487)#3,740 |
| 35. | Long Beach | 1.94% | 0.58%(+1.36)#35 | 1.46%(+0.487)#3,742 |
| 36. | Lakes Of The Four Seasons | 1.94% | 0.58%(+1.36)#36 | 1.46%(+0.481)#3,749 |
| 37. | Bloomington | 1.92% | 0.58%(+1.34)#37 | 1.46%(+0.463)#3,778 |
| 38. | Carmel | 1.91% | 0.58%(+1.33)#38 | 1.46%(+0.459)#3,789 |
| 39. | Chesterton | 1.91% | 0.58%(+1.33)#39 | 1.46%(+0.454)#3,797 |
| 40. | Beverly Shores | 1.90% | 0.58%(+1.32)#40 | 1.46%(+0.447)#3,813 |
| 41. | Pottawattamie Park | 1.89% | 0.58%(+1.31)#41 | 1.46%(+0.437)#3,834 |
| 42. | Francisco | 1.83% | 0.58%(+1.25)#42 | 1.46%(+0.377)#3,965 |
| 43. | Henryville | 1.80% | 0.58%(+1.22)#43 | 1.46%(+0.341)#4,040 |
| 44. | Uniondale | 1.79% | 0.58%(+1.21)#44 | 1.46%(+0.338)#4,046 |
| 45. | Fish Lake | 1.79% | 0.58%(+1.21)#45 | 1.46%(+0.334)#4,053 |
| 46. | Granger | 1.78% | 0.58%(+1.20)#46 | 1.46%(+0.326)#4,072 |
| 47. | Underwood | 1.77% | 0.58%(+1.19)#47 | 1.46%(+0.313)#4,112 |
| 48. | Cedar Lake | 1.77% | 0.58%(+1.19)#48 | 1.46%(+0.310)#4,119 |
| 49. | Mccordsville | 1.73% | 0.58%(+1.15)#49 | 1.46%(+0.270)#4,204 |
| 50. | Westfield | 1.64% | 0.58%(+1.06)#50 | 1.46%(+0.181)#4,413 |
| 51. | Lawrenceburg | 1.63% | 0.58%(+1.05)#51 | 1.46%(+0.178)#4,419 |
| 52. | Hobart | 1.60% | 0.58%(+1.02)#52 | 1.46%(+0.147)#4,501 |
| 53. | West Lafayette | 1.60% | 0.58%(+1.02)#53 | 1.46%(+0.145)#4,509 |
| 54. | Columbus | 1.54% | 0.58%(+0.960)#54 | 1.46%(+0.085)#4,683 |
| 55. | Trail Creek | 1.54% | 0.58%(+0.956)#55 | 1.46%(+0.080)#4,699 |
| 56. | Leo Cedarville | 1.45% | 0.58%(+0.872)#56 | 1.46%(-0.003)#4,977 |
| 57. | Valparaiso | 1.44% | 0.58%(+0.862)#57 | 1.46%(-0.014)#5,011 |
| 58. | Middlebury | 1.44% | 0.58%(+0.861)#58 | 1.46%(-0.014)#5,013 |
| 59. | Whitestown | 1.43% | 0.58%(+0.854)#59 | 1.46%(-0.022)#5,032 |
| 60. | Grabill | 1.42% | 0.58%(+0.840)#60 | 1.46%(-0.036)#5,075 |
| 61. | Sheridan | 1.41% | 0.58%(+0.835)#61 | 1.46%(-0.041)#5,085 |
| 62. | North Crows Nest | 1.41% | 0.58%(+0.828)#62 | 1.46%(-0.047)#5,102 |
| 63. | Wynnedale | 1.38% | 0.58%(+0.796)#63 | 1.46%(-0.080)#5,211 |
| 64. | Dune Acres | 1.37% | 0.58%(+0.785)#64 | 1.46%(-0.091)#5,249 |
| 65. | Lake Of The Woods | 1.36% | 0.58%(+0.776)#65 | 1.46%(-0.100)#5,283 |
| 66. | Merrillville | 1.35% | 0.58%(+0.773)#66 | 1.46%(-0.103)#5,295 |
| 67. | Bargersville | 1.33% | 0.58%(+0.754)#67 | 1.46%(-0.122)#5,355 |
| 68. | Wanatah | 1.32% | 0.58%(+0.740)#68 | 1.46%(-0.135)#5,390 |
| 69. | Town Of Pines | 1.23% | 0.58%(+0.649)#69 | 1.46%(-0.227)#5,728 |
| 70. | Vernon | 1.21% | 0.58%(+0.630)#70 | 1.46%(-0.246)#5,797 |
| 71. | Wilkinson | 1.15% | 0.58%(+0.567)#71 | 1.46%(-0.309)#6,050 |
| 72. | Franklin | 1.15% | 0.58%(+0.567)#72 | 1.46%(-0.309)#6,051 |
| 73. | New Pekin | 1.14% | 0.58%(+0.564)#73 | 1.46%(-0.312)#6,064 |
| 74. | Pendleton | 1.13% | 0.58%(+0.554)#74 | 1.46%(-0.322)#6,105 |
| 75. | Hardinsburg | 1.12% | 0.58%(+0.537)#75 | 1.46%(-0.339)#6,188 |
| 76. | Hidden Valley | 1.10% | 0.58%(+0.517)#76 | 1.46%(-0.359)#6,260 |
| 77. | Utica | 1.07% | 0.58%(+0.493)#77 | 1.46%(-0.383)#6,369 |
| 78. | Huntertown | 1.05% | 0.58%(+0.465)#78 | 1.46%(-0.411)#6,496 |
| 79. | North Webster | 1.04% | 0.58%(+0.459)#79 | 1.46%(-0.416)#6,518 |
| 80. | Fishers | 1.03% | 0.58%(+0.453)#80 | 1.46%(-0.423)#6,548 |
| 81. | Meridian Hills | 1.03% | 0.58%(+0.452)#81 | 1.46%(-0.424)#6,558 |
| 82. | Waveland | 1.03% | 0.58%(+0.448)#82 | 1.46%(-0.428)#6,580 |
| 83. | Lowell | 1.03% | 0.58%(+0.446)#83 | 1.46%(-0.430)#6,590 |
| 84. | Everton | 1.02% | 0.58%(+0.435)#84 | 1.46%(-0.441)#6,639 |
| 85. | Greencastle | 1.01% | 0.58%(+0.434)#85 | 1.46%(-0.442)#6,644 |
| 86. | Roseland | 1.01% | 0.58%(+0.428)#86 | 1.46%(-0.448)#6,666 |
| 87. | New Chicago | 0.99% | 0.58%(+0.415)#87 | 1.46%(-0.461)#6,734 |
| 88. | Burlington | 0.95% | 0.58%(+0.368)#88 | 1.46%(-0.508)#6,971 |
| 89. | Wheatfield | 0.94% | 0.58%(+0.358)#89 | 1.46%(-0.518)#7,026 |
| 90. | Redkey | 0.90% | 0.58%(+0.325)#90 | 1.46%(-0.551)#7,215 |
| 91. | Medaryville | 0.90% | 0.58%(+0.317)#91 | 1.46%(-0.558)#7,247 |
| 92. | Griffin | 0.88% | 0.58%(+0.305)#92 | 1.46%(-0.571)#7,313 |
| 93. | Upland | 0.88% | 0.58%(+0.303)#93 | 1.46%(-0.573)#7,321 |
| 94. | Avon | 0.88% | 0.58%(+0.301)#94 | 1.46%(-0.574)#7,330 |
| 95. | Highland | 0.88% | 0.58%(+0.297)#95 | 1.46%(-0.579)#7,355 |
| 96. | South Whitley | 0.86% | 0.58%(+0.284)#96 | 1.46%(-0.592)#7,428 |
| 97. | Whiting | 0.85% | 0.58%(+0.273)#97 | 1.46%(-0.603)#7,487 |
| 98. | New Carlisle | 0.83% | 0.58%(+0.253)#98 | 1.46%(-0.623)#7,598 |
| 99. | Battle Ground | 0.82% | 0.58%(+0.240)#99 | 1.46%(-0.636)#7,657 |
| 100. | South Bend | 0.82% | 0.58%(+0.238)#100 | 1.46%(-0.638)#7,676 |
Common Questions
What are the Top 10 Cities with the Highest Percentage of Immigrants from Europe in Indiana?
Top 10 Cities with the Highest Percentage of Immigrants from Europe in Indiana are:
#1
11.11%
#2
6.16%
#3
4.93%
#4
4.76%
#5
4.35%
#6
3.28%
#7
3.28%
#8
3.23%
#9
2.70%
#10
2.65%
What city has the Highest Percentage of Immigrants from Europe in Indiana?
Spring Hill has the Highest Percentage of Immigrants from Europe in Indiana with 11.11%.
What is the Percentage of Immigrants from Europe in the State of Indiana?
Percentage of Immigrants from Europe in Indiana is 0.58%.
What is the Percentage of Immigrants from Europe in the United States?
Percentage of Immigrants from Europe in the United States is 1.46%.