Cities with the Highest Percentage of Immigrants from Europe in Mississippi
RELATED REPORTS & OPTIONS
Europe
Mississippi
Compare Cities
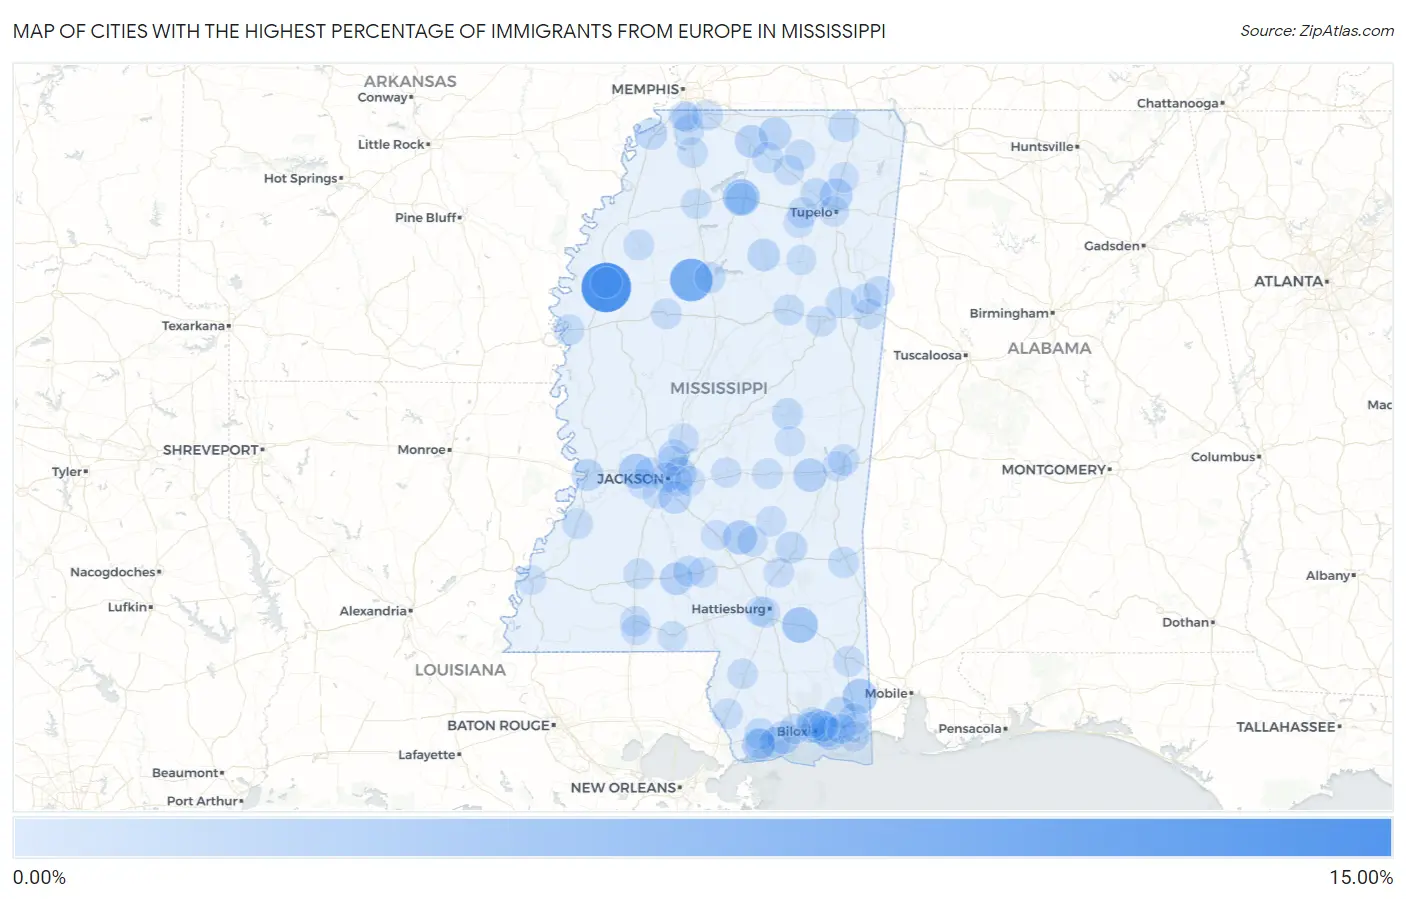
Map of Cities with the Highest Percentage of Immigrants from Europe in Mississippi
0.00%
15.00%
Cities with the Highest Percentage of Immigrants from Europe in Mississippi
| City | Europe | vs State | vs National | |
| 1. | Boyle | 11.14% | 0.25%(+10.9)#1 | 1.46%(+9.69)#165 |
| 2. | Holcomb | 6.99% | 0.25%(+6.74)#2 | 1.46%(+5.54)#474 |
| 3. | University | 3.66% | 0.25%(+3.41)#3 | 1.46%(+2.20)#1,621 |
| 4. | New Augusta | 3.10% | 0.25%(+2.85)#4 | 1.46%(+1.65)#2,088 |
| 5. | Bolton | 2.67% | 0.25%(+2.42)#5 | 1.46%(+1.22)#2,566 |
| 6. | Hurley | 2.52% | 0.25%(+2.27)#6 | 1.46%(+1.06)#2,783 |
| 7. | St Martin | 2.19% | 0.25%(+1.94)#7 | 1.46%(+0.737)#3,267 |
| 8. | Mize | 2.18% | 0.25%(+1.93)#8 | 1.46%(+0.725)#3,293 |
| 9. | Waveland | 1.89% | 0.25%(+1.64)#9 | 1.46%(+0.438)#3,830 |
| 10. | Chunky | 1.87% | 0.25%(+1.62)#10 | 1.46%(+0.417)#3,874 |
| 11. | Long Beach | 1.73% | 0.25%(+1.48)#11 | 1.46%(+0.275)#4,199 |
| 12. | Saltillo | 1.57% | 0.25%(+1.32)#12 | 1.46%(+0.112)#4,615 |
| 13. | Flowood | 1.47% | 0.25%(+1.22)#13 | 1.46%(+0.014)#4,915 |
| 14. | Holly Springs | 1.41% | 0.25%(+1.16)#14 | 1.46%(-0.044)#5,092 |
| 15. | Monticello | 1.41% | 0.25%(+1.16)#15 | 1.46%(-0.046)#5,098 |
| 16. | Gulf Park Estates | 1.41% | 0.25%(+1.16)#16 | 1.46%(-0.049)#5,106 |
| 17. | Snow Lake Shores | 1.37% | 0.25%(+1.12)#17 | 1.46%(-0.082)#5,219 |
| 18. | Florence | 1.35% | 0.25%(+1.10)#18 | 1.46%(-0.107)#5,317 |
| 19. | Pittsboro | 1.29% | 0.25%(+1.04)#19 | 1.46%(-0.168)#5,498 |
| 20. | Vicksburg | 1.13% | 0.25%(+0.884)#20 | 1.46%(-0.322)#6,106 |
| 21. | Tunica Resorts | 0.95% | 0.25%(+0.704)#21 | 1.46%(-0.502)#6,931 |
| 22. | Sharon | 0.94% | 0.25%(+0.688)#22 | 1.46%(-0.518)#7,028 |
| 23. | Vancleave | 0.85% | 0.25%(+0.595)#23 | 1.46%(-0.611)#7,532 |
| 24. | Ocean Springs | 0.81% | 0.25%(+0.559)#24 | 1.46%(-0.647)#7,717 |
| 25. | Diamondhead | 0.74% | 0.25%(+0.487)#25 | 1.46%(-0.719)#8,146 |
| 26. | Blue Springs | 0.72% | 0.25%(+0.472)#26 | 1.46%(-0.734)#8,263 |
| 27. | Oxford | 0.71% | 0.25%(+0.458)#27 | 1.46%(-0.748)#8,355 |
| 28. | Kossuth | 0.69% | 0.25%(+0.445)#28 | 1.46%(-0.761)#8,431 |
| 29. | Philadelphia | 0.67% | 0.25%(+0.415)#29 | 1.46%(-0.791)#8,637 |
| 30. | Madison | 0.66% | 0.25%(+0.413)#30 | 1.46%(-0.793)#8,651 |
| 31. | Potts Camp | 0.65% | 0.25%(+0.395)#31 | 1.46%(-0.811)#8,787 |
| 32. | Greenville | 0.63% | 0.25%(+0.384)#32 | 1.46%(-0.822)#8,871 |
| 33. | Escatawpa | 0.62% | 0.25%(+0.368)#33 | 1.46%(-0.838)#9,003 |
| 34. | Waynesboro | 0.59% | 0.25%(+0.340)#34 | 1.46%(-0.866)#9,219 |
| 35. | Pass Christian | 0.59% | 0.25%(+0.336)#35 | 1.46%(-0.870)#9,250 |
| 36. | Marion | 0.58% | 0.25%(+0.326)#36 | 1.46%(-0.880)#9,341 |
| 37. | Biloxi | 0.57% | 0.25%(+0.324)#37 | 1.46%(-0.882)#9,352 |
| 38. | Grenada | 0.54% | 0.25%(+0.290)#38 | 1.46%(-0.916)#9,654 |
| 39. | D Iberville | 0.52% | 0.25%(+0.269)#39 | 1.46%(-0.937)#9,839 |
| 40. | West Point | 0.52% | 0.25%(+0.267)#40 | 1.46%(-0.939)#9,856 |
| 41. | Mathiston | 0.50% | 0.25%(+0.246)#41 | 1.46%(-0.960)#10,050 |
| 42. | Silver Creek | 0.48% | 0.25%(+0.229)#42 | 1.46%(-0.977)#10,206 |
| 43. | Cleveland | 0.48% | 0.25%(+0.228)#43 | 1.46%(-0.978)#10,207 |
| 44. | Lucedale | 0.45% | 0.25%(+0.196)#44 | 1.46%(-1.01)#10,492 |
| 45. | Port Gibson | 0.43% | 0.25%(+0.179)#45 | 1.46%(-1.03)#10,632 |
| 46. | Gulf Hills | 0.43% | 0.25%(+0.178)#46 | 1.46%(-1.03)#10,651 |
| 47. | Hattiesburg | 0.42% | 0.25%(+0.173)#47 | 1.46%(-1.03)#10,707 |
| 48. | Ridgeland | 0.42% | 0.25%(+0.173)#48 | 1.46%(-1.03)#10,714 |
| 49. | Hernando | 0.39% | 0.25%(+0.144)#49 | 1.46%(-1.06)#10,977 |
| 50. | Lake | 0.39% | 0.25%(+0.141)#50 | 1.46%(-1.07)#11,009 |
| 51. | Olive Branch | 0.39% | 0.25%(+0.138)#51 | 1.46%(-1.07)#11,044 |
| 52. | Starkville | 0.38% | 0.25%(+0.133)#52 | 1.46%(-1.07)#11,090 |
| 53. | Brookhaven | 0.37% | 0.25%(+0.117)#53 | 1.46%(-1.09)#11,259 |
| 54. | Taylorsville | 0.37% | 0.25%(+0.116)#54 | 1.46%(-1.09)#11,274 |
| 55. | Blue Mountain | 0.36% | 0.25%(+0.114)#55 | 1.46%(-1.09)#11,304 |
| 56. | Batesville | 0.36% | 0.25%(+0.112)#56 | 1.46%(-1.09)#11,332 |
| 57. | Columbus Afb | 0.35% | 0.25%(+0.100)#57 | 1.46%(-1.11)#11,467 |
| 58. | Greenwood | 0.34% | 0.25%(+0.087)#58 | 1.46%(-1.12)#11,589 |
| 59. | Caledonia | 0.33% | 0.25%(+0.085)#59 | 1.46%(-1.12)#11,617 |
| 60. | Columbus | 0.33% | 0.25%(+0.081)#60 | 1.46%(-1.13)#11,659 |
| 61. | Coldwater | 0.32% | 0.25%(+0.073)#61 | 1.46%(-1.13)#11,735 |
| 62. | Picayune | 0.32% | 0.25%(+0.072)#62 | 1.46%(-1.13)#11,751 |
| 63. | Mccomb | 0.31% | 0.25%(+0.059)#63 | 1.46%(-1.15)#11,877 |
| 64. | Pontotoc | 0.30% | 0.25%(+0.050)#64 | 1.46%(-1.16)#11,983 |
| 65. | Poplarville | 0.28% | 0.25%(+0.034)#65 | 1.46%(-1.17)#12,151 |
| 66. | Myrtle | 0.28% | 0.25%(+0.033)#66 | 1.46%(-1.17)#12,163 |
| 67. | Tutwiler | 0.28% | 0.25%(+0.029)#67 | 1.46%(-1.18)#12,209 |
| 68. | Pascagoula | 0.28% | 0.25%(+0.029)#68 | 1.46%(-1.18)#12,215 |
| 69. | Gulfport | 0.28% | 0.25%(+0.026)#69 | 1.46%(-1.18)#12,241 |
| 70. | Southaven | 0.26% | 0.25%(+0.011)#70 | 1.46%(-1.20)#12,420 |
| 71. | Raymond | 0.25% | 0.25%(+0.003)#71 | 1.46%(-1.20)#12,510 |
| 72. | Tupelo | 0.24% | 0.25%(-0.007)#72 | 1.46%(-1.21)#12,653 |
| 73. | Algoma | 0.24% | 0.25%(-0.010)#73 | 1.46%(-1.22)#12,687 |
| 74. | Ellisville | 0.24% | 0.25%(-0.012)#74 | 1.46%(-1.22)#12,703 |
| 75. | Moss Point | 0.23% | 0.25%(-0.020)#75 | 1.46%(-1.23)#12,796 |
| 76. | Baldwyn | 0.22% | 0.25%(-0.030)#76 | 1.46%(-1.24)#12,910 |
| 77. | Magnolia | 0.22% | 0.25%(-0.034)#77 | 1.46%(-1.24)#12,950 |
| 78. | Bay St Louis | 0.21% | 0.25%(-0.035)#78 | 1.46%(-1.24)#12,967 |
| 79. | Clinton | 0.20% | 0.25%(-0.055)#79 | 1.46%(-1.26)#13,213 |
| 80. | Gautier | 0.18% | 0.25%(-0.071)#80 | 1.46%(-1.28)#13,392 |
| 81. | Magee | 0.18% | 0.25%(-0.074)#81 | 1.46%(-1.28)#13,419 |
| 82. | Canton | 0.17% | 0.25%(-0.076)#82 | 1.46%(-1.28)#13,440 |
| 83. | Pearl | 0.17% | 0.25%(-0.077)#83 | 1.46%(-1.28)#13,452 |
| 84. | Bay Springs | 0.17% | 0.25%(-0.082)#84 | 1.46%(-1.29)#13,488 |
| 85. | Horn Lake | 0.16% | 0.25%(-0.089)#85 | 1.46%(-1.29)#13,542 |
| 86. | Meridian | 0.15% | 0.25%(-0.098)#86 | 1.46%(-1.30)#13,635 |
| 87. | Jackson | 0.14% | 0.25%(-0.105)#87 | 1.46%(-1.31)#13,697 |
| 88. | Morton | 0.14% | 0.25%(-0.114)#88 | 1.46%(-1.32)#13,786 |
| 89. | Tylertown | 0.13% | 0.25%(-0.122)#89 | 1.46%(-1.33)#13,858 |
| 90. | Houston | 0.11% | 0.25%(-0.144)#90 | 1.46%(-1.35)#14,030 |
| 91. | Prentiss | 0.10% | 0.25%(-0.148)#91 | 1.46%(-1.35)#14,073 |
| 92. | Byram | 0.077% | 0.25%(-0.173)#92 | 1.46%(-1.38)#14,216 |
| 93. | Natchez | 0.056% | 0.25%(-0.194)#93 | 1.46%(-1.40)#14,326 |
| 94. | West Hattiesburg | 0.048% | 0.25%(-0.202)#94 | 1.46%(-1.41)#14,352 |
| 95. | Union | 0.036% | 0.25%(-0.214)#95 | 1.46%(-1.42)#14,394 |
| 96. | Brandon | 0.028% | 0.25%(-0.222)#96 | 1.46%(-1.43)#14,421 |
Common Questions
What are the Top 10 Cities with the Highest Percentage of Immigrants from Europe in Mississippi?
Top 10 Cities with the Highest Percentage of Immigrants from Europe in Mississippi are:
#1
11.14%
#2
6.99%
#3
3.66%
#4
3.10%
#5
2.67%
#6
2.52%
#7
2.19%
#8
2.18%
#9
1.89%
#10
1.87%
What city has the Highest Percentage of Immigrants from Europe in Mississippi?
Boyle has the Highest Percentage of Immigrants from Europe in Mississippi with 11.14%.
What is the Percentage of Immigrants from Europe in the State of Mississippi?
Percentage of Immigrants from Europe in Mississippi is 0.25%.
What is the Percentage of Immigrants from Europe in the United States?
Percentage of Immigrants from Europe in the United States is 1.46%.