Cities with the Highest Percentage of Immigrants from Europe in Utah
RELATED REPORTS & OPTIONS
Europe
Utah
Compare Cities
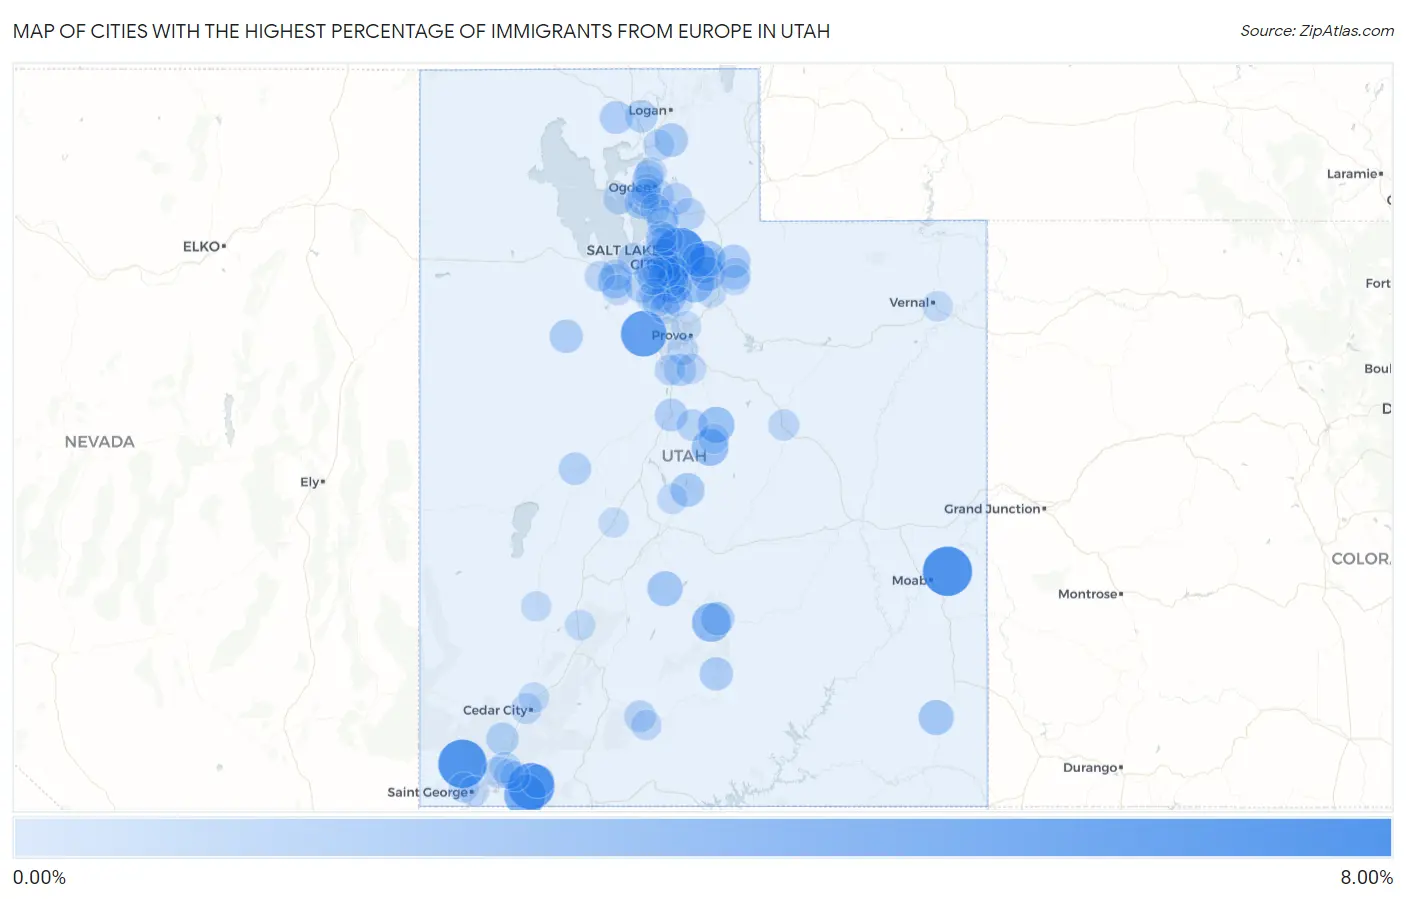
Map of Cities with the Highest Percentage of Immigrants from Europe in Utah
0.00%
8.00%
Cities with the Highest Percentage of Immigrants from Europe in Utah
| City | Europe | vs State | vs National | |
| 1. | Emigration Canyon | 7.92% | 0.80%(+7.11)#1 | 1.46%(+6.46)#368 |
| 2. | Castle Valley | 7.82% | 0.80%(+7.02)#2 | 1.46%(+6.37)#373 |
| 3. | Dammeron Valley | 7.47% | 0.80%(+6.66)#3 | 1.46%(+6.01)#418 |
| 4. | Rockville | 6.67% | 0.80%(+5.86)#4 | 1.46%(+5.21)#526 |
| 5. | Fairfield | 6.41% | 0.80%(+5.61)#5 | 1.46%(+4.95)#587 |
| 6. | Apple Valley | 4.95% | 0.80%(+4.14)#6 | 1.46%(+3.49)#986 |
| 7. | Teasdale | 3.69% | 0.80%(+2.88)#7 | 1.46%(+2.23)#1,604 |
| 8. | Alta | 3.19% | 0.80%(+2.39)#8 | 1.46%(+1.74)#2,006 |
| 9. | Granite | 2.99% | 0.80%(+2.18)#9 | 1.46%(+1.53)#2,203 |
| 10. | Spring City | 2.98% | 0.80%(+2.17)#10 | 1.46%(+1.52)#2,215 |
| 11. | Snyderville | 2.88% | 0.80%(+2.07)#11 | 1.46%(+1.42)#2,315 |
| 12. | Fairview | 2.87% | 0.80%(+2.07)#12 | 1.46%(+1.42)#2,327 |
| 13. | Silver Summit | 2.64% | 0.80%(+1.84)#13 | 1.46%(+1.19)#2,608 |
| 14. | Blanding | 2.39% | 0.80%(+1.59)#14 | 1.46%(+0.936)#2,952 |
| 15. | Koosharem | 2.39% | 0.80%(+1.59)#15 | 1.46%(+0.935)#2,953 |
| 16. | Hobble Creek | 2.21% | 0.80%(+1.41)#16 | 1.46%(+0.757)#3,233 |
| 17. | East Basin | 2.17% | 0.80%(+1.36)#17 | 1.46%(+0.711)#3,316 |
| 18. | Draper | 2.16% | 0.80%(+1.35)#18 | 1.46%(+0.703)#3,330 |
| 19. | Park City | 2.14% | 0.80%(+1.33)#19 | 1.46%(+0.680)#3,351 |
| 20. | Erda | 2.08% | 0.80%(+1.28)#20 | 1.46%(+0.625)#3,455 |
| 21. | Summit Park | 2.02% | 0.80%(+1.22)#21 | 1.46%(+0.565)#3,560 |
| 22. | Sterling | 1.97% | 0.80%(+1.17)#22 | 1.46%(+0.516)#3,669 |
| 23. | White | 1.96% | 0.80%(+1.15)#23 | 1.46%(+0.504)#3,707 |
| 24. | Avon | 1.86% | 0.80%(+1.05)#24 | 1.46%(+0.399)#3,907 |
| 25. | Sandy | 1.83% | 0.80%(+1.03)#25 | 1.46%(+0.377)#3,967 |
| 26. | Torrey | 1.83% | 0.80%(+1.02)#26 | 1.46%(+0.371)#3,979 |
| 27. | Salt Lake City | 1.80% | 0.80%(+0.990)#27 | 1.46%(+0.339)#4,042 |
| 28. | Dugway | 1.78% | 0.80%(+0.972)#28 | 1.46%(+0.321)#4,083 |
| 29. | Springdale | 1.76% | 0.80%(+0.957)#29 | 1.46%(+0.306)#4,130 |
| 30. | Oakley | 1.72% | 0.80%(+0.915)#30 | 1.46%(+0.264)#4,218 |
| 31. | Boulder | 1.70% | 0.80%(+0.900)#31 | 1.46%(+0.249)#4,256 |
| 32. | West Point | 1.66% | 0.80%(+0.852)#32 | 1.46%(+0.201)#4,365 |
| 33. | Midvale | 1.65% | 0.80%(+0.844)#33 | 1.46%(+0.193)#4,385 |
| 34. | Thatcher | 1.61% | 0.80%(+0.805)#34 | 1.46%(+0.154)#4,482 |
| 35. | Nephi | 1.55% | 0.80%(+0.747)#35 | 1.46%(+0.096)#4,652 |
| 36. | Millcreek | 1.53% | 0.80%(+0.729)#36 | 1.46%(+0.078)#4,706 |
| 37. | Holladay | 1.51% | 0.80%(+0.703)#37 | 1.46%(+0.052)#4,789 |
| 38. | Fruit Heights | 1.46% | 0.80%(+0.658)#38 | 1.46%(+0.006)#4,936 |
| 39. | South Salt Lake | 1.46% | 0.80%(+0.655)#39 | 1.46%(+0.003)#4,950 |
| 40. | New Harmony | 1.40% | 0.80%(+0.600)#40 | 1.46%(-0.051)#5,118 |
| 41. | Hinckley | 1.39% | 0.80%(+0.588)#41 | 1.46%(-0.063)#5,158 |
| 42. | Deweyville | 1.39% | 0.80%(+0.584)#42 | 1.46%(-0.067)#5,172 |
| 43. | Copperton | 1.38% | 0.80%(+0.572)#43 | 1.46%(-0.079)#5,210 |
| 44. | Cottonwood Heights | 1.37% | 0.80%(+0.569)#44 | 1.46%(-0.082)#5,216 |
| 45. | Spring Lake | 1.35% | 0.80%(+0.549)#45 | 1.46%(-0.102)#5,290 |
| 46. | South Ogden | 1.34% | 0.80%(+0.540)#46 | 1.46%(-0.111)#5,330 |
| 47. | Murray | 1.30% | 0.80%(+0.492)#47 | 1.46%(-0.159)#5,464 |
| 48. | Mountain Green | 1.23% | 0.80%(+0.429)#48 | 1.46%(-0.222)#5,711 |
| 49. | Clinton | 1.18% | 0.80%(+0.375)#49 | 1.46%(-0.276)#5,902 |
| 50. | Kamas | 1.16% | 0.80%(+0.357)#50 | 1.46%(-0.295)#5,987 |
| 51. | Morgan | 1.15% | 0.80%(+0.346)#51 | 1.46%(-0.306)#6,032 |
| 52. | Magna | 1.15% | 0.80%(+0.343)#52 | 1.46%(-0.308)#6,048 |
| 53. | Tropic | 1.15% | 0.80%(+0.340)#53 | 1.46%(-0.311)#6,059 |
| 54. | Bountiful | 1.13% | 0.80%(+0.329)#54 | 1.46%(-0.323)#6,110 |
| 55. | Leeds | 1.13% | 0.80%(+0.323)#55 | 1.46%(-0.328)#6,135 |
| 56. | Fountain Green | 1.12% | 0.80%(+0.320)#56 | 1.46%(-0.331)#6,150 |
| 57. | Kearns | 1.09% | 0.80%(+0.280)#57 | 1.46%(-0.371)#6,309 |
| 58. | Farmington | 1.06% | 0.80%(+0.254)#58 | 1.46%(-0.397)#6,431 |
| 59. | North Salt Lake | 1.04% | 0.80%(+0.238)#59 | 1.46%(-0.414)#6,505 |
| 60. | Marriott Slaterville | 1.03% | 0.80%(+0.224)#60 | 1.46%(-0.427)#6,574 |
| 61. | Toquerville | 0.98% | 0.80%(+0.179)#61 | 1.46%(-0.473)#6,793 |
| 62. | Stansbury Park | 0.97% | 0.80%(+0.166)#62 | 1.46%(-0.486)#6,852 |
| 63. | Carbonville | 0.95% | 0.80%(+0.147)#63 | 1.46%(-0.504)#6,950 |
| 64. | Hooper | 0.95% | 0.80%(+0.142)#64 | 1.46%(-0.509)#6,973 |
| 65. | Mantua | 0.89% | 0.80%(+0.085)#65 | 1.46%(-0.566)#7,286 |
| 66. | Pleasant View | 0.83% | 0.80%(+0.027)#66 | 1.46%(-0.624)#7,601 |
| 67. | West Valley City | 0.83% | 0.80%(+0.026)#67 | 1.46%(-0.626)#7,608 |
| 68. | Lake Shore | 0.81% | 0.80%(+0.005)#68 | 1.46%(-0.646)#7,714 |
| 69. | West Bountiful | 0.80% | 0.80%(-0.009)#69 | 1.46%(-0.660)#7,795 |
| 70. | Genola | 0.79% | 0.80%(-0.016)#70 | 1.46%(-0.667)#7,852 |
| 71. | Riverton | 0.76% | 0.80%(-0.047)#71 | 1.46%(-0.698)#8,019 |
| 72. | Cannonville | 0.75% | 0.80%(-0.050)#72 | 1.46%(-0.701)#8,037 |
| 73. | Bluffdale | 0.75% | 0.80%(-0.054)#73 | 1.46%(-0.706)#8,061 |
| 74. | Cedar City | 0.74% | 0.80%(-0.068)#74 | 1.46%(-0.719)#8,145 |
| 75. | Grantsville | 0.73% | 0.80%(-0.071)#75 | 1.46%(-0.722)#8,172 |
| 76. | Alpine | 0.72% | 0.80%(-0.083)#76 | 1.46%(-0.735)#8,270 |
| 77. | Naples | 0.71% | 0.80%(-0.091)#77 | 1.46%(-0.742)#8,312 |
| 78. | Tooele | 0.70% | 0.80%(-0.108)#78 | 1.46%(-0.759)#8,421 |
| 79. | Enoch | 0.69% | 0.80%(-0.117)#79 | 1.46%(-0.768)#8,476 |
| 80. | Santa Clara | 0.68% | 0.80%(-0.123)#80 | 1.46%(-0.774)#8,511 |
| 81. | Mount Pleasant | 0.68% | 0.80%(-0.125)#81 | 1.46%(-0.776)#8,533 |
| 82. | West Haven | 0.67% | 0.80%(-0.134)#82 | 1.46%(-0.785)#8,608 |
| 83. | Centerfield | 0.67% | 0.80%(-0.140)#83 | 1.46%(-0.791)#8,638 |
| 84. | Midway | 0.65% | 0.80%(-0.157)#84 | 1.46%(-0.808)#8,768 |
| 85. | Herriman | 0.65% | 0.80%(-0.159)#85 | 1.46%(-0.810)#8,782 |
| 86. | Beaver | 0.64% | 0.80%(-0.164)#86 | 1.46%(-0.815)#8,819 |
| 87. | Taylorsville | 0.64% | 0.80%(-0.167)#87 | 1.46%(-0.818)#8,843 |
| 88. | Francis | 0.64% | 0.80%(-0.169)#88 | 1.46%(-0.820)#8,860 |
| 89. | St George | 0.63% | 0.80%(-0.172)#89 | 1.46%(-0.823)#8,876 |
| 90. | Milford | 0.62% | 0.80%(-0.189)#90 | 1.46%(-0.840)#9,021 |
| 91. | Lehi | 0.61% | 0.80%(-0.198)#91 | 1.46%(-0.849)#9,098 |
| 92. | Farr West | 0.61% | 0.80%(-0.198)#92 | 1.46%(-0.849)#9,102 |
| 93. | Roy | 0.60% | 0.80%(-0.201)#93 | 1.46%(-0.852)#9,132 |
| 94. | Woodland Hills | 0.60% | 0.80%(-0.203)#94 | 1.46%(-0.854)#9,143 |
| 95. | La Verkin | 0.60% | 0.80%(-0.208)#95 | 1.46%(-0.860)#9,179 |
| 96. | Layton | 0.59% | 0.80%(-0.217)#96 | 1.46%(-0.869)#9,239 |
| 97. | Orem | 0.58% | 0.80%(-0.221)#97 | 1.46%(-0.872)#9,271 |
| 98. | Fillmore | 0.58% | 0.80%(-0.222)#98 | 1.46%(-0.873)#9,278 |
| 99. | West Jordan | 0.58% | 0.80%(-0.225)#99 | 1.46%(-0.876)#9,304 |
| 100. | Virgin | 0.58% | 0.80%(-0.225)#100 | 1.46%(-0.876)#9,306 |
Common Questions
What are the Top 10 Cities with the Highest Percentage of Immigrants from Europe in Utah?
Top 10 Cities with the Highest Percentage of Immigrants from Europe in Utah are:
#1
7.92%
#2
7.82%
#3
7.47%
#4
6.67%
#5
6.41%
#6
4.95%
#7
3.69%
#8
3.19%
#9
2.99%
#10
2.98%
What city has the Highest Percentage of Immigrants from Europe in Utah?
Emigration Canyon has the Highest Percentage of Immigrants from Europe in Utah with 7.92%.
What is the Percentage of Immigrants from Europe in the State of Utah?
Percentage of Immigrants from Europe in Utah is 0.80%.
What is the Percentage of Immigrants from Europe in the United States?
Percentage of Immigrants from Europe in the United States is 1.46%.