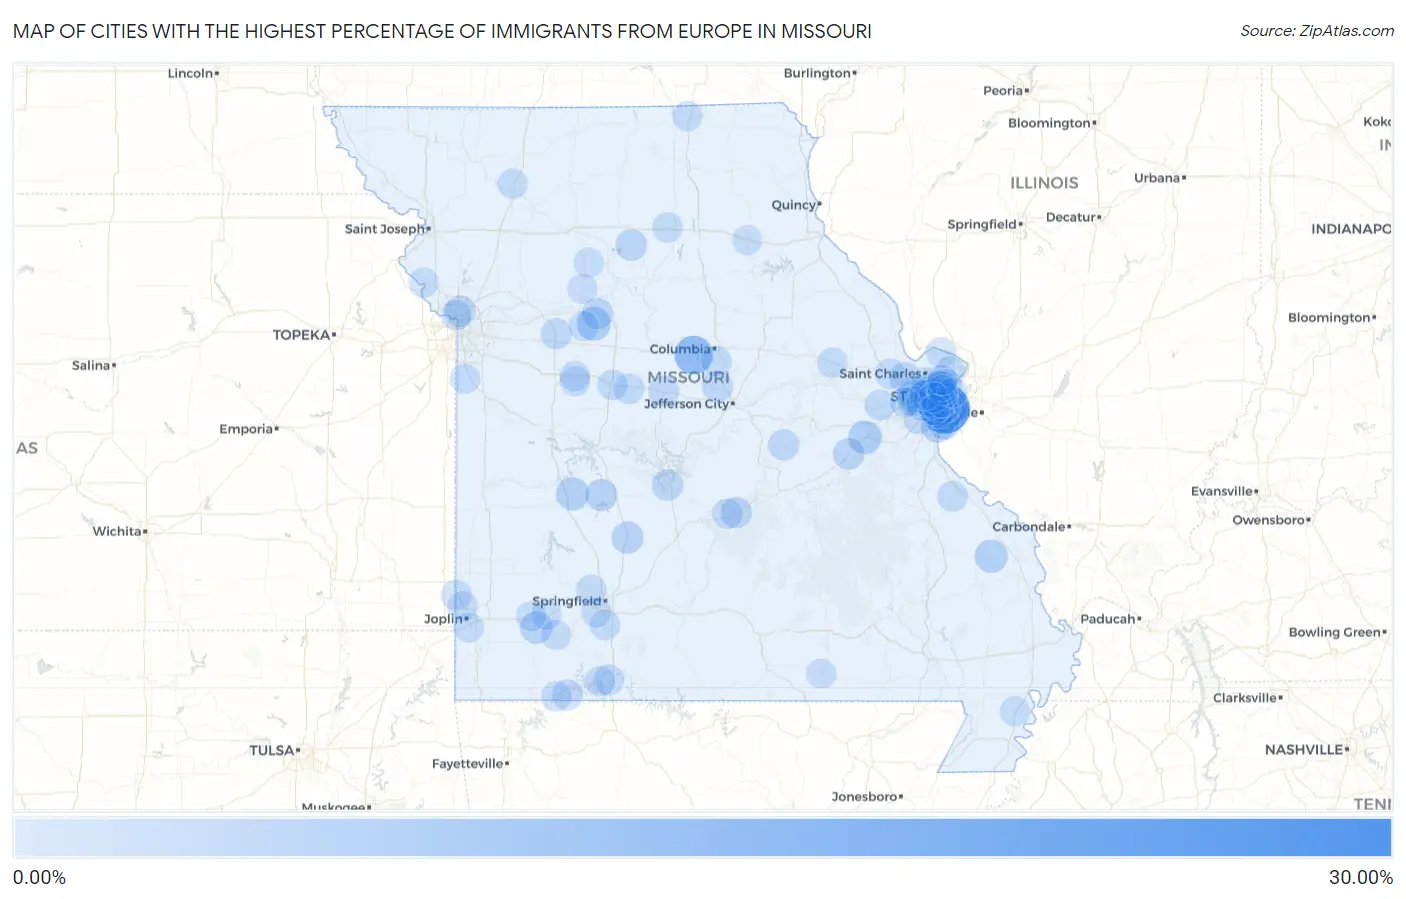
Cities with the Highest Percentage of Immigrants from Europe in Missouri
RELATED REPORTS & OPTIONS
Europe
Missouri
Compare Cities
Map of Cities with the Highest Percentage of Immigrants from Europe in Missouri
0.00%
30.00%
Cities with the Highest Percentage of Immigrants from Europe in Missouri
| City | Europe | vs State | vs National | |
| 1. | St George | 26.61% | 0.74%(+25.9)#1 | 1.46%(+25.2)#27 |
| 2. | Bella Villa | 14.53% | 0.74%(+13.8)#2 | 1.46%(+13.1)#85 |
| 3. | Country Life Acres | 11.83% | 0.74%(+11.1)#3 | 1.46%(+10.4)#146 |
| 4. | Wooldridge | 11.54% | 0.74%(+10.8)#4 | 1.46%(+10.1)#154 |
| 5. | Mehlville | 8.72% | 0.74%(+7.99)#5 | 1.46%(+7.27)#291 |
| 6. | Lemay | 7.22% | 0.74%(+6.48)#6 | 1.46%(+5.76)#447 |
| 7. | Connelsville | 6.82% | 0.74%(+6.08)#7 | 1.46%(+5.36)#502 |
| 8. | Green Park | 6.73% | 0.74%(+6.00)#8 | 1.46%(+5.28)#513 |
| 9. | Affton | 5.84% | 0.74%(+5.11)#9 | 1.46%(+4.39)#714 |
| 10. | Mount Leonard | 5.66% | 0.74%(+4.93)#10 | 1.46%(+4.20)#763 |
| 11. | St Clair | 5.45% | 0.74%(+4.71)#11 | 1.46%(+3.99)#828 |
| 12. | Gerster | 5.00% | 0.74%(+4.26)#12 | 1.46%(+3.54)#967 |
| 13. | Lakeshire | 4.99% | 0.74%(+4.26)#13 | 1.46%(+3.54)#972 |
| 14. | Sedgewickville | 4.97% | 0.74%(+4.23)#14 | 1.46%(+3.51)#978 |
| 15. | Arnold | 4.37% | 0.74%(+3.63)#15 | 1.46%(+2.91)#1,247 |
| 16. | Freistatt | 3.92% | 0.74%(+3.19)#16 | 1.46%(+2.47)#1,459 |
| 17. | Crystal Lake Park | 3.91% | 0.74%(+3.18)#17 | 1.46%(+2.46)#1,463 |
| 18. | Wilbur Park | 3.75% | 0.74%(+3.02)#18 | 1.46%(+2.30)#1,565 |
| 19. | Chesterfield | 3.66% | 0.74%(+2.93)#19 | 1.46%(+2.21)#1,617 |
| 20. | Hermitage | 3.65% | 0.74%(+2.92)#20 | 1.46%(+2.20)#1,626 |
| 21. | Buffalo | 3.53% | 0.74%(+2.79)#21 | 1.46%(+2.07)#1,733 |
| 22. | Concord | 3.35% | 0.74%(+2.61)#22 | 1.46%(+1.89)#1,878 |
| 23. | Sappington | 3.31% | 0.74%(+2.57)#23 | 1.46%(+1.85)#1,906 |
| 24. | Twin Oaks | 3.23% | 0.74%(+2.50)#24 | 1.46%(+1.78)#1,976 |
| 25. | Creve Coeur | 3.04% | 0.74%(+2.31)#25 | 1.46%(+1.58)#2,148 |
| 26. | Oakville | 3.03% | 0.74%(+2.30)#26 | 1.46%(+1.58)#2,158 |
| 27. | Oak Grove Village | 2.98% | 0.74%(+2.25)#27 | 1.46%(+1.53)#2,211 |
| 28. | Rothville | 2.86% | 0.74%(+2.12)#28 | 1.46%(+1.40)#2,342 |
| 29. | Camdenton | 2.81% | 0.74%(+2.08)#29 | 1.46%(+1.36)#2,394 |
| 30. | Clarkson Valley | 2.68% | 0.74%(+1.95)#30 | 1.46%(+1.23)#2,549 |
| 31. | Oakview | 2.59% | 0.74%(+1.86)#31 | 1.46%(+1.13)#2,682 |
| 32. | Malta Bend | 2.58% | 0.74%(+1.85)#32 | 1.46%(+1.12)#2,699 |
| 33. | St Robert | 2.50% | 0.74%(+1.76)#33 | 1.46%(+1.04)#2,809 |
| 34. | Lake Timberline | 2.35% | 0.74%(+1.61)#34 | 1.46%(+0.892)#3,019 |
| 35. | Glen Echo Park | 2.33% | 0.74%(+1.59)#35 | 1.46%(+0.870)#3,056 |
| 36. | Hartsburg | 2.31% | 0.74%(+1.57)#36 | 1.46%(+0.852)#3,083 |
| 37. | Tipton | 2.26% | 0.74%(+1.53)#37 | 1.46%(+0.809)#3,141 |
| 38. | Higginsville | 2.24% | 0.74%(+1.51)#38 | 1.46%(+0.785)#3,182 |
| 39. | Belle | 2.08% | 0.74%(+1.35)#39 | 1.46%(+0.626)#3,454 |
| 40. | Clayton | 2.06% | 0.74%(+1.33)#40 | 1.46%(+0.607)#3,483 |
| 41. | Brentwood | 2.01% | 0.74%(+1.27)#41 | 1.46%(+0.551)#3,596 |
| 42. | Cottleville | 2.01% | 0.74%(+1.27)#42 | 1.46%(+0.550)#3,600 |
| 43. | Charlack | 1.97% | 0.74%(+1.23)#43 | 1.46%(+0.510)#3,686 |
| 44. | Arrow Point | 1.96% | 0.74%(+1.23)#44 | 1.46%(+0.505)#3,704 |
| 45. | Smithton | 1.95% | 0.74%(+1.21)#45 | 1.46%(+0.490)#3,738 |
| 46. | Westwood | 1.94% | 0.74%(+1.21)#46 | 1.46%(+0.486)#3,743 |
| 47. | Grayhawk | 1.85% | 0.74%(+1.11)#47 | 1.46%(+0.392)#3,924 |
| 48. | Webster Groves | 1.85% | 0.74%(+1.11)#48 | 1.46%(+0.390)#3,933 |
| 49. | Branson | 1.77% | 0.74%(+1.04)#49 | 1.46%(+0.315)#4,108 |
| 50. | Augusta | 1.72% | 0.74%(+0.989)#50 | 1.46%(+0.268)#4,206 |
| 51. | Willard | 1.72% | 0.74%(+0.983)#51 | 1.46%(+0.263)#4,222 |
| 52. | Overland | 1.70% | 0.74%(+0.969)#52 | 1.46%(+0.249)#4,254 |
| 53. | Sedalia | 1.63% | 0.74%(+0.891)#53 | 1.46%(+0.170)#4,437 |
| 54. | Waco | 1.62% | 0.74%(+0.886)#54 | 1.46%(+0.166)#4,452 |
| 55. | Pierpont | 1.59% | 0.74%(+0.852)#55 | 1.46%(+0.131)#4,566 |
| 56. | Kirkwood | 1.58% | 0.74%(+0.848)#56 | 1.46%(+0.127)#4,578 |
| 57. | Nixa | 1.58% | 0.74%(+0.846)#57 | 1.46%(+0.126)#4,584 |
| 58. | Peaceful Village | 1.57% | 0.74%(+0.839)#58 | 1.46%(+0.119)#4,606 |
| 59. | New Cambria | 1.56% | 0.74%(+0.827)#59 | 1.46%(+0.107)#4,628 |
| 60. | Des Peres | 1.53% | 0.74%(+0.796)#60 | 1.46%(+0.076)#4,712 |
| 61. | Lake St Louis | 1.53% | 0.74%(+0.792)#61 | 1.46%(+0.072)#4,730 |
| 62. | Portage Des Sioux | 1.52% | 0.74%(+0.780)#62 | 1.46%(+0.059)#4,774 |
| 63. | Richmond Heights | 1.49% | 0.74%(+0.756)#63 | 1.46%(+0.036)#4,846 |
| 64. | Oakland | 1.47% | 0.74%(+0.734)#64 | 1.46%(+0.014)#4,917 |
| 65. | Blackburn | 1.46% | 0.74%(+0.728)#65 | 1.46%(+0.008)#4,933 |
| 66. | Waynesville | 1.45% | 0.74%(+0.717)#66 | 1.46%(-0.004)#4,980 |
| 67. | Pattonsburg | 1.45% | 0.74%(+0.714)#67 | 1.46%(-0.007)#4,987 |
| 68. | Maryland Heights | 1.44% | 0.74%(+0.702)#68 | 1.46%(-0.018)#5,022 |
| 69. | Crestwood | 1.37% | 0.74%(+0.637)#69 | 1.46%(-0.084)#5,226 |
| 70. | Shrewsbury | 1.35% | 0.74%(+0.619)#70 | 1.46%(-0.102)#5,291 |
| 71. | Chain O Lakes | 1.35% | 0.74%(+0.616)#71 | 1.46%(-0.104)#5,307 |
| 72. | Northmoor | 1.32% | 0.74%(+0.584)#72 | 1.46%(-0.137)#5,395 |
| 73. | Ellisville | 1.31% | 0.74%(+0.576)#73 | 1.46%(-0.145)#5,422 |
| 74. | Town And Country | 1.30% | 0.74%(+0.561)#74 | 1.46%(-0.160)#5,466 |
| 75. | Jonesburg | 1.29% | 0.74%(+0.552)#75 | 1.46%(-0.168)#5,497 |
| 76. | Black Jack | 1.27% | 0.74%(+0.531)#76 | 1.46%(-0.189)#5,590 |
| 77. | Whiteman Afb | 1.26% | 0.74%(+0.527)#77 | 1.46%(-0.193)#5,601 |
| 78. | Aurora | 1.26% | 0.74%(+0.527)#78 | 1.46%(-0.194)#5,606 |
| 79. | Carl Junction | 1.26% | 0.74%(+0.521)#79 | 1.46%(-0.199)#5,628 |
| 80. | Knob Noster | 1.25% | 0.74%(+0.518)#80 | 1.46%(-0.203)#5,643 |
| 81. | Wildwood | 1.22% | 0.74%(+0.481)#81 | 1.46%(-0.240)#5,770 |
| 82. | Weston | 1.20% | 0.74%(+0.469)#82 | 1.46%(-0.251)#5,814 |
| 83. | Vinita Park | 1.18% | 0.74%(+0.449)#83 | 1.46%(-0.271)#5,881 |
| 84. | St Louis | 1.18% | 0.74%(+0.441)#84 | 1.46%(-0.280)#5,923 |
| 85. | Portageville | 1.17% | 0.74%(+0.430)#85 | 1.46%(-0.291)#5,968 |
| 86. | Huntleigh | 1.16% | 0.74%(+0.427)#86 | 1.46%(-0.293)#5,980 |
| 87. | University City | 1.16% | 0.74%(+0.424)#87 | 1.46%(-0.297)#5,994 |
| 88. | Mount Vernon | 1.15% | 0.74%(+0.417)#88 | 1.46%(-0.303)#6,021 |
| 89. | Sunset Hills | 1.14% | 0.74%(+0.405)#89 | 1.46%(-0.316)#6,080 |
| 90. | Shoal Creek Estates | 1.13% | 0.74%(+0.395)#90 | 1.46%(-0.326)#6,125 |
| 91. | Glenwood | 1.12% | 0.74%(+0.388)#91 | 1.46%(-0.332)#6,158 |
| 92. | Riverview Estates | 1.12% | 0.74%(+0.388)#92 | 1.46%(-0.332)#6,160 |
| 93. | Indian Point | 1.12% | 0.74%(+0.383)#93 | 1.46%(-0.337)#6,182 |
| 94. | Tina | 1.10% | 0.74%(+0.364)#94 | 1.46%(-0.357)#6,253 |
| 95. | Battlefield | 1.08% | 0.74%(+0.340)#95 | 1.46%(-0.381)#6,357 |
| 96. | Carrollton | 1.07% | 0.74%(+0.336)#96 | 1.46%(-0.385)#6,375 |
| 97. | Alton | 1.05% | 0.74%(+0.316)#97 | 1.46%(-0.405)#6,469 |
| 98. | Kinloch | 1.03% | 0.74%(+0.296)#98 | 1.46%(-0.425)#6,563 |
| 99. | Stotts City | 1.02% | 0.74%(+0.285)#99 | 1.46%(-0.435)#6,614 |
| 100. | Shelbina | 1.02% | 0.74%(+0.281)#100 | 1.46%(-0.440)#6,637 |
Common Questions
What are the Top 10 Cities with the Highest Percentage of Immigrants from Europe in Missouri?
Top 10 Cities with the Highest Percentage of Immigrants from Europe in Missouri are:
#1
26.61%
#2
14.53%
#3
11.83%
#4
11.54%
#5
8.72%
#6
7.22%
#7
6.73%
#8
5.84%
#9
5.66%
#10
5.45%
What city has the Highest Percentage of Immigrants from Europe in Missouri?
St George has the Highest Percentage of Immigrants from Europe in Missouri with 26.61%.
What is the Percentage of Immigrants from Europe in the State of Missouri?
Percentage of Immigrants from Europe in Missouri is 0.74%.
What is the Percentage of Immigrants from Europe in the United States?
Percentage of Immigrants from Europe in the United States is 1.46%.