Cities with the Highest Percentage of Immigrants from Europe in Connecticut
RELATED REPORTS & OPTIONS
Europe
Connecticut
Compare Cities
Map of Cities with the Highest Percentage of Immigrants from Europe in Connecticut
0.00%
40.00%
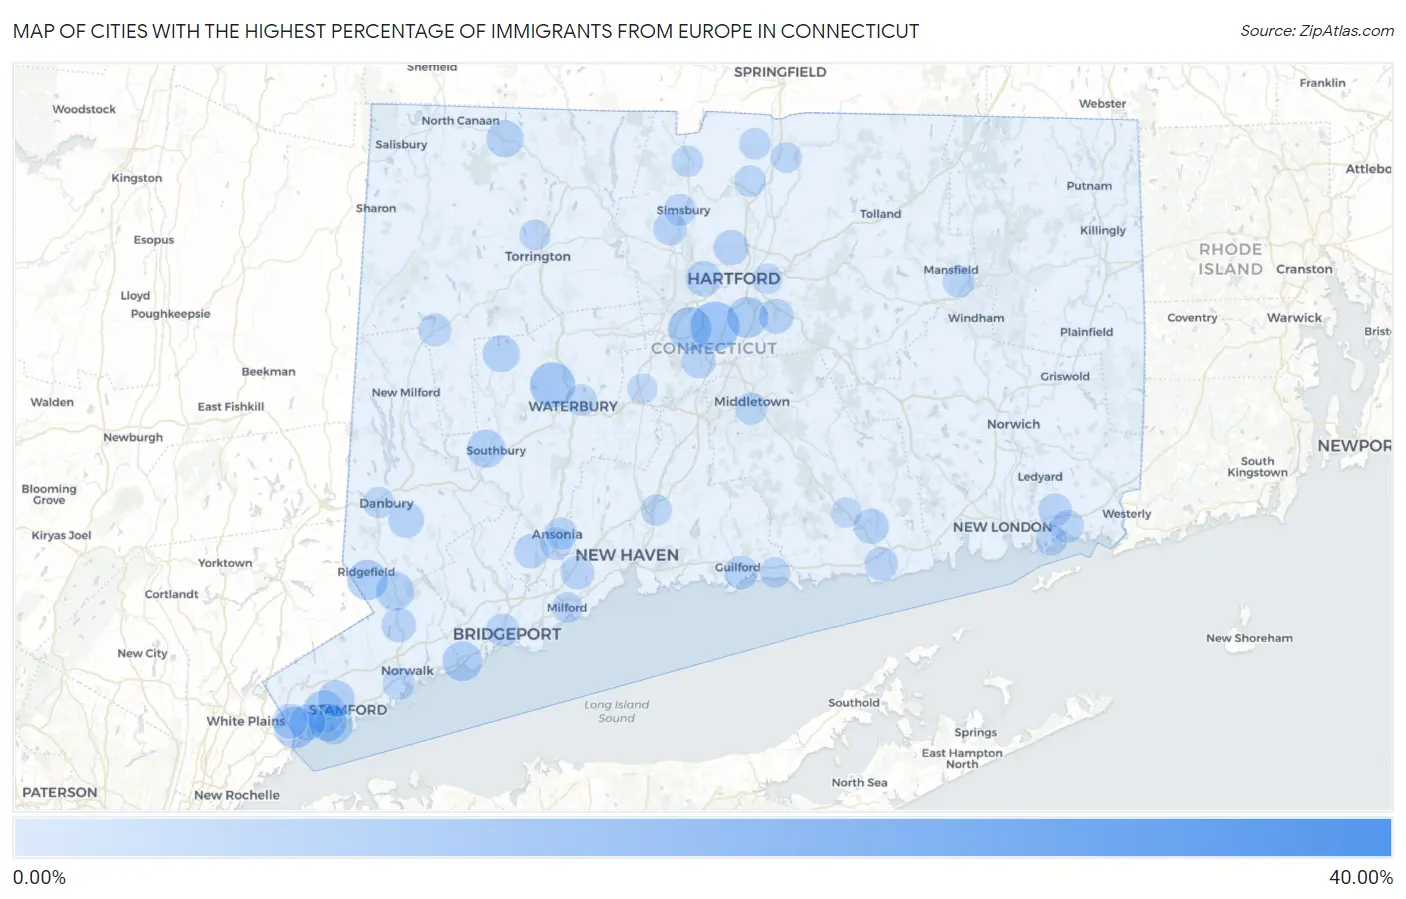
Cities with the Highest Percentage of Immigrants from Europe in Connecticut
| City | Europe | vs State | vs National | |
| 1. | Candlewood Isle | 31.05% | 3.31%(+27.7)#1 | 1.46%(+29.6)#20 |
| 2. | Topstone | 23.03% | 3.31%(+19.7)#2 | 1.46%(+21.6)#36 |
| 3. | Knollcrest | 18.87% | 3.31%(+15.6)#3 | 1.46%(+17.4)#51 |
| 4. | Chimney Point | 16.98% | 3.31%(+13.7)#4 | 1.46%(+15.5)#64 |
| 5. | Rock Ridge | 16.51% | 3.31%(+13.2)#5 | 1.46%(+15.1)#70 |
| 6. | Fenwick Borough | 12.50% | 3.31%(+9.19)#6 | 1.46%(+11.0)#128 |
| 7. | Sail Harbor | 11.19% | 3.31%(+7.88)#7 | 1.46%(+9.73)#162 |
| 8. | Newington | 10.22% | 3.31%(+6.91)#8 | 1.46%(+8.76)#199 |
| 9. | Weston | 10.16% | 3.31%(+6.85)#9 | 1.46%(+8.71)#205 |
| 10. | Bantam Borough | 10.04% | 3.31%(+6.73)#10 | 1.46%(+8.59)#209 |
| 11. | Ridgebury | 9.79% | 3.31%(+6.48)#11 | 1.46%(+8.33)#224 |
| 12. | Staples | 9.69% | 3.31%(+6.39)#12 | 1.46%(+8.24)#229 |
| 13. | Indian Field | 9.53% | 3.31%(+6.23)#13 | 1.46%(+8.08)#241 |
| 14. | Oakville | 8.65% | 3.31%(+5.34)#14 | 1.46%(+7.19)#295 |
| 15. | South Wilton | 8.47% | 3.31%(+5.16)#15 | 1.46%(+7.02)#310 |
| 16. | New Britain | 7.98% | 3.31%(+4.67)#16 | 1.46%(+6.52)#361 |
| 17. | Cornwall Bridge | 7.86% | 3.31%(+4.55)#17 | 1.46%(+6.40)#371 |
| 18. | Brookfield Center | 7.65% | 3.31%(+4.34)#18 | 1.46%(+6.19)#391 |
| 19. | Taylor Corners | 7.60% | 3.31%(+4.29)#19 | 1.46%(+6.14)#400 |
| 20. | Pemberwick | 7.25% | 3.31%(+3.94)#20 | 1.46%(+5.80)#439 |
| 21. | Cos Cob | 7.21% | 3.31%(+3.90)#21 | 1.46%(+5.75)#448 |
| 22. | Saugatuck | 6.97% | 3.31%(+3.66)#22 | 1.46%(+5.51)#481 |
| 23. | Wethersfield | 6.96% | 3.31%(+3.65)#23 | 1.46%(+5.50)#484 |
| 24. | Trumbull Center | 6.96% | 3.31%(+3.65)#24 | 1.46%(+5.50)#485 |
| 25. | Greens Farms | 6.72% | 3.31%(+3.41)#25 | 1.46%(+5.27)#515 |
| 26. | Ridgefield | 6.69% | 3.31%(+3.38)#26 | 1.46%(+5.23)#520 |
| 27. | Candlewood Knolls | 6.47% | 3.31%(+3.16)#27 | 1.46%(+5.01)#573 |
| 28. | Southport | 6.47% | 3.31%(+3.16)#28 | 1.46%(+5.01)#574 |
| 29. | Coleytown | 6.37% | 3.31%(+3.06)#29 | 1.46%(+4.92)#598 |
| 30. | Compo | 6.21% | 3.31%(+2.90)#30 | 1.46%(+4.76)#624 |
| 31. | Route 7 Gateway | 6.05% | 3.31%(+2.74)#31 | 1.46%(+4.59)#664 |
| 32. | Old Greenwich | 5.95% | 3.31%(+2.64)#32 | 1.46%(+4.49)#684 |
| 33. | Georgetown | 5.92% | 3.31%(+2.61)#33 | 1.46%(+4.46)#698 |
| 34. | Riverside | 5.86% | 3.31%(+2.55)#34 | 1.46%(+4.41)#708 |
| 35. | Heritage Village | 5.83% | 3.31%(+2.52)#35 | 1.46%(+4.37)#720 |
| 36. | New Canaan | 5.46% | 3.31%(+2.15)#36 | 1.46%(+4.01)#822 |
| 37. | Daniels Farm | 5.46% | 3.31%(+2.15)#37 | 1.46%(+4.00)#825 |
| 38. | Bethlehem Village | 5.37% | 3.31%(+2.06)#38 | 1.46%(+3.92)#859 |
| 39. | Norfolk | 5.37% | 3.31%(+2.06)#39 | 1.46%(+3.91)#860 |
| 40. | Stamford | 5.32% | 3.31%(+2.01)#40 | 1.46%(+3.87)#871 |
| 41. | Tashua | 5.17% | 3.31%(+1.86)#41 | 1.46%(+3.71)#924 |
| 42. | Greenwich | 5.02% | 3.31%(+1.72)#42 | 1.46%(+3.57)#960 |
| 43. | Noroton | 5.00% | 3.31%(+1.69)#43 | 1.46%(+3.54)#968 |
| 44. | Stonington Borough | 4.99% | 3.31%(+1.68)#44 | 1.46%(+3.53)#974 |
| 45. | Cornwall | 4.82% | 3.31%(+1.51)#45 | 1.46%(+3.36)#1,028 |
| 46. | Bethel | 4.81% | 3.31%(+1.50)#46 | 1.46%(+3.36)#1,032 |
| 47. | Lakes West | 4.79% | 3.31%(+1.48)#47 | 1.46%(+3.33)#1,041 |
| 48. | West Hartford | 4.78% | 3.31%(+1.47)#48 | 1.46%(+3.32)#1,045 |
| 49. | Essex Village | 4.73% | 3.31%(+1.42)#49 | 1.46%(+3.28)#1,068 |
| 50. | Blue Hills | 4.72% | 3.31%(+1.41)#50 | 1.46%(+3.27)#1,078 |
| 51. | Glastonbury Center | 4.64% | 3.31%(+1.33)#51 | 1.46%(+3.18)#1,117 |
| 52. | Woodmont Borough | 4.63% | 3.31%(+1.32)#52 | 1.46%(+3.18)#1,121 |
| 53. | Glenville | 4.47% | 3.31%(+1.16)#53 | 1.46%(+3.01)#1,199 |
| 54. | Wilton Center | 4.38% | 3.31%(+1.08)#54 | 1.46%(+2.93)#1,232 |
| 55. | Naugatuck Borough | 4.32% | 3.31%(+1.01)#55 | 1.46%(+2.87)#1,266 |
| 56. | Kensington | 4.31% | 3.31%(+1.00)#56 | 1.46%(+2.86)#1,271 |
| 57. | Shelton | 4.29% | 3.31%(+0.981)#57 | 1.46%(+2.83)#1,280 |
| 58. | Lordship | 4.29% | 3.31%(+0.977)#58 | 1.46%(+2.83)#1,282 |
| 59. | Old Hill | 4.17% | 3.31%(+0.858)#59 | 1.46%(+2.71)#1,321 |
| 60. | Guilford Center | 4.13% | 3.31%(+0.823)#60 | 1.46%(+2.68)#1,341 |
| 61. | Stepney | 4.11% | 3.31%(+0.801)#61 | 1.46%(+2.65)#1,356 |
| 62. | Murray | 4.10% | 3.31%(+0.793)#62 | 1.46%(+2.65)#1,359 |
| 63. | Orange | 4.08% | 3.31%(+0.766)#63 | 1.46%(+2.62)#1,369 |
| 64. | Old Mystic | 4.02% | 3.31%(+0.709)#64 | 1.46%(+2.56)#1,403 |
| 65. | Old Saybrook Center | 4.02% | 3.31%(+0.707)#65 | 1.46%(+2.56)#1,406 |
| 66. | Weatogue | 4.01% | 3.31%(+0.697)#66 | 1.46%(+2.55)#1,412 |
| 67. | Redding Center | 3.88% | 3.31%(+0.567)#67 | 1.46%(+2.42)#1,489 |
| 68. | Bridgeport | 3.86% | 3.31%(+0.548)#68 | 1.46%(+2.40)#1,502 |
| 69. | Sandy Hook | 3.82% | 3.31%(+0.512)#69 | 1.46%(+2.37)#1,526 |
| 70. | New Preston | 3.80% | 3.31%(+0.492)#70 | 1.46%(+2.35)#1,536 |
| 71. | Mystic | 3.78% | 3.31%(+0.472)#71 | 1.46%(+2.32)#1,547 |
| 72. | Bigelow Corners | 3.74% | 3.31%(+0.430)#72 | 1.46%(+2.28)#1,573 |
| 73. | Derby | 3.66% | 3.31%(+0.352)#73 | 1.46%(+2.21)#1,619 |
| 74. | Plattsville | 3.65% | 3.31%(+0.344)#74 | 1.46%(+2.20)#1,628 |
| 75. | Norwalk | 3.59% | 3.31%(+0.283)#75 | 1.46%(+2.14)#1,680 |
| 76. | Mansfield Center | 3.59% | 3.31%(+0.282)#76 | 1.46%(+2.14)#1,681 |
| 77. | Ansonia | 3.59% | 3.31%(+0.278)#77 | 1.46%(+2.13)#1,686 |
| 78. | Lakes East | 3.57% | 3.31%(+0.260)#78 | 1.46%(+2.11)#1,699 |
| 79. | Middletown | 3.55% | 3.31%(+0.240)#79 | 1.46%(+2.09)#1,713 |
| 80. | Simsbury Center | 3.49% | 3.31%(+0.177)#80 | 1.46%(+2.03)#1,764 |
| 81. | Northford | 3.46% | 3.31%(+0.149)#81 | 1.46%(+2.00)#1,782 |
| 82. | Inglenook | 3.42% | 3.31%(+0.110)#82 | 1.46%(+1.96)#1,816 |
| 83. | Windsor Locks | 3.28% | 3.31%(-0.030)#83 | 1.46%(+1.82)#1,926 |
| 84. | Suffield Depot | 3.23% | 3.31%(-0.075)#84 | 1.46%(+1.78)#1,973 |
| 85. | Waterbury | 3.20% | 3.31%(-0.107)#85 | 1.46%(+1.75)#1,995 |
| 86. | East | 3.17% | 3.31%(-0.134)#86 | 1.46%(+1.72)#2,023 |
| 87. | Noank | 3.16% | 3.31%(-0.148)#87 | 1.46%(+1.71)#2,030 |
| 88. | Salmon Brook | 3.16% | 3.31%(-0.150)#88 | 1.46%(+1.70)#2,034 |
| 89. | North Haven | 3.14% | 3.31%(-0.166)#89 | 1.46%(+1.69)#2,053 |
| 90. | Torrington | 3.11% | 3.31%(-0.197)#90 | 1.46%(+1.66)#2,082 |
| 91. | Darien Downtown | 3.06% | 3.31%(-0.251)#91 | 1.46%(+1.60)#2,132 |
| 92. | Danbury | 3.05% | 3.31%(-0.254)#92 | 1.46%(+1.60)#2,138 |
| 93. | Botsford | 2.98% | 3.31%(-0.332)#93 | 1.46%(+1.52)#2,217 |
| 94. | Southwood Acres | 2.94% | 3.31%(-0.370)#94 | 1.46%(+1.48)#2,251 |
| 95. | Milford City Balance | 2.93% | 3.31%(-0.376)#95 | 1.46%(+1.48)#2,257 |
| 96. | Madison Center | 2.86% | 3.31%(-0.445)#96 | 1.46%(+1.41)#2,335 |
| 97. | Oronoque | 2.83% | 3.31%(-0.480)#97 | 1.46%(+1.37)#2,373 |
| 98. | Deep River Center | 2.81% | 3.31%(-0.494)#98 | 1.46%(+1.36)#2,393 |
| 99. | East Hartford | 2.79% | 3.31%(-0.518)#99 | 1.46%(+1.34)#2,424 |
| 100. | Plantsville | 2.69% | 3.31%(-0.622)#100 | 1.46%(+1.23)#2,544 |
1
2Common Questions
What are the Top 10 Cities with the Highest Percentage of Immigrants from Europe in Connecticut?
Top 10 Cities with the Highest Percentage of Immigrants from Europe in Connecticut are:
#1
10.22%
#2
8.65%
#3
7.98%
#4
7.25%
#5
7.21%
#6
6.96%
#7
6.69%
#8
6.47%
#9
5.95%
#10
5.92%
What city has the Highest Percentage of Immigrants from Europe in Connecticut?
Newington has the Highest Percentage of Immigrants from Europe in Connecticut with 10.22%.
What is the Percentage of Immigrants from Europe in the State of Connecticut?
Percentage of Immigrants from Europe in Connecticut is 3.31%.
What is the Percentage of Immigrants from Europe in the United States?
Percentage of Immigrants from Europe in the United States is 1.46%.