Cities with the Largest Burmese Community in the United States
RELATED REPORTS & OPTIONS
Burmese
United States
Compare Cities
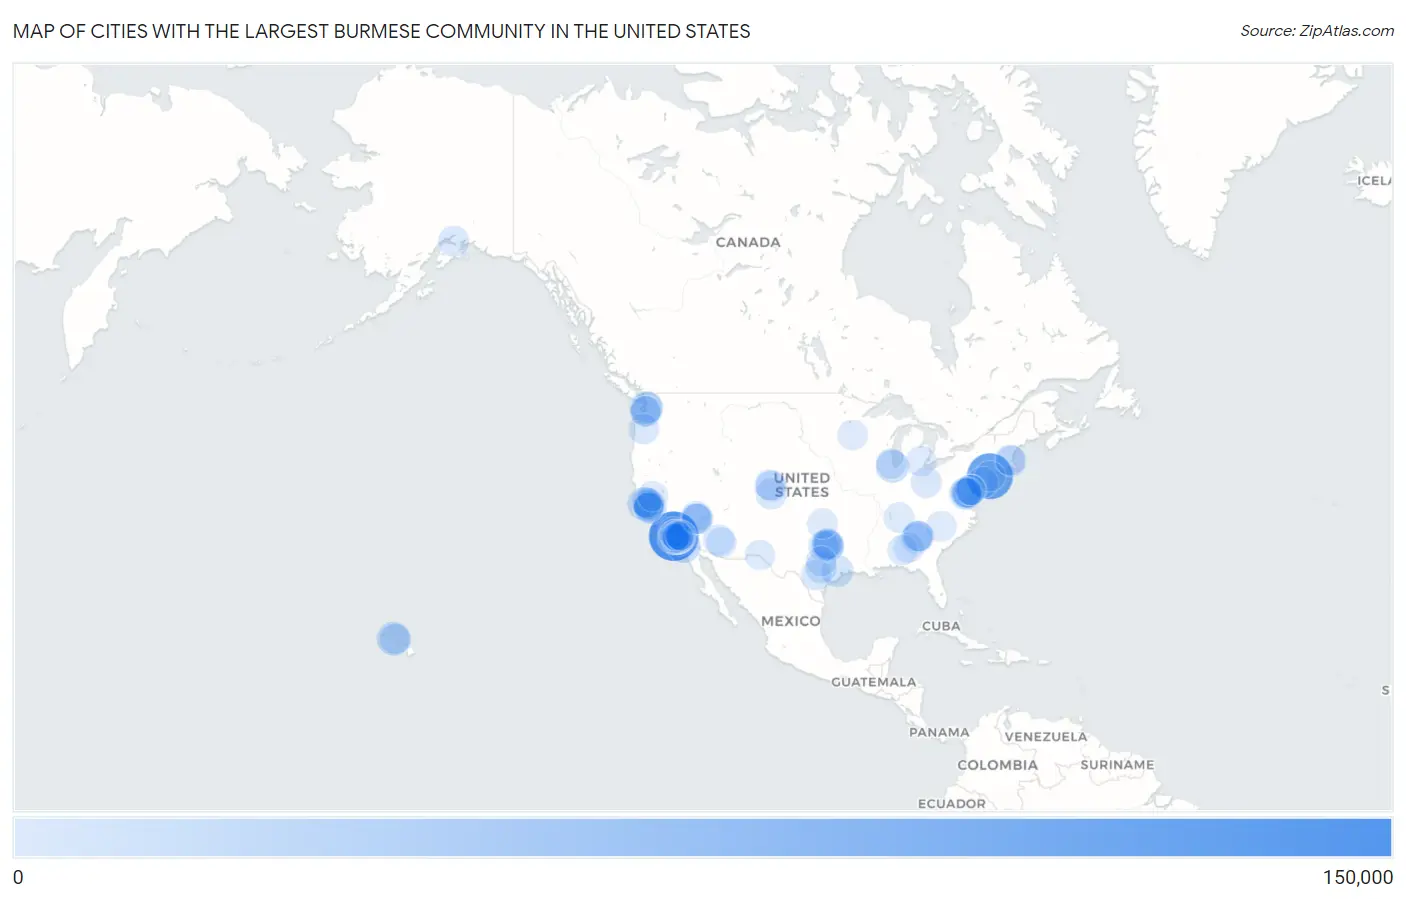
Map of Cities with the Largest Burmese Community in the United States
0
150,000
Cities with the Largest Burmese Community in the United States
| City | Burmese | vs State | vs National | |
| 1. | Los Angeles | 114,050 | 567,411(20.10%)#1 | 1,977,441(5.77%)#1 |
| 2. | New York | 92,370 | 146,013(63.26%)#1 | 1,977,441(4.67%)#2 |
| 3. | Irvine | 23,957 | 567,411(4.22%)#2 | 1,977,441(1.21%)#3 |
| 4. | Urban Honolulu | 21,479 | 52,810(40.67%)#1 | 1,977,441(1.09%)#4 |
| 5. | San Diego | 18,871 | 567,411(3.33%)#3 | 1,977,441(0.95%)#5 |
| 6. | Fullerton | 18,127 | 567,411(3.19%)#4 | 1,977,441(0.92%)#6 |
| 7. | San Jose | 17,453 | 567,411(3.08%)#5 | 1,977,441(0.88%)#7 |
| 8. | Chicago | 16,224 | 73,081(22.20%)#1 | 1,977,441(0.82%)#8 |
| 9. | San Francisco | 15,705 | 567,411(2.77%)#6 | 1,977,441(0.79%)#9 |
| 10. | Seattle | 14,448 | 100,159(14.43%)#1 | 1,977,441(0.73%)#10 |
| 11. | Torrance | 12,743 | 567,411(2.25%)#7 | 1,977,441(0.64%)#11 |
| 12. | Palisades Park Borough | 10,903 | 110,729(9.85%)#1 | 1,977,441(0.55%)#12 |
| 13. | Centreville | 10,792 | 93,521(11.54%)#1 | 1,977,441(0.55%)#13 |
| 14. | Buena Park | 10,513 | 567,411(1.85%)#8 | 1,977,441(0.53%)#14 |
| 15. | Houston | 9,722 | 118,109(8.23%)#1 | 1,977,441(0.49%)#15 |
| 16. | Fort Lee Borough | 9,373 | 110,729(8.46%)#2 | 1,977,441(0.47%)#16 |
| 17. | Austin | 8,587 | 118,109(7.27%)#2 | 1,977,441(0.43%)#17 |
| 18. | Philadelphia | 8,235 | 51,787(15.90%)#1 | 1,977,441(0.42%)#18 |
| 19. | Glendale | 7,666 | 567,411(1.35%)#9 | 1,977,441(0.39%)#19 |
| 20. | Anaheim | 6,950 | 567,411(1.22%)#10 | 1,977,441(0.35%)#20 |
| 21. | Ellicott City | 6,621 | 59,026(11.22%)#1 | 1,977,441(0.33%)#21 |
| 22. | Colorado Springs | 6,574 | 36,930(17.80%)#1 | 1,977,441(0.33%)#22 |
| 23. | Cypress | 6,514 | 567,411(1.15%)#11 | 1,977,441(0.33%)#23 |
| 24. | Cerritos | 6,469 | 567,411(1.14%)#12 | 1,977,441(0.33%)#24 |
| 25. | Bellevue | 5,617 | 100,159(5.61%)#2 | 1,977,441(0.28%)#25 |
| 26. | Brea | 5,575 | 567,411(0.98%)#13 | 1,977,441(0.28%)#26 |
| 27. | Aurora | 5,303 | 36,930(14.36%)#2 | 1,977,441(0.27%)#27 |
| 28. | Diamond Bar | 5,166 | 567,411(0.91%)#14 | 1,977,441(0.26%)#28 |
| 29. | La Mirada | 5,059 | 567,411(0.89%)#15 | 1,977,441(0.26%)#29 |
| 30. | Phoenix | 4,860 | 27,315(17.79%)#1 | 1,977,441(0.25%)#30 |
| 31. | Carrollton | 4,804 | 118,109(4.07%)#3 | 1,977,441(0.24%)#31 |
| 32. | Boston | 4,787 | 34,785(13.76%)#1 | 1,977,441(0.24%)#32 |
| 33. | Oakland | 4,689 | 567,411(0.83%)#16 | 1,977,441(0.24%)#33 |
| 34. | Plano | 4,651 | 118,109(3.94%)#4 | 1,977,441(0.24%)#34 |
| 35. | Enterprise | 4,614 | 21,149(21.82%)#1 | 1,977,441(0.23%)#35 |
| 36. | Washington | 4,502 | 4,502(100.00%)#1 | 1,977,441(0.23%)#36 |
| 37. | Federal Way | 4,479 | 100,159(4.47%)#3 | 1,977,441(0.23%)#37 |
| 38. | Dallas | 4,365 | 118,109(3.70%)#5 | 1,977,441(0.22%)#38 |
| 39. | Garden Grove | 4,354 | 567,411(0.77%)#17 | 1,977,441(0.22%)#39 |
| 40. | Columbus | 4,280 | 26,343(16.25%)#1 | 1,977,441(0.22%)#40 |
| 41. | Fort Worth | 4,201 | 118,109(3.56%)#6 | 1,977,441(0.21%)#41 |
| 42. | Anchorage | 4,133 | 6,860(60.25%)#1 | 1,977,441(0.21%)#42 |
| 43. | Santa Clara | 4,110 | 567,411(0.72%)#18 | 1,977,441(0.21%)#43 |
| 44. | Chino Hills | 4,096 | 567,411(0.72%)#19 | 1,977,441(0.21%)#44 |
| 45. | Portland | 4,057 | 26,086(15.55%)#1 | 1,977,441(0.21%)#45 |
| 46. | Las Vegas | 4,050 | 21,149(19.15%)#2 | 1,977,441(0.20%)#46 |
| 47. | Sunnyvale | 4,027 | 567,411(0.71%)#20 | 1,977,441(0.20%)#47 |
| 48. | San Antonio | 3,994 | 118,109(3.38%)#7 | 1,977,441(0.20%)#48 |
| 49. | Tustin | 3,932 | 567,411(0.69%)#21 | 1,977,441(0.20%)#49 |
| 50. | Denver | 3,804 | 36,930(10.30%)#3 | 1,977,441(0.19%)#50 |
| 51. | Long Beach | 3,803 | 567,411(0.67%)#22 | 1,977,441(0.19%)#51 |
| 52. | Johns Creek | 3,700 | 73,280(5.05%)#1 | 1,977,441(0.19%)#52 |
| 53. | Tacoma | 3,676 | 100,159(3.67%)#4 | 1,977,441(0.19%)#53 |
| 54. | Lewisville | 3,628 | 118,109(3.07%)#8 | 1,977,441(0.18%)#54 |
| 55. | San Ramon | 3,615 | 567,411(0.64%)#23 | 1,977,441(0.18%)#55 |
| 56. | La Habra | 3,501 | 567,411(0.62%)#24 | 1,977,441(0.18%)#56 |
| 57. | Yorba Linda | 3,484 | 567,411(0.61%)#25 | 1,977,441(0.18%)#57 |
| 58. | Gardena | 3,483 | 567,411(0.61%)#26 | 1,977,441(0.18%)#58 |
| 59. | Santa Clarita | 3,430 | 567,411(0.60%)#27 | 1,977,441(0.17%)#59 |
| 60. | Fair Oaks | 3,424 | 93,521(3.66%)#2 | 1,977,441(0.17%)#60 |
| 61. | Cambridge | 3,413 | 34,785(9.81%)#2 | 1,977,441(0.17%)#61 |
| 62. | Arlington | 3,411 | 93,521(3.65%)#3 | 1,977,441(0.17%)#62 |
| 63. | Atlanta | 3,398 | 73,280(4.64%)#2 | 1,977,441(0.17%)#63 |
| 64. | East Honolulu | 3,389 | 52,810(6.42%)#2 | 1,977,441(0.17%)#64 |
| 65. | Fremont | 3,366 | 567,411(0.59%)#28 | 1,977,441(0.17%)#65 |
| 66. | Henderson | 3,308 | 21,149(15.64%)#3 | 1,977,441(0.17%)#66 |
| 67. | La Crescenta Montrose | 3,298 | 567,411(0.58%)#29 | 1,977,441(0.17%)#67 |
| 68. | Rancho Palos Verdes | 3,261 | 567,411(0.57%)#30 | 1,977,441(0.16%)#68 |
| 69. | Frisco | 3,242 | 118,109(2.74%)#9 | 1,977,441(0.16%)#69 |
| 70. | Duluth | 3,235 | 73,280(4.41%)#3 | 1,977,441(0.16%)#70 |
| 71. | Nashville | 3,226 | 17,353(18.59%)#1 | 1,977,441(0.16%)#71 |
| 72. | Ann Arbor | 3,193 | 39,176(8.15%)#1 | 1,977,441(0.16%)#72 |
| 73. | Auburn | 3,114 | 16,286(19.12%)#1 | 1,977,441(0.16%)#73 |
| 74. | Oklahoma City | 3,083 | 10,191(30.25%)#1 | 1,977,441(0.16%)#74 |
| 75. | Pasadena | 3,072 | 567,411(0.54%)#31 | 1,977,441(0.16%)#75 |
| 76. | La Canada Flintridge | 3,064 | 567,411(0.54%)#32 | 1,977,441(0.15%)#76 |
| 77. | Charlotte | 3,053 | 34,901(8.75%)#1 | 1,977,441(0.15%)#77 |
| 78. | Berkeley | 2,990 | 567,411(0.53%)#33 | 1,977,441(0.15%)#78 |
| 79. | Montgomery | 2,962 | 16,286(18.19%)#2 | 1,977,441(0.15%)#79 |
| 80. | Edgewater Borough | 2,944 | 110,729(2.66%)#3 | 1,977,441(0.15%)#80 |
| 81. | Suwanee | 2,923 | 73,280(3.99%)#4 | 1,977,441(0.15%)#81 |
| 82. | Minneapolis | 2,900 | 25,104(11.55%)#1 | 1,977,441(0.15%)#82 |
| 83. | Sacramento | 2,886 | 567,411(0.51%)#34 | 1,977,441(0.15%)#83 |
| 84. | Jersey City | 2,857 | 110,729(2.58%)#4 | 1,977,441(0.14%)#84 |
| 85. | Spring Valley | 2,824 | 21,149(13.35%)#4 | 1,977,441(0.14%)#85 |
| 86. | Ridgefield Borough | 2,729 | 110,729(2.46%)#5 | 1,977,441(0.14%)#86 |
| 87. | Tenafly Borough | 2,659 | 110,729(2.40%)#6 | 1,977,441(0.13%)#87 |
| 88. | Cupertino | 2,635 | 567,411(0.46%)#35 | 1,977,441(0.13%)#88 |
| 89. | Rowland Heights | 2,629 | 567,411(0.46%)#36 | 1,977,441(0.13%)#89 |
| 90. | Riverside | 2,585 | 567,411(0.46%)#37 | 1,977,441(0.13%)#90 |
| 91. | Mclean | 2,585 | 93,521(2.76%)#4 | 1,977,441(0.13%)#91 |
| 92. | El Paso | 2,564 | 118,109(2.17%)#10 | 1,977,441(0.13%)#92 |
| 93. | Columbia | 2,553 | 59,026(4.33%)#2 | 1,977,441(0.13%)#93 |
| 94. | Killeen | 2,540 | 118,109(2.15%)#11 | 1,977,441(0.13%)#94 |
| 95. | Glenview | 2,534 | 73,081(3.47%)#2 | 1,977,441(0.13%)#95 |
| 96. | Oakton | 2,525 | 93,521(2.70%)#5 | 1,977,441(0.13%)#96 |
| 97. | Leonia Borough | 2,524 | 110,729(2.28%)#7 | 1,977,441(0.13%)#97 |
| 98. | Chandler | 2,519 | 27,315(9.22%)#2 | 1,977,441(0.13%)#98 |
| 99. | Rancho Cucamonga | 2,501 | 567,411(0.44%)#38 | 1,977,441(0.13%)#99 |
| 100. | Baltimore | 2,480 | 59,026(4.20%)#3 | 1,977,441(0.13%)#100 |
Common Questions
What are the Top 10 Cities with the Largest Burmese Community in the United States?
Top 10 Cities with the Largest Burmese Community in the United States are:
What city has the Largest Burmese Community in the United States?
Los Angeles has the Largest Burmese Community in the United States with 114,050.
What is the Total Burmese Population in the United States?
Total Burmese Population in the United States is 1,977,441.