Cities with the Largest Burmese Community in New York
RELATED REPORTS & OPTIONS
Burmese
New York
Compare Cities
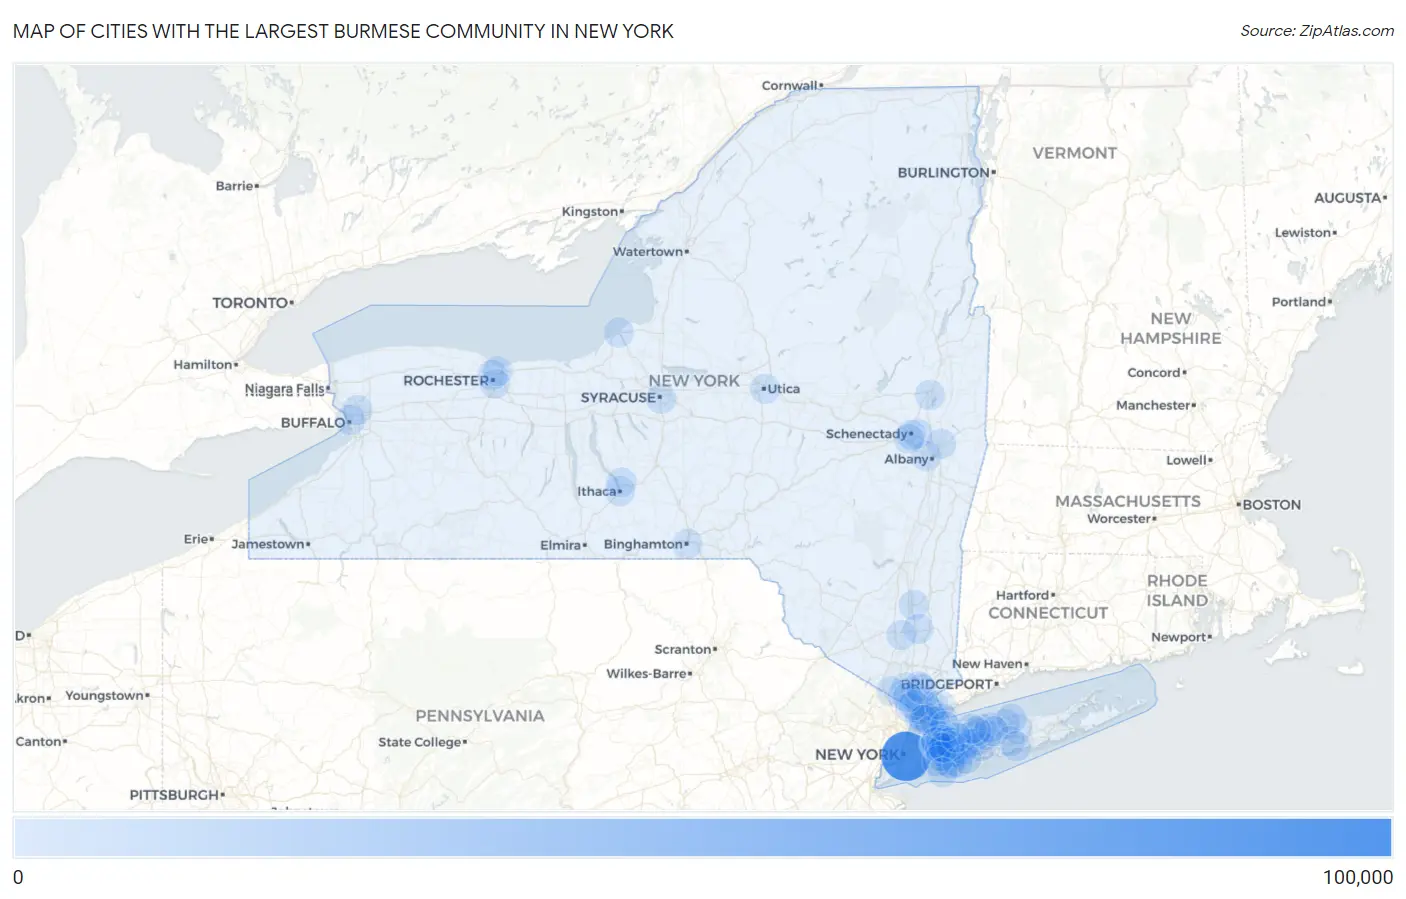
Map of Cities with the Largest Burmese Community in New York
0
100,000
Cities with the Largest Burmese Community in New York
| City | Burmese | vs State | vs National | |
| 1. | New York | 92,370 | 146,013(63.26%)#1 | 1,977,441(4.67%)#2 |
| 2. | Plainview | 1,306 | 146,013(0.89%)#2 | 1,977,441(0.07%)#228 |
| 3. | Syosset | 1,137 | 146,013(0.78%)#3 | 1,977,441(0.06%)#273 |
| 4. | Jericho | 820 | 146,013(0.56%)#4 | 1,977,441(0.04%)#371 |
| 5. | Hicksville | 751 | 146,013(0.51%)#5 | 1,977,441(0.04%)#399 |
| 6. | New Rochelle | 732 | 146,013(0.50%)#6 | 1,977,441(0.04%)#411 |
| 7. | Yonkers | 724 | 146,013(0.50%)#7 | 1,977,441(0.04%)#417 |
| 8. | Rochester | 720 | 146,013(0.49%)#8 | 1,977,441(0.04%)#419 |
| 9. | Buffalo | 661 | 146,013(0.45%)#9 | 1,977,441(0.03%)#451 |
| 10. | Dix Hills | 607 | 146,013(0.42%)#10 | 1,977,441(0.03%)#482 |
| 11. | Searingtown | 541 | 146,013(0.37%)#11 | 1,977,441(0.03%)#532 |
| 12. | Syracuse | 536 | 146,013(0.37%)#12 | 1,977,441(0.03%)#540 |
| 13. | Scarsdale | 486 | 146,013(0.33%)#13 | 1,977,441(0.02%)#604 |
| 14. | Manhasset | 481 | 146,013(0.33%)#14 | 1,977,441(0.02%)#612 |
| 15. | Brighton | 480 | 146,013(0.33%)#15 | 1,977,441(0.02%)#615 |
| 16. | Tuckahoe | 470 | 146,013(0.32%)#16 | 1,977,441(0.02%)#627 |
| 17. | Dobbs Ferry | 463 | 146,013(0.32%)#17 | 1,977,441(0.02%)#633 |
| 18. | North Hills | 458 | 146,013(0.31%)#18 | 1,977,441(0.02%)#640 |
| 19. | White Plains | 451 | 146,013(0.31%)#19 | 1,977,441(0.02%)#651 |
| 20. | Loudonville | 432 | 146,013(0.30%)#20 | 1,977,441(0.02%)#674 |
| 21. | University Gardens | 427 | 146,013(0.29%)#21 | 1,977,441(0.02%)#683 |
| 22. | New City | 410 | 146,013(0.28%)#22 | 1,977,441(0.02%)#707 |
| 23. | Saratoga Springs | 407 | 146,013(0.28%)#23 | 1,977,441(0.02%)#715 |
| 24. | Port Washington | 407 | 146,013(0.28%)#24 | 1,977,441(0.02%)#716 |
| 25. | Garden City Park | 405 | 146,013(0.28%)#25 | 1,977,441(0.02%)#718 |
| 26. | Albany | 392 | 146,013(0.27%)#26 | 1,977,441(0.02%)#739 |
| 27. | Garden City | 388 | 146,013(0.27%)#27 | 1,977,441(0.02%)#746 |
| 28. | Salisbury | 387 | 146,013(0.27%)#28 | 1,977,441(0.02%)#748 |
| 29. | East Meadow | 383 | 146,013(0.26%)#29 | 1,977,441(0.02%)#761 |
| 30. | Roslyn Heights | 382 | 146,013(0.26%)#30 | 1,977,441(0.02%)#766 |
| 31. | Rye | 368 | 146,013(0.25%)#31 | 1,977,441(0.02%)#795 |
| 32. | East Northport | 360 | 146,013(0.25%)#32 | 1,977,441(0.02%)#812 |
| 33. | Greenville Cdp Westchester County | 357 | 146,013(0.24%)#33 | 1,977,441(0.02%)#815 |
| 34. | Levittown | 356 | 146,013(0.24%)#34 | 1,977,441(0.02%)#816 |
| 35. | Eastchester | 347 | 146,013(0.24%)#35 | 1,977,441(0.02%)#840 |
| 36. | Rockville Centre | 346 | 146,013(0.24%)#36 | 1,977,441(0.02%)#846 |
| 37. | Manorhaven | 342 | 146,013(0.23%)#37 | 1,977,441(0.02%)#855 |
| 38. | Tarrytown | 314 | 146,013(0.22%)#38 | 1,977,441(0.02%)#917 |
| 39. | Baldwin | 311 | 146,013(0.21%)#39 | 1,977,441(0.02%)#925 |
| 40. | Bethpage | 299 | 146,013(0.20%)#40 | 1,977,441(0.02%)#959 |
| 41. | North New Hyde Park | 298 | 146,013(0.20%)#41 | 1,977,441(0.02%)#961 |
| 42. | Stony Brook University | 296 | 146,013(0.20%)#42 | 1,977,441(0.01%)#968 |
| 43. | Great Neck Plaza | 283 | 146,013(0.19%)#43 | 1,977,441(0.01%)#1,010 |
| 44. | Herricks | 277 | 146,013(0.19%)#44 | 1,977,441(0.01%)#1,027 |
| 45. | Elwood | 273 | 146,013(0.19%)#45 | 1,977,441(0.01%)#1,037 |
| 46. | Ithaca | 268 | 146,013(0.18%)#46 | 1,977,441(0.01%)#1,050 |
| 47. | Great Neck Gardens | 267 | 146,013(0.18%)#47 | 1,977,441(0.01%)#1,054 |
| 48. | Eggertsville | 258 | 146,013(0.18%)#48 | 1,977,441(0.01%)#1,078 |
| 49. | Mineola | 249 | 146,013(0.17%)#49 | 1,977,441(0.01%)#1,108 |
| 50. | Poughkeepsie | 248 | 146,013(0.17%)#50 | 1,977,441(0.01%)#1,112 |
| 51. | East Setauket | 245 | 146,013(0.17%)#51 | 1,977,441(0.01%)#1,124 |
| 52. | Niskayuna | 235 | 146,013(0.16%)#52 | 1,977,441(0.01%)#1,156 |
| 53. | Nanuet | 235 | 146,013(0.16%)#53 | 1,977,441(0.01%)#1,157 |
| 54. | Coram | 233 | 146,013(0.16%)#54 | 1,977,441(0.01%)#1,162 |
| 55. | Commack | 231 | 146,013(0.16%)#55 | 1,977,441(0.01%)#1,175 |
| 56. | Thomaston | 229 | 146,013(0.16%)#56 | 1,977,441(0.01%)#1,180 |
| 57. | East Hills | 212 | 146,013(0.15%)#57 | 1,977,441(0.01%)#1,248 |
| 58. | Mamaroneck | 199 | 146,013(0.14%)#58 | 1,977,441(0.01%)#1,294 |
| 59. | Binghamton | 195 | 146,013(0.13%)#59 | 1,977,441(0.01%)#1,312 |
| 60. | Melville | 193 | 146,013(0.13%)#60 | 1,977,441(0.01%)#1,323 |
| 61. | Deer Park | 191 | 146,013(0.13%)#61 | 1,977,441(0.01%)#1,332 |
| 62. | New Hyde Park | 188 | 146,013(0.13%)#62 | 1,977,441(0.01%)#1,349 |
| 63. | Old Westbury | 185 | 146,013(0.13%)#63 | 1,977,441(0.01%)#1,367 |
| 64. | Freeport | 183 | 146,013(0.13%)#64 | 1,977,441(0.01%)#1,376 |
| 65. | Flower Hill | 181 | 146,013(0.12%)#65 | 1,977,441(0.01%)#1,389 |
| 66. | Montebello | 181 | 146,013(0.12%)#66 | 1,977,441(0.01%)#1,390 |
| 67. | Lake Success | 181 | 146,013(0.12%)#67 | 1,977,441(0.01%)#1,391 |
| 68. | Merritt Park | 180 | 146,013(0.12%)#68 | 1,977,441(0.01%)#1,398 |
| 69. | Kings Park | 175 | 146,013(0.12%)#69 | 1,977,441(0.01%)#1,425 |
| 70. | Utica | 174 | 146,013(0.12%)#70 | 1,977,441(0.01%)#1,430 |
| 71. | Ossining | 174 | 146,013(0.12%)#71 | 1,977,441(0.01%)#1,431 |
| 72. | Lansing | 170 | 146,013(0.12%)#72 | 1,977,441(0.01%)#1,456 |
| 73. | Manhasset Hills | 164 | 146,013(0.11%)#73 | 1,977,441(0.01%)#1,491 |
| 74. | Westbury | 161 | 146,013(0.11%)#74 | 1,977,441(0.01%)#1,507 |
| 75. | Schenectady | 160 | 146,013(0.11%)#75 | 1,977,441(0.01%)#1,514 |
| 76. | Troy | 158 | 146,013(0.11%)#76 | 1,977,441(0.01%)#1,522 |
| 77. | Holbrook | 158 | 146,013(0.11%)#77 | 1,977,441(0.01%)#1,525 |
| 78. | Tappan | 158 | 146,013(0.11%)#78 | 1,977,441(0.01%)#1,528 |
| 79. | Piermont | 158 | 146,013(0.11%)#79 | 1,977,441(0.01%)#1,529 |
| 80. | Port Jefferson | 157 | 146,013(0.11%)#80 | 1,977,441(0.01%)#1,534 |
| 81. | Oswego | 153 | 146,013(0.10%)#81 | 1,977,441(0.01%)#1,564 |
| 82. | Bronxville | 153 | 146,013(0.10%)#82 | 1,977,441(0.01%)#1,566 |
| 83. | Smithtown | 152 | 146,013(0.10%)#83 | 1,977,441(0.01%)#1,568 |
| 84. | Greenlawn | 151 | 146,013(0.10%)#84 | 1,977,441(0.01%)#1,572 |
| 85. | West Nyack | 151 | 146,013(0.10%)#85 | 1,977,441(0.01%)#1,577 |
| 86. | Valley Stream | 145 | 146,013(0.10%)#86 | 1,977,441(0.01%)#1,610 |
| 87. | Irondequoit | 141 | 146,013(0.10%)#87 | 1,977,441(0.01%)#1,644 |
| 88. | Franklin Square | 140 | 146,013(0.10%)#88 | 1,977,441(0.01%)#1,652 |
| 89. | Bellmore | 138 | 146,013(0.09%)#89 | 1,977,441(0.01%)#1,672 |
| 90. | Briarcliff Manor | 138 | 146,013(0.09%)#90 | 1,977,441(0.01%)#1,675 |
| 91. | Massapequa Park | 137 | 146,013(0.09%)#91 | 1,977,441(0.01%)#1,680 |
| 92. | Huntington | 133 | 146,013(0.09%)#92 | 1,977,441(0.01%)#1,712 |
| 93. | Patchogue | 133 | 146,013(0.09%)#93 | 1,977,441(0.01%)#1,714 |
| 94. | Rye Brook | 133 | 146,013(0.09%)#94 | 1,977,441(0.01%)#1,715 |
| 95. | Williston Park | 132 | 146,013(0.09%)#95 | 1,977,441(0.01%)#1,722 |
| 96. | Long Beach | 131 | 146,013(0.09%)#96 | 1,977,441(0.01%)#1,726 |
| 97. | Rotterdam | 129 | 146,013(0.09%)#97 | 1,977,441(0.01%)#1,739 |
| 98. | Glen Cove | 128 | 146,013(0.09%)#98 | 1,977,441(0.01%)#1,752 |
| 99. | Muttontown | 128 | 146,013(0.09%)#99 | 1,977,441(0.01%)#1,758 |
| 100. | Newburgh | 127 | 146,013(0.09%)#100 | 1,977,441(0.01%)#1,761 |
Common Questions
What are the Top 10 Cities with the Largest Burmese Community in New York?
Top 10 Cities with the Largest Burmese Community in New York are:
#1
92,370
#2
1,306
#3
1,137
#4
820
#5
751
#6
732
#7
724
#8
720
#9
661
#10
607
What city has the Largest Burmese Community in New York?
New York has the Largest Burmese Community in New York with 92,370.
What is the Total Burmese Population in the State of New York?
Total Burmese Population in New York is 146,013.
What is the Total Burmese Population in the United States?
Total Burmese Population in the United States is 1,977,441.