Cities with the Most Immigrants from Caribbean in Ohio
RELATED REPORTS & OPTIONS
Caribbean
Ohio
Compare Cities
Map of Cities with the Most Immigrants from Caribbean in Ohio
0
6,000
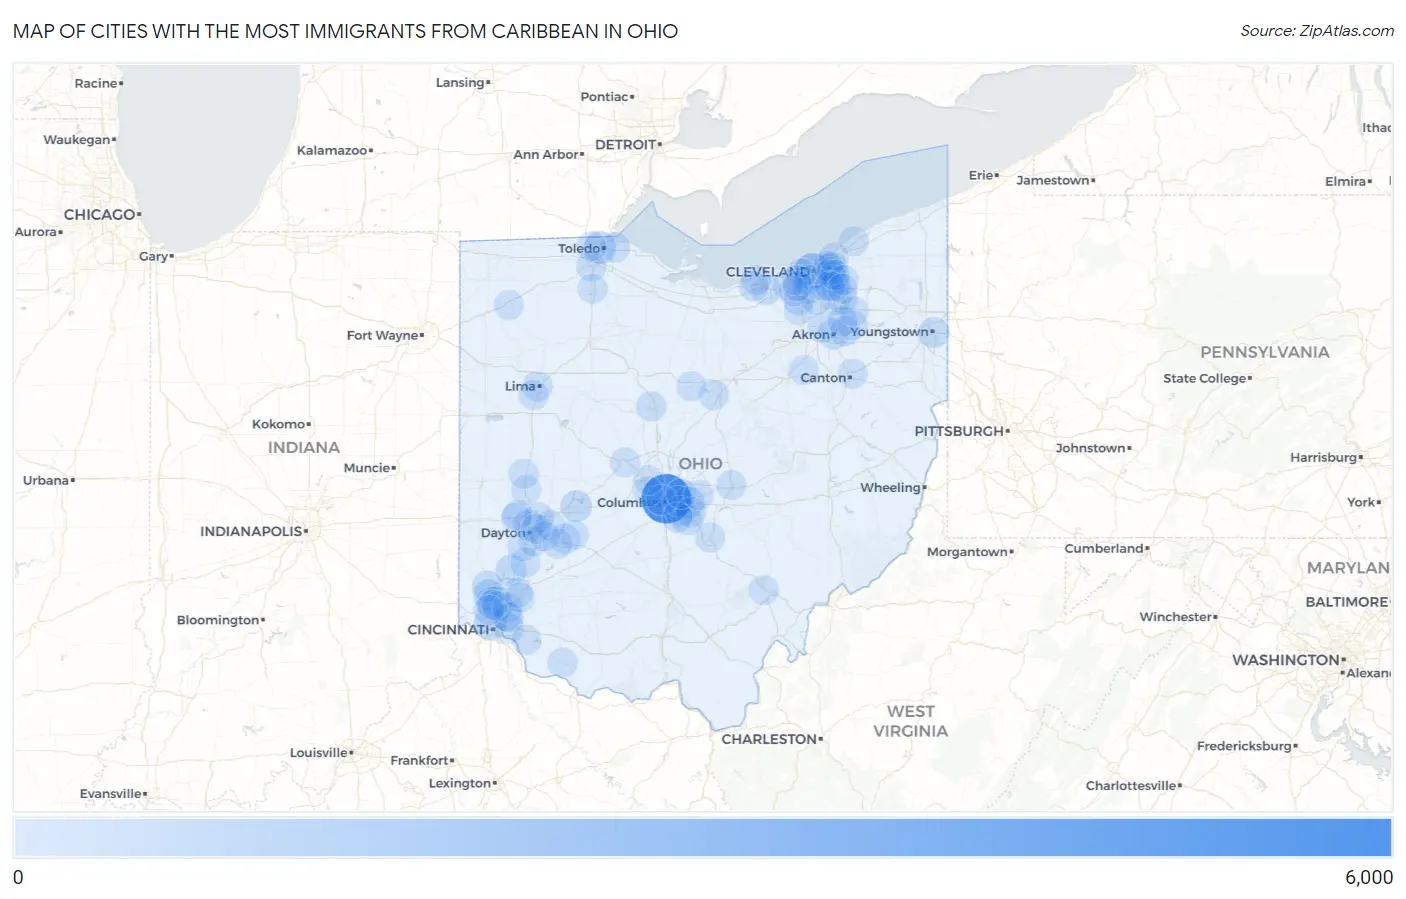
Cities with the Most Immigrants from Caribbean in Ohio
| City | Caribbean | vs State | vs National | |
| 1. | Columbus | 5,544 | 18,985(29.20%)#1 | 4,544,093(0.12%)#117 |
| 2. | Cleveland | 1,728 | 18,985(9.10%)#2 | 4,544,093(0.04%)#288 |
| 3. | Cincinnati | 689 | 18,985(3.63%)#3 | 4,544,093(0.02%)#554 |
| 4. | Toledo | 643 | 18,985(3.39%)#4 | 4,544,093(0.01%)#579 |
| 5. | Reynoldsburg | 487 | 18,985(2.57%)#5 | 4,544,093(0.01%)#680 |
| 6. | Springfield | 459 | 18,985(2.42%)#6 | 4,544,093(0.01%)#715 |
| 7. | Forest Park | 343 | 18,985(1.81%)#7 | 4,544,093(0.01%)#899 |
| 8. | Middletown | 334 | 18,985(1.76%)#8 | 4,544,093(0.01%)#919 |
| 9. | Fairfield | 330 | 18,985(1.74%)#9 | 4,544,093(0.01%)#930 |
| 10. | Hamilton | 307 | 18,985(1.62%)#10 | 4,544,093(0.01%)#987 |
| 11. | Dayton | 268 | 18,985(1.41%)#11 | 4,544,093(0.01%)#1,083 |
| 12. | Akron | 256 | 18,985(1.35%)#12 | 4,544,093(0.01%)#1,121 |
| 13. | Youngstown | 251 | 18,985(1.32%)#13 | 4,544,093(0.01%)#1,145 |
| 14. | Blacklick Estates | 207 | 18,985(1.09%)#14 | 4,544,093(0.00%)#1,301 |
| 15. | Parma | 186 | 18,985(0.98%)#15 | 4,544,093(0.00%)#1,401 |
| 16. | Strongsville | 159 | 18,985(0.84%)#16 | 4,544,093(0.00%)#1,564 |
| 17. | South Euclid | 152 | 18,985(0.80%)#17 | 4,544,093(0.00%)#1,605 |
| 18. | Cleveland Heights | 146 | 18,985(0.77%)#18 | 4,544,093(0.00%)#1,641 |
| 19. | Whitehall | 139 | 18,985(0.73%)#19 | 4,544,093(0.00%)#1,688 |
| 20. | Garfield Heights | 131 | 18,985(0.69%)#20 | 4,544,093(0.00%)#1,760 |
| 21. | Brooklyn | 120 | 18,985(0.63%)#21 | 4,544,093(0.00%)#1,855 |
| 22. | Fairlawn | 117 | 18,985(0.62%)#22 | 4,544,093(0.00%)#1,892 |
| 23. | Wilberforce | 107 | 18,985(0.56%)#23 | 4,544,093(0.00%)#2,004 |
| 24. | Lima | 99 | 18,985(0.52%)#24 | 4,544,093(0.00%)#2,093 |
| 25. | Canal Winchester | 96 | 18,985(0.51%)#25 | 4,544,093(0.00%)#2,153 |
| 26. | Pickerington | 94 | 18,985(0.50%)#26 | 4,544,093(0.00%)#2,172 |
| 27. | Grandview Heights | 91 | 18,985(0.48%)#27 | 4,544,093(0.00%)#2,220 |
| 28. | Elyria | 89 | 18,985(0.47%)#28 | 4,544,093(0.00%)#2,244 |
| 29. | Groveport | 85 | 18,985(0.45%)#29 | 4,544,093(0.00%)#2,307 |
| 30. | University Heights | 81 | 18,985(0.43%)#30 | 4,544,093(0.00%)#2,353 |
| 31. | Marion | 77 | 18,985(0.41%)#31 | 4,544,093(0.00%)#2,422 |
| 32. | Huber Heights | 72 | 18,985(0.38%)#32 | 4,544,093(0.00%)#2,515 |
| 33. | Warrensville Heights | 72 | 18,985(0.38%)#33 | 4,544,093(0.00%)#2,519 |
| 34. | Newark | 71 | 18,985(0.37%)#34 | 4,544,093(0.00%)#2,529 |
| 35. | Macedonia | 69 | 18,985(0.36%)#35 | 4,544,093(0.00%)#2,567 |
| 36. | Springdale | 68 | 18,985(0.36%)#36 | 4,544,093(0.00%)#2,585 |
| 37. | Turpin Hills | 67 | 18,985(0.35%)#37 | 4,544,093(0.00%)#2,609 |
| 38. | Oregon | 65 | 18,985(0.34%)#38 | 4,544,093(0.00%)#2,634 |
| 39. | Tallmadge | 63 | 18,985(0.33%)#39 | 4,544,093(0.00%)#2,670 |
| 40. | Shaker Heights | 62 | 18,985(0.33%)#40 | 4,544,093(0.00%)#2,692 |
| 41. | East Cleveland | 52 | 18,985(0.27%)#41 | 4,544,093(0.00%)#2,941 |
| 42. | Perrysburg | 51 | 18,985(0.27%)#42 | 4,544,093(0.00%)#2,966 |
| 43. | Bedford Heights | 51 | 18,985(0.27%)#43 | 4,544,093(0.00%)#2,974 |
| 44. | Clayton | 50 | 18,985(0.26%)#44 | 4,544,093(0.00%)#2,998 |
| 45. | Lorain | 48 | 18,985(0.25%)#45 | 4,544,093(0.00%)#3,040 |
| 46. | Lakewood | 48 | 18,985(0.25%)#46 | 4,544,093(0.00%)#3,042 |
| 47. | Lexington | 48 | 18,985(0.25%)#47 | 4,544,093(0.00%)#3,056 |
| 48. | Dublin | 46 | 18,985(0.24%)#48 | 4,544,093(0.00%)#3,104 |
| 49. | North Olmsted | 46 | 18,985(0.24%)#49 | 4,544,093(0.00%)#3,107 |
| 50. | Woodlawn | 46 | 18,985(0.24%)#50 | 4,544,093(0.00%)#3,125 |
| 51. | Euclid | 45 | 18,985(0.24%)#51 | 4,544,093(0.00%)#3,132 |
| 52. | Twinsburg | 44 | 18,985(0.23%)#52 | 4,544,093(0.00%)#3,166 |
| 53. | Hilliard | 38 | 18,985(0.20%)#53 | 4,544,093(0.00%)#3,356 |
| 54. | Gahanna | 37 | 18,985(0.19%)#54 | 4,544,093(0.00%)#3,395 |
| 55. | Beachwood | 37 | 18,985(0.19%)#55 | 4,544,093(0.00%)#3,404 |
| 56. | Englewood | 37 | 18,985(0.19%)#56 | 4,544,093(0.00%)#3,405 |
| 57. | Brunswick | 36 | 18,985(0.19%)#57 | 4,544,093(0.00%)#3,428 |
| 58. | Fort Shawnee | 36 | 18,985(0.19%)#58 | 4,544,093(0.00%)#3,449 |
| 59. | Cedarville | 35 | 18,985(0.18%)#59 | 4,544,093(0.00%)#3,495 |
| 60. | Kent | 32 | 18,985(0.17%)#60 | 4,544,093(0.00%)#3,597 |
| 61. | Berea | 32 | 18,985(0.17%)#61 | 4,544,093(0.00%)#3,604 |
| 62. | Pataskala | 32 | 18,985(0.17%)#62 | 4,544,093(0.00%)#3,605 |
| 63. | Defiance | 32 | 18,985(0.17%)#63 | 4,544,093(0.00%)#3,608 |
| 64. | Troy | 31 | 18,985(0.16%)#64 | 4,544,093(0.00%)#3,645 |
| 65. | Silverton | 31 | 18,985(0.16%)#65 | 4,544,093(0.00%)#3,664 |
| 66. | Fairborn | 30 | 18,985(0.16%)#66 | 4,544,093(0.00%)#3,681 |
| 67. | Springboro | 30 | 18,985(0.16%)#67 | 4,544,093(0.00%)#3,685 |
| 68. | Georgetown | 30 | 18,985(0.16%)#68 | 4,544,093(0.00%)#3,708 |
| 69. | Kettering | 29 | 18,985(0.15%)#69 | 4,544,093(0.00%)#3,723 |
| 70. | Piqua | 29 | 18,985(0.15%)#70 | 4,544,093(0.00%)#3,725 |
| 71. | Orrville | 29 | 18,985(0.15%)#71 | 4,544,093(0.00%)#3,737 |
| 72. | Broadview Heights | 28 | 18,985(0.15%)#72 | 4,544,093(0.00%)#3,777 |
| 73. | Amherst | 28 | 18,985(0.15%)#73 | 4,544,093(0.00%)#3,785 |
| 74. | Blue Ash | 27 | 18,985(0.14%)#74 | 4,544,093(0.00%)#3,830 |
| 75. | Madeira | 27 | 18,985(0.14%)#75 | 4,544,093(0.00%)#3,839 |
| 76. | Amelia | 26 | 18,985(0.14%)#76 | 4,544,093(0.00%)#3,874 |
| 77. | Greenhills | 26 | 18,985(0.14%)#77 | 4,544,093(0.00%)#3,904 |
| 78. | Mentor | 25 | 18,985(0.13%)#78 | 4,544,093(0.00%)#3,924 |
| 79. | Xenia | 24 | 18,985(0.13%)#79 | 4,544,093(0.00%)#3,988 |
| 80. | Maple Heights | 24 | 18,985(0.13%)#80 | 4,544,093(0.00%)#3,992 |
| 81. | Canton | 23 | 18,985(0.12%)#81 | 4,544,093(0.00%)#4,037 |
| 82. | Lancaster | 23 | 18,985(0.12%)#82 | 4,544,093(0.00%)#4,039 |
| 83. | Stow | 22 | 18,985(0.12%)#83 | 4,544,093(0.00%)#4,094 |
| 84. | Fairview Park | 22 | 18,985(0.12%)#84 | 4,544,093(0.00%)#4,098 |
| 85. | Ottawa Hills | 22 | 18,985(0.12%)#85 | 4,544,093(0.00%)#4,115 |
| 86. | Madison Place | 22 | 18,985(0.12%)#86 | 4,544,093(0.00%)#4,142 |
| 87. | Mason | 21 | 18,985(0.11%)#87 | 4,544,093(0.00%)#4,147 |
| 88. | Landen | 21 | 18,985(0.11%)#88 | 4,544,093(0.00%)#4,176 |
| 89. | Moreland Hills | 21 | 18,985(0.11%)#89 | 4,544,093(0.00%)#4,194 |
| 90. | Solon | 20 | 18,985(0.11%)#90 | 4,544,093(0.00%)#4,225 |
| 91. | Streetsboro | 20 | 18,985(0.11%)#91 | 4,544,093(0.00%)#4,230 |
| 92. | Mount Healthy | 20 | 18,985(0.11%)#92 | 4,544,093(0.00%)#4,242 |
| 93. | Marysville | 19 | 18,985(0.10%)#93 | 4,544,093(0.00%)#4,282 |
| 94. | Galion | 19 | 18,985(0.10%)#94 | 4,544,093(0.00%)#4,295 |
| 95. | Bowling Green | 18 | 18,985(0.09%)#95 | 4,544,093(0.00%)#4,359 |
| 96. | Brook Park | 18 | 18,985(0.09%)#96 | 4,544,093(0.00%)#4,368 |
| 97. | West Carrollton | 18 | 18,985(0.09%)#97 | 4,544,093(0.00%)#4,375 |
| 98. | Beavercreek | 17 | 18,985(0.09%)#98 | 4,544,093(0.00%)#4,428 |
| 99. | Riverside | 17 | 18,985(0.09%)#99 | 4,544,093(0.00%)#4,432 |
| 100. | The Plains | 17 | 18,985(0.09%)#100 | 4,544,093(0.00%)#4,482 |
Common Questions
What are the Top 10 Cities with the Most Immigrants from Caribbean in Ohio?
Top 10 Cities with the Most Immigrants from Caribbean in Ohio are:
#1
5,544
#2
1,728
#3
689
#4
643
#5
487
#6
459
#7
343
#8
334
#9
330
#10
307
What city has the Most Immigrants from Caribbean in Ohio?
Columbus has the Most Immigrants from Caribbean in Ohio with 5,544.
What is the Total Immigrants from Caribbean in the State of Ohio?
Total Immigrants from Caribbean in Ohio is 18,985.
What is the Total Immigrants from Caribbean in the United States?
Total Immigrants from Caribbean in the United States is 4,544,093.