Cities with the Highest Percentage of Immigrants from Western Asia in Michigan
RELATED REPORTS & OPTIONS
Western Asia
Michigan
Compare Cities
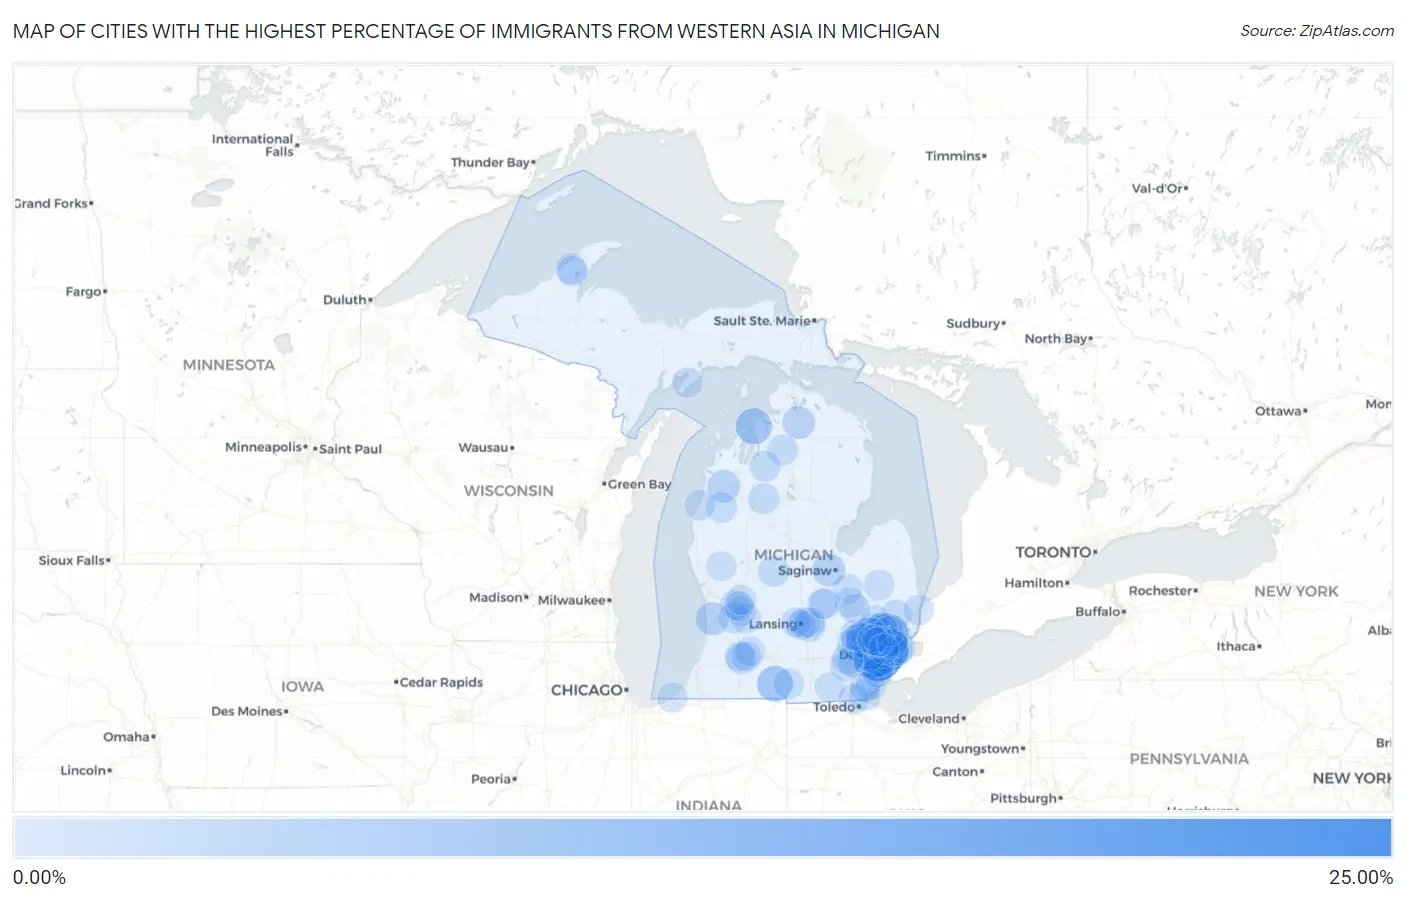
Map of Cities with the Highest Percentage of Immigrants from Western Asia in Michigan
0.00%
25.00%
Cities with the Highest Percentage of Immigrants from Western Asia in Michigan
| City | Western Asia | vs State | vs National | |
| 1. | Dearborn | 23.31% | 1.24%(+22.1)#-1 | 0.36%(+22.9)#0 |
| 2. | Hamtramck | 17.55% | 1.24%(+16.3)#0 | 0.36%(+17.2)#1 |
| 3. | Dearborn Heights | 16.05% | 1.24%(+14.8)#1 | 0.36%(+15.7)#2 |
| 4. | Sterling Heights | 14.54% | 1.24%(+13.3)#2 | 0.36%(+14.2)#3 |
| 5. | Melvindale | 8.77% | 1.24%(+7.52)#3 | 0.36%(+8.40)#4 |
| 6. | Norwood | 7.05% | 1.24%(+5.81)#4 | 0.36%(+6.69)#5 |
| 7. | Coldwater | 6.88% | 1.24%(+5.64)#5 | 0.36%(+6.52)#6 |
| 8. | Orchard Lake Village | 5.76% | 1.24%(+4.52)#6 | 0.36%(+5.40)#7 |
| 9. | Walled Lake | 5.12% | 1.24%(+3.88)#7 | 0.36%(+4.76)#8 |
| 10. | Madison Heights | 4.79% | 1.24%(+3.55)#8 | 0.36%(+4.43)#9 |
| 11. | Wixom | 4.10% | 1.24%(+2.86)#9 | 0.36%(+3.74)#10 |
| 12. | Farmington Hills | 4.03% | 1.24%(+2.79)#10 | 0.36%(+3.67)#11 |
| 13. | Beechwood | 4.00% | 1.24%(+2.75)#11 | 0.36%(+3.63)#12 |
| 14. | Bloomfield Hills | 3.70% | 1.24%(+2.46)#12 | 0.36%(+3.34)#13 |
| 15. | Shields | 3.41% | 1.24%(+2.17)#13 | 0.36%(+3.05)#14 |
| 16. | Warren | 3.40% | 1.24%(+2.16)#14 | 0.36%(+3.04)#15 |
| 17. | Copemish | 3.14% | 1.24%(+1.90)#15 | 0.36%(+2.78)#16 |
| 18. | Troy | 3.10% | 1.24%(+1.86)#16 | 0.36%(+2.74)#17 |
| 19. | Oak Park | 3.01% | 1.24%(+1.77)#17 | 0.36%(+2.65)#18 |
| 20. | Wolverine | 2.93% | 1.24%(+1.68)#18 | 0.36%(+2.56)#19 |
| 21. | Hazel Park | 2.66% | 1.24%(+1.42)#19 | 0.36%(+2.30)#20 |
| 22. | Ypsilanti | 2.42% | 1.24%(+1.17)#20 | 0.36%(+2.05)#21 |
| 23. | Southfield | 1.76% | 1.24%(+0.520)#21 | 0.36%(+1.40)#22 |
| 24. | Taylor | 1.72% | 1.24%(+0.476)#22 | 0.36%(+1.36)#23 |
| 25. | Luna Pier | 1.71% | 1.24%(+0.471)#23 | 0.36%(+1.35)#24 |
| 26. | South Lyon | 1.65% | 1.24%(+0.411)#24 | 0.36%(+1.29)#25 |
| 27. | Inkster | 1.65% | 1.24%(+0.406)#25 | 0.36%(+1.28)#26 |
| 28. | Garden City | 1.62% | 1.24%(+0.375)#26 | 0.36%(+1.25)#27 |
| 29. | Edmore | 1.56% | 1.24%(+0.317)#27 | 0.36%(+1.20)#28 |
| 30. | Village Of Grosse Pointe Shores | 1.53% | 1.24%(+0.290)#28 | 0.36%(+1.17)#29 |
| 31. | Ann Arbor | 1.49% | 1.24%(+0.250)#29 | 0.36%(+1.13)#30 |
| 32. | Okemos | 1.44% | 1.24%(+0.194)#30 | 0.36%(+1.07)#31 |
| 33. | Kalamazoo | 1.41% | 1.24%(+0.167)#31 | 0.36%(+1.05)#32 |
| 34. | Hancock | 1.37% | 1.24%(+0.127)#32 | 0.36%(+1.01)#33 |
| 35. | Wellston | 1.34% | 1.24%(+0.096)#33 | 0.36%(+0.976)#34 |
| 36. | Lake City | 1.28% | 1.24%(+0.039)#34 | 0.36%(+0.918)#35 |
| 37. | Lakes Of The North | 1.26% | 1.24%(+0.018)#35 | 0.36%(+0.897)#36 |
| 38. | Novi | 1.26% | 1.24%(+0.017)#36 | 0.36%(+0.896)#37 |
| 39. | Harper Woods | 1.25% | 1.24%(+0.006)#37 | 0.36%(+0.885)#38 |
| 40. | Fraser | 1.24% | 1.24%(-0.002)#38 | 0.36%(+0.877)#39 |
| 41. | Byron Center | 1.22% | 1.24%(-0.027)#39 | 0.36%(+0.853)#40 |
| 42. | Kalkaska | 1.21% | 1.24%(-0.033)#40 | 0.36%(+0.846)#41 |
| 43. | Livonia | 1.18% | 1.24%(-0.066)#41 | 0.36%(+0.813)#42 |
| 44. | Ida | 1.17% | 1.24%(-0.077)#42 | 0.36%(+0.803)#43 |
| 45. | Detroit | 1.14% | 1.24%(-0.102)#43 | 0.36%(+0.777)#44 |
| 46. | Middletown | 1.11% | 1.24%(-0.132)#44 | 0.36%(+0.747)#45 |
| 47. | Rochester Hills | 1.11% | 1.24%(-0.134)#45 | 0.36%(+0.745)#46 |
| 48. | Auburn Hills | 1.07% | 1.24%(-0.169)#46 | 0.36%(+0.710)#47 |
| 49. | Center Line | 1.04% | 1.24%(-0.207)#47 | 0.36%(+0.672)#48 |
| 50. | Armada | 1.03% | 1.24%(-0.213)#48 | 0.36%(+0.666)#49 |
| 51. | Grosse Pointe Farms | 1.02% | 1.24%(-0.225)#49 | 0.36%(+0.654)#50 |
| 52. | East Lansing | 1.02% | 1.24%(-0.225)#50 | 0.36%(+0.654)#51 |
| 53. | Westland | 0.98% | 1.24%(-0.260)#51 | 0.36%(+0.620)#52 |
| 54. | Allen | 0.94% | 1.24%(-0.304)#52 | 0.36%(+0.575)#53 |
| 55. | Lincoln Park | 0.92% | 1.24%(-0.324)#53 | 0.36%(+0.556)#54 |
| 56. | Manistee | 0.91% | 1.24%(-0.331)#54 | 0.36%(+0.549)#55 |
| 57. | North Branch | 0.90% | 1.24%(-0.342)#55 | 0.36%(+0.537)#56 |
| 58. | Haslett | 0.85% | 1.24%(-0.394)#56 | 0.36%(+0.485)#57 |
| 59. | Marysville | 0.80% | 1.24%(-0.441)#57 | 0.36%(+0.438)#58 |
| 60. | Bingham Farms | 0.80% | 1.24%(-0.442)#58 | 0.36%(+0.437)#59 |
| 61. | Woodland Beach | 0.77% | 1.24%(-0.473)#59 | 0.36%(+0.406)#60 |
| 62. | Lambertville | 0.71% | 1.24%(-0.532)#60 | 0.36%(+0.347)#61 |
| 63. | Rochester | 0.68% | 1.24%(-0.565)#61 | 0.36%(+0.314)#62 |
| 64. | Flint | 0.68% | 1.24%(-0.566)#62 | 0.36%(+0.313)#63 |
| 65. | Riverview | 0.66% | 1.24%(-0.581)#63 | 0.36%(+0.298)#64 |
| 66. | Lake Orion | 0.65% | 1.24%(-0.591)#64 | 0.36%(+0.288)#65 |
| 67. | Roseville | 0.64% | 1.24%(-0.603)#65 | 0.36%(+0.277)#66 |
| 68. | Berkley | 0.61% | 1.24%(-0.629)#66 | 0.36%(+0.250)#67 |
| 69. | Garden | 0.59% | 1.24%(-0.651)#67 | 0.36%(+0.228)#68 |
| 70. | Walker | 0.58% | 1.24%(-0.663)#68 | 0.36%(+0.216)#69 |
| 71. | Sylvan Lake | 0.58% | 1.24%(-0.665)#69 | 0.36%(+0.215)#70 |
| 72. | Owosso | 0.57% | 1.24%(-0.677)#70 | 0.36%(+0.202)#71 |
| 73. | Wolverine Lake | 0.56% | 1.24%(-0.687)#71 | 0.36%(+0.193)#72 |
| 74. | Caledonia | 0.55% | 1.24%(-0.690)#72 | 0.36%(+0.189)#73 |
| 75. | South Monroe | 0.54% | 1.24%(-0.702)#73 | 0.36%(+0.177)#74 |
| 76. | Adrian | 0.54% | 1.24%(-0.704)#74 | 0.36%(+0.175)#75 |
| 77. | Royal Oak | 0.52% | 1.24%(-0.723)#75 | 0.36%(+0.157)#76 |
| 78. | Richland | 0.51% | 1.24%(-0.732)#76 | 0.36%(+0.147)#77 |
| 79. | Milford | 0.49% | 1.24%(-0.749)#77 | 0.36%(+0.130)#78 |
| 80. | Birmingham | 0.49% | 1.24%(-0.755)#78 | 0.36%(+0.124)#79 |
| 81. | Gibraltar | 0.48% | 1.24%(-0.758)#79 | 0.36%(+0.121)#80 |
| 82. | Kentwood | 0.48% | 1.24%(-0.767)#80 | 0.36%(+0.112)#81 |
| 83. | Grosse Pointe Park | 0.46% | 1.24%(-0.783)#81 | 0.36%(+0.097)#82 |
| 84. | Houghton | 0.45% | 1.24%(-0.797)#82 | 0.36%(+0.082)#83 |
| 85. | Utica | 0.44% | 1.24%(-0.800)#83 | 0.36%(+0.079)#84 |
| 86. | Lansing | 0.43% | 1.24%(-0.810)#84 | 0.36%(+0.069)#85 |
| 87. | Waverly | 0.42% | 1.24%(-0.826)#85 | 0.36%(+0.054)#86 |
| 88. | Clio | 0.40% | 1.24%(-0.847)#86 | 0.36%(+0.032)#87 |
| 89. | Northview | 0.39% | 1.24%(-0.854)#87 | 0.36%(+0.025)#88 |
| 90. | Grand Blanc | 0.39% | 1.24%(-0.857)#88 | 0.36%(+0.022)#89 |
| 91. | Fremont | 0.38% | 1.24%(-0.866)#89 | 0.36%(+0.013)#90 |
| 92. | Lathrup Village | 0.37% | 1.24%(-0.875)#90 | 0.36%(+0.004)#91 |
| 93. | Saline | 0.37% | 1.24%(-0.875)#91 | 0.36%(+0.004)#92 |
| 94. | Eastpointe | 0.37% | 1.24%(-0.876)#92 | 0.36%(+0.003)#93 |
| 95. | Westwood | 0.37% | 1.24%(-0.877)#93 | 0.36%(+0.002)#94 |
| 96. | Michiana | 0.35% | 1.24%(-0.892)#94 | 0.36%(-0.013)#95 |
| 97. | Grand Rapids | 0.34% | 1.24%(-0.901)#95 | 0.36%(-0.022)#96 |
| 98. | Franklin | 0.34% | 1.24%(-0.904)#96 | 0.36%(-0.024)#97 |
| 99. | Highland Park | 0.33% | 1.24%(-0.911)#97 | 0.36%(-0.032)#98 |
| 100. | Comstock Northwest | 0.33% | 1.24%(-0.912)#98 | 0.36%(-0.032)#99 |
Common Questions
What are the Top 10 Cities with the Highest Percentage of Immigrants from Western Asia in Michigan?
Top 10 Cities with the Highest Percentage of Immigrants from Western Asia in Michigan are:
#1
23.31%
#2
17.55%
#3
16.05%
#4
14.54%
#5
8.77%
#6
7.05%
#7
6.88%
#8
5.76%
#9
5.12%
#10
4.79%
What city has the Highest Percentage of Immigrants from Western Asia in Michigan?
Dearborn has the Highest Percentage of Immigrants from Western Asia in Michigan with 23.31%.
What is the Percentage of Immigrants from Western Asia in the State of Michigan?
Percentage of Immigrants from Western Asia in Michigan is 1.24%.
What is the Percentage of Immigrants from Western Asia in the United States?
Percentage of Immigrants from Western Asia in the United States is 0.36%.