Cities with the Highest Percentage of Immigrants from Western Asia in Missouri
RELATED REPORTS & OPTIONS
Western Asia
Missouri
Compare Cities
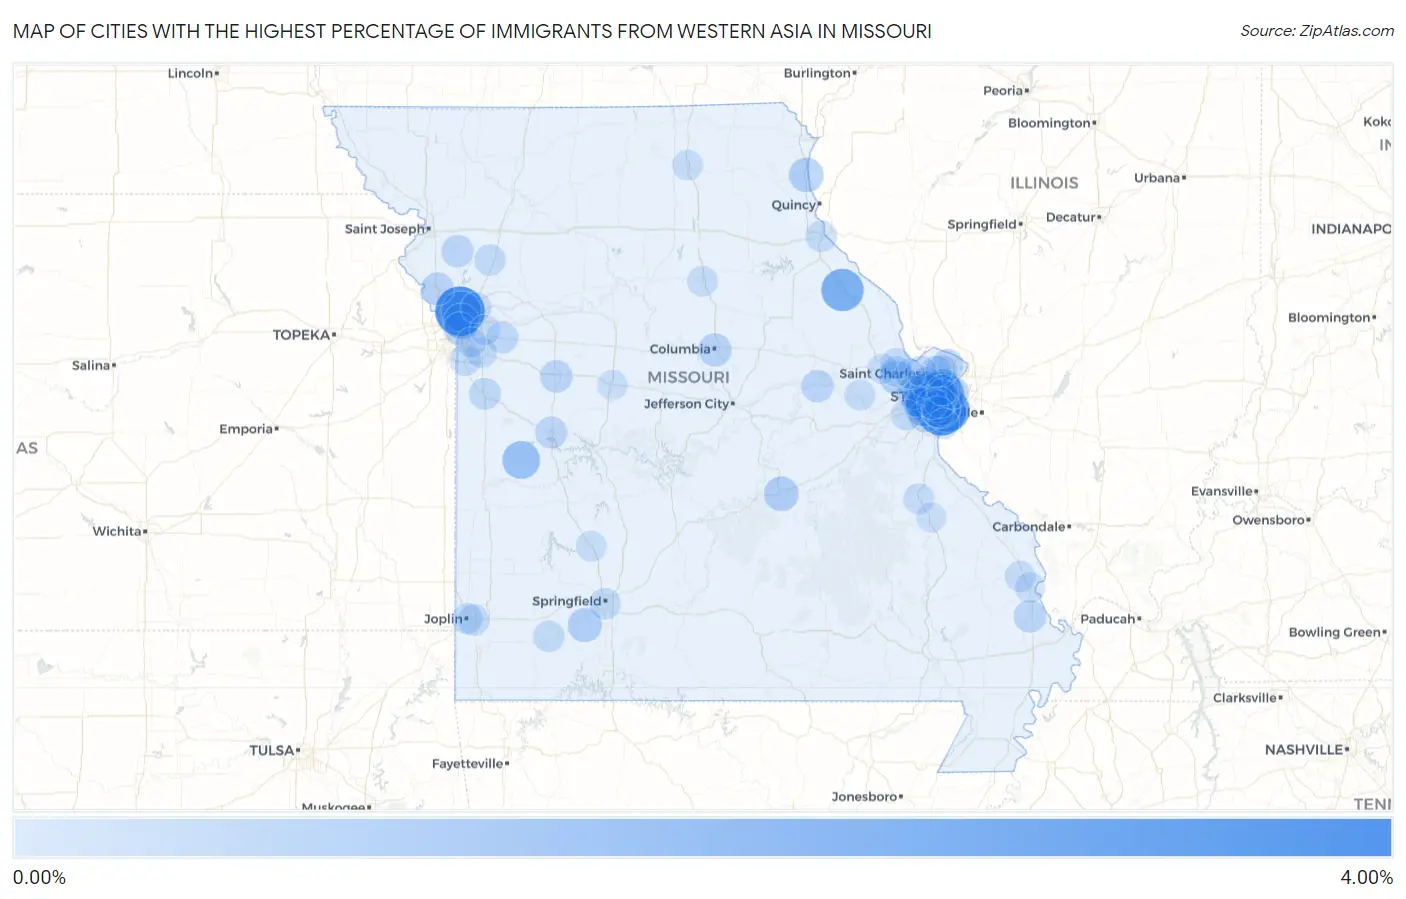
Map of Cities with the Highest Percentage of Immigrants from Western Asia in Missouri
0.00%
4.00%
Cities with the Highest Percentage of Immigrants from Western Asia in Missouri
| City | Western Asia | vs State | vs National | |
| 1. | Oakwood Park | 3.19% | 0.17%(+3.02)#-1 | 0.36%(+2.82)#0 |
| 2. | Green Park | 3.01% | 0.17%(+2.85)#0 | 0.36%(+2.65)#1 |
| 3. | Lemay | 2.30% | 0.17%(+2.13)#1 | 0.36%(+1.94)#2 |
| 4. | Clayton | 2.10% | 0.17%(+1.94)#2 | 0.36%(+1.74)#3 |
| 5. | Town And Country | 2.01% | 0.17%(+1.85)#3 | 0.36%(+1.65)#4 |
| 6. | Bowling Green | 1.98% | 0.17%(+1.81)#4 | 0.36%(+1.61)#5 |
| 7. | Westwood | 1.94% | 0.17%(+1.77)#5 | 0.36%(+1.58)#6 |
| 8. | Gladstone | 1.59% | 0.17%(+1.42)#6 | 0.36%(+1.22)#7 |
| 9. | Rock Hill | 1.35% | 0.17%(+1.19)#7 | 0.36%(+0.990)#8 |
| 10. | Lakeshire | 1.34% | 0.17%(+1.17)#8 | 0.36%(+0.972)#9 |
| 11. | Des Peres | 1.21% | 0.17%(+1.05)#9 | 0.36%(+0.851)#10 |
| 12. | Appleton City | 1.20% | 0.17%(+1.04)#10 | 0.36%(+0.839)#11 |
| 13. | Valley Park | 1.15% | 0.17%(+0.987)#11 | 0.36%(+0.790)#12 |
| 14. | Hanley Hills | 1.05% | 0.17%(+0.888)#12 | 0.36%(+0.691)#13 |
| 15. | Tarsney Lakes | 0.97% | 0.17%(+0.804)#13 | 0.36%(+0.607)#14 |
| 16. | Ladue | 0.87% | 0.17%(+0.706)#14 | 0.36%(+0.509)#15 |
| 17. | Affton | 0.87% | 0.17%(+0.702)#15 | 0.36%(+0.505)#16 |
| 18. | North Kansas City | 0.86% | 0.17%(+0.690)#16 | 0.36%(+0.493)#17 |
| 19. | Olivette | 0.72% | 0.17%(+0.557)#17 | 0.36%(+0.360)#18 |
| 20. | Rolla | 0.71% | 0.17%(+0.547)#18 | 0.36%(+0.350)#19 |
| 21. | Canton | 0.70% | 0.17%(+0.528)#19 | 0.36%(+0.332)#20 |
| 22. | Clever | 0.65% | 0.17%(+0.483)#20 | 0.36%(+0.286)#21 |
| 23. | Manchester | 0.58% | 0.17%(+0.414)#21 | 0.36%(+0.217)#22 |
| 24. | Dardenne Prairie | 0.56% | 0.17%(+0.391)#22 | 0.36%(+0.194)#23 |
| 25. | Columbia | 0.49% | 0.17%(+0.324)#23 | 0.36%(+0.127)#24 |
| 26. | Twin Oaks | 0.48% | 0.17%(+0.318)#24 | 0.36%(+0.121)#25 |
| 27. | Chesterfield | 0.48% | 0.17%(+0.315)#25 | 0.36%(+0.118)#26 |
| 28. | Kansas City | 0.47% | 0.17%(+0.308)#26 | 0.36%(+0.111)#27 |
| 29. | Platte City | 0.42% | 0.17%(+0.252)#27 | 0.36%(+0.055)#28 |
| 30. | St Louis | 0.40% | 0.17%(+0.233)#28 | 0.36%(+0.036)#29 |
| 31. | Warrensburg | 0.39% | 0.17%(+0.221)#29 | 0.36%(+0.025)#30 |
| 32. | Benton | 0.38% | 0.17%(+0.216)#30 | 0.36%(+0.019)#31 |
| 33. | Hermann | 0.38% | 0.17%(+0.212)#31 | 0.36%(+0.015)#32 |
| 34. | Gower | 0.35% | 0.17%(+0.182)#32 | 0.36%(-0.014)#33 |
| 35. | Clinton | 0.31% | 0.17%(+0.148)#33 | 0.36%(-0.049)#34 |
| 36. | Florissant | 0.31% | 0.17%(+0.144)#34 | 0.36%(-0.053)#35 |
| 37. | Old Jamestown | 0.30% | 0.17%(+0.132)#35 | 0.36%(-0.064)#36 |
| 38. | Murphy | 0.30% | 0.17%(+0.130)#36 | 0.36%(-0.067)#37 |
| 39. | Grain Valley | 0.25% | 0.17%(+0.088)#37 | 0.36%(-0.109)#38 |
| 40. | Harrisonville | 0.25% | 0.17%(+0.083)#38 | 0.36%(-0.114)#39 |
| 41. | Creve Coeur | 0.24% | 0.17%(+0.074)#39 | 0.36%(-0.123)#40 |
| 42. | Richmond Heights | 0.24% | 0.17%(+0.073)#40 | 0.36%(-0.124)#41 |
| 43. | Crestwood | 0.24% | 0.17%(+0.069)#41 | 0.36%(-0.128)#42 |
| 44. | Grandview | 0.23% | 0.17%(+0.061)#42 | 0.36%(-0.136)#43 |
| 45. | Sappington | 0.23% | 0.17%(+0.060)#43 | 0.36%(-0.136)#44 |
| 46. | Duquesne | 0.22% | 0.17%(+0.051)#44 | 0.36%(-0.146)#45 |
| 47. | Hannibal | 0.21% | 0.17%(+0.045)#45 | 0.36%(-0.152)#46 |
| 48. | Verona | 0.21% | 0.17%(+0.042)#46 | 0.36%(-0.154)#47 |
| 49. | Springfield | 0.21% | 0.17%(+0.039)#47 | 0.36%(-0.158)#48 |
| 50. | Lee S Summit | 0.20% | 0.17%(+0.030)#48 | 0.36%(-0.167)#49 |
| 51. | Lathrop | 0.20% | 0.17%(+0.030)#49 | 0.36%(-0.167)#50 |
| 52. | Ballwin | 0.19% | 0.17%(+0.024)#50 | 0.36%(-0.173)#51 |
| 53. | Concord | 0.18% | 0.17%(+0.011)#51 | 0.36%(-0.186)#52 |
| 54. | Maryland Heights | 0.17% | 0.17%(+0.000)#52 | 0.36%(-0.196)#53 |
| 55. | St Paul | 0.16% | 0.17%(-0.008)#53 | 0.36%(-0.205)#54 |
| 56. | Hazelwood | 0.15% | 0.17%(-0.021)#54 | 0.36%(-0.218)#55 |
| 57. | Joplin | 0.14% | 0.17%(-0.024)#55 | 0.36%(-0.221)#56 |
| 58. | O Fallon | 0.14% | 0.17%(-0.031)#56 | 0.36%(-0.228)#57 |
| 59. | Jackson | 0.12% | 0.17%(-0.043)#57 | 0.36%(-0.240)#58 |
| 60. | Liberty | 0.12% | 0.17%(-0.048)#58 | 0.36%(-0.245)#59 |
| 61. | Bonne Terre | 0.12% | 0.17%(-0.050)#59 | 0.36%(-0.247)#60 |
| 62. | Marthasville | 0.11% | 0.17%(-0.052)#60 | 0.36%(-0.249)#61 |
| 63. | Webster Groves | 0.11% | 0.17%(-0.054)#61 | 0.36%(-0.250)#62 |
| 64. | St Charles | 0.11% | 0.17%(-0.059)#62 | 0.36%(-0.256)#63 |
| 65. | Eureka | 0.100% | 0.17%(-0.067)#63 | 0.36%(-0.264)#64 |
| 66. | Moberly | 0.095% | 0.17%(-0.072)#64 | 0.36%(-0.269)#65 |
| 67. | Bolivar | 0.093% | 0.17%(-0.074)#65 | 0.36%(-0.271)#66 |
| 68. | Kirkwood | 0.092% | 0.17%(-0.075)#66 | 0.36%(-0.272)#67 |
| 69. | Oakville | 0.088% | 0.17%(-0.079)#67 | 0.36%(-0.276)#68 |
| 70. | University City | 0.086% | 0.17%(-0.081)#68 | 0.36%(-0.278)#69 |
| 71. | Kirksville | 0.086% | 0.17%(-0.081)#69 | 0.36%(-0.278)#70 |
| 72. | Cape Girardeau | 0.073% | 0.17%(-0.094)#70 | 0.36%(-0.291)#71 |
| 73. | Independence | 0.052% | 0.17%(-0.115)#71 | 0.36%(-0.312)#72 |
| 74. | Wentzville | 0.043% | 0.17%(-0.124)#72 | 0.36%(-0.321)#73 |
| 75. | Sedalia | 0.037% | 0.17%(-0.130)#73 | 0.36%(-0.327)#74 |
| 76. | St Peters | 0.028% | 0.17%(-0.139)#74 | 0.36%(-0.336)#75 |
| 77. | Farmington | 0.017% | 0.17%(-0.150)#75 | 0.36%(-0.347)#76 |
| 78. | Raytown | 0.010% | 0.17%(-0.157)#76 | 0.36%(-0.354)#77 |
Common Questions
What are the Top 10 Cities with the Highest Percentage of Immigrants from Western Asia in Missouri?
Top 10 Cities with the Highest Percentage of Immigrants from Western Asia in Missouri are:
#1
3.19%
#2
3.01%
#3
2.30%
#4
2.10%
#5
2.01%
#6
1.98%
#7
1.94%
#8
1.59%
#9
1.35%
#10
1.34%
What city has the Highest Percentage of Immigrants from Western Asia in Missouri?
Oakwood Park has the Highest Percentage of Immigrants from Western Asia in Missouri with 3.19%.
What is the Percentage of Immigrants from Western Asia in the State of Missouri?
Percentage of Immigrants from Western Asia in Missouri is 0.17%.
What is the Percentage of Immigrants from Western Asia in the United States?
Percentage of Immigrants from Western Asia in the United States is 0.36%.