Cities with the Highest Percentage of Immigrants from Western Asia in Oregon
RELATED REPORTS & OPTIONS
Western Asia
Oregon
Compare Cities
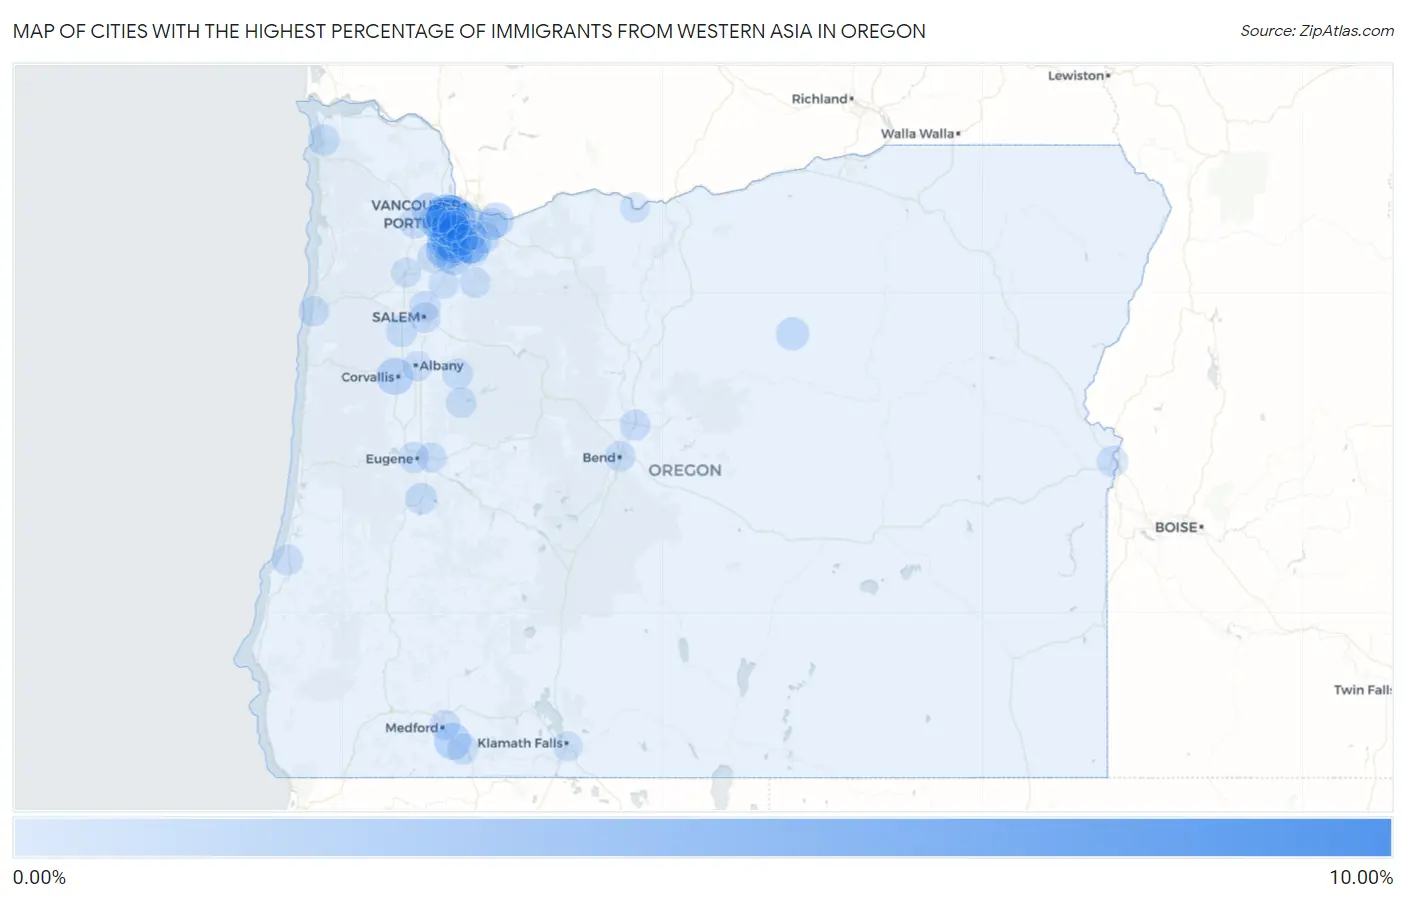
Map of Cities with the Highest Percentage of Immigrants from Western Asia in Oregon
0.00%
10.00%
Cities with the Highest Percentage of Immigrants from Western Asia in Oregon
| City | Western Asia | vs State | vs National | |
| 1. | Orient | 8.66% | 0.27%(+8.40)#-1 | 0.36%(+8.30)#0 |
| 2. | Cedar Mill | 3.04% | 0.27%(+2.77)#0 | 0.36%(+2.68)#1 |
| 3. | Bethany | 2.19% | 0.27%(+1.92)#1 | 0.36%(+1.82)#2 |
| 4. | Oak Hills | 1.99% | 0.27%(+1.73)#2 | 0.36%(+1.63)#3 |
| 5. | Durham | 1.99% | 0.27%(+1.72)#3 | 0.36%(+1.63)#4 |
| 6. | Bull Mountain | 1.65% | 0.27%(+1.39)#4 | 0.36%(+1.29)#5 |
| 7. | Sherwood | 1.64% | 0.27%(+1.38)#5 | 0.36%(+1.28)#6 |
| 8. | Tigard | 1.44% | 0.27%(+1.17)#6 | 0.36%(+1.07)#7 |
| 9. | Jennings Lodge | 1.42% | 0.27%(+1.16)#7 | 0.36%(+1.06)#8 |
| 10. | Wilsonville | 1.15% | 0.27%(+0.888)#8 | 0.36%(+0.791)#9 |
| 11. | Corvallis | 1.11% | 0.27%(+0.848)#9 | 0.36%(+0.750)#10 |
| 12. | Talent | 1.05% | 0.27%(+0.789)#10 | 0.36%(+0.691)#11 |
| 13. | Metzger | 0.99% | 0.27%(+0.726)#11 | 0.36%(+0.628)#12 |
| 14. | Aloha | 0.95% | 0.27%(+0.685)#12 | 0.36%(+0.587)#13 |
| 15. | Cedar Hills | 0.86% | 0.27%(+0.594)#13 | 0.36%(+0.496)#14 |
| 16. | Troutdale | 0.77% | 0.27%(+0.502)#14 | 0.36%(+0.404)#15 |
| 17. | Beaverton | 0.72% | 0.27%(+0.456)#15 | 0.36%(+0.358)#48 |
| 18. | North Plains | 0.65% | 0.27%(+0.388)#16 | 0.36%(+0.290)#49 |
| 19. | Tualatin | 0.59% | 0.27%(+0.320)#17 | 0.36%(+0.223)#50 |
| 20. | Garden Home Whitford | 0.52% | 0.27%(+0.256)#18 | 0.36%(+0.158)#51 |
| 21. | Spray | 0.50% | 0.27%(+0.237)#19 | 0.36%(+0.139)#52 |
| 22. | Hillsboro | 0.45% | 0.27%(+0.182)#20 | 0.36%(+0.084)#53 |
| 23. | West Linn | 0.43% | 0.27%(+0.161)#21 | 0.36%(+0.063)#54 |
| 24. | Portland | 0.40% | 0.27%(+0.137)#22 | 0.36%(+0.039)#55 |
| 25. | West Haven Sylvan | 0.35% | 0.27%(+0.080)#23 | 0.36%(-0.017)#56 |
| 26. | Happy Valley | 0.33% | 0.27%(+0.066)#24 | 0.36%(-0.031)#57 |
| 27. | Forest Grove | 0.31% | 0.27%(+0.048)#25 | 0.36%(-0.050)#58 |
| 28. | Gresham | 0.30% | 0.27%(+0.036)#26 | 0.36%(-0.062)#59 |
| 29. | Monmouth | 0.26% | 0.27%(-0.004)#27 | 0.36%(-0.101)#60 |
| 30. | Gearhart | 0.24% | 0.27%(-0.023)#28 | 0.36%(-0.121)#61 |
| 31. | Cottage Grove | 0.24% | 0.27%(-0.030)#29 | 0.36%(-0.127)#62 |
| 32. | Lake Oswego | 0.23% | 0.27%(-0.036)#30 | 0.36%(-0.134)#63 |
| 33. | Marlene | 0.23% | 0.27%(-0.039)#31 | 0.36%(-0.137)#64 |
| 34. | Ashland | 0.21% | 0.27%(-0.056)#32 | 0.36%(-0.153)#65 |
| 35. | Keizer | 0.19% | 0.27%(-0.072)#33 | 0.36%(-0.169)#66 |
| 36. | Ontario | 0.18% | 0.27%(-0.085)#34 | 0.36%(-0.183)#67 |
| 37. | Eugene | 0.16% | 0.27%(-0.101)#35 | 0.36%(-0.199)#68 |
| 38. | Molalla | 0.15% | 0.27%(-0.118)#36 | 0.36%(-0.216)#69 |
| 39. | Lacomb | 0.15% | 0.27%(-0.120)#37 | 0.36%(-0.218)#70 |
| 40. | Redmond | 0.14% | 0.27%(-0.128)#38 | 0.36%(-0.226)#71 |
| 41. | West Slope | 0.14% | 0.27%(-0.131)#39 | 0.36%(-0.229)#72 |
| 42. | North Bend | 0.13% | 0.27%(-0.139)#40 | 0.36%(-0.237)#73 |
| 43. | Salem | 0.13% | 0.27%(-0.140)#41 | 0.36%(-0.237)#74 |
| 44. | Lincoln City | 0.10% | 0.27%(-0.164)#42 | 0.36%(-0.262)#75 |
| 45. | Bend | 0.10% | 0.27%(-0.164)#43 | 0.36%(-0.262)#76 |
| 46. | Rockcreek | 0.10% | 0.27%(-0.165)#44 | 0.36%(-0.263)#77 |
| 47. | Medford | 0.090% | 0.27%(-0.176)#45 | 0.36%(-0.274)#78 |
| 48. | Newberg | 0.083% | 0.27%(-0.183)#46 | 0.36%(-0.281)#79 |
| 49. | Sweet Home | 0.081% | 0.27%(-0.185)#47 | 0.36%(-0.282)#80 |
| 50. | Milwaukie | 0.071% | 0.27%(-0.195)#48 | 0.36%(-0.293)#81 |
| 51. | Woodburn | 0.061% | 0.27%(-0.205)#49 | 0.36%(-0.303)#82 |
| 52. | Albany | 0.059% | 0.27%(-0.207)#50 | 0.36%(-0.305)#83 |
| 53. | Oregon City | 0.043% | 0.27%(-0.223)#51 | 0.36%(-0.321)#84 |
| 54. | Mcminnville | 0.035% | 0.27%(-0.231)#52 | 0.36%(-0.329)#85 |
| 55. | Klamath Falls | 0.018% | 0.27%(-0.248)#53 | 0.36%(-0.345)#86 |
| 56. | Springfield | 0.015% | 0.27%(-0.251)#54 | 0.36%(-0.349)#87 |
| 57. | The Dalles | 0.0063% | 0.27%(-0.260)#55 | 0.36%(-0.357)#88 |
Common Questions
What are the Top 10 Cities with the Highest Percentage of Immigrants from Western Asia in Oregon?
Top 10 Cities with the Highest Percentage of Immigrants from Western Asia in Oregon are:
#1
3.04%
#2
2.19%
#3
1.99%
#4
1.99%
#5
1.65%
#6
1.64%
#7
1.44%
#8
1.42%
#9
1.15%
#10
1.11%
What city has the Highest Percentage of Immigrants from Western Asia in Oregon?
Cedar Mill has the Highest Percentage of Immigrants from Western Asia in Oregon with 3.04%.
What is the Percentage of Immigrants from Western Asia in the State of Oregon?
Percentage of Immigrants from Western Asia in Oregon is 0.27%.
What is the Percentage of Immigrants from Western Asia in the United States?
Percentage of Immigrants from Western Asia in the United States is 0.36%.