Cities with the Highest Percentage of Immigrants from Central America in Pennsylvania
RELATED REPORTS & OPTIONS
Central America
Pennsylvania
Compare Cities
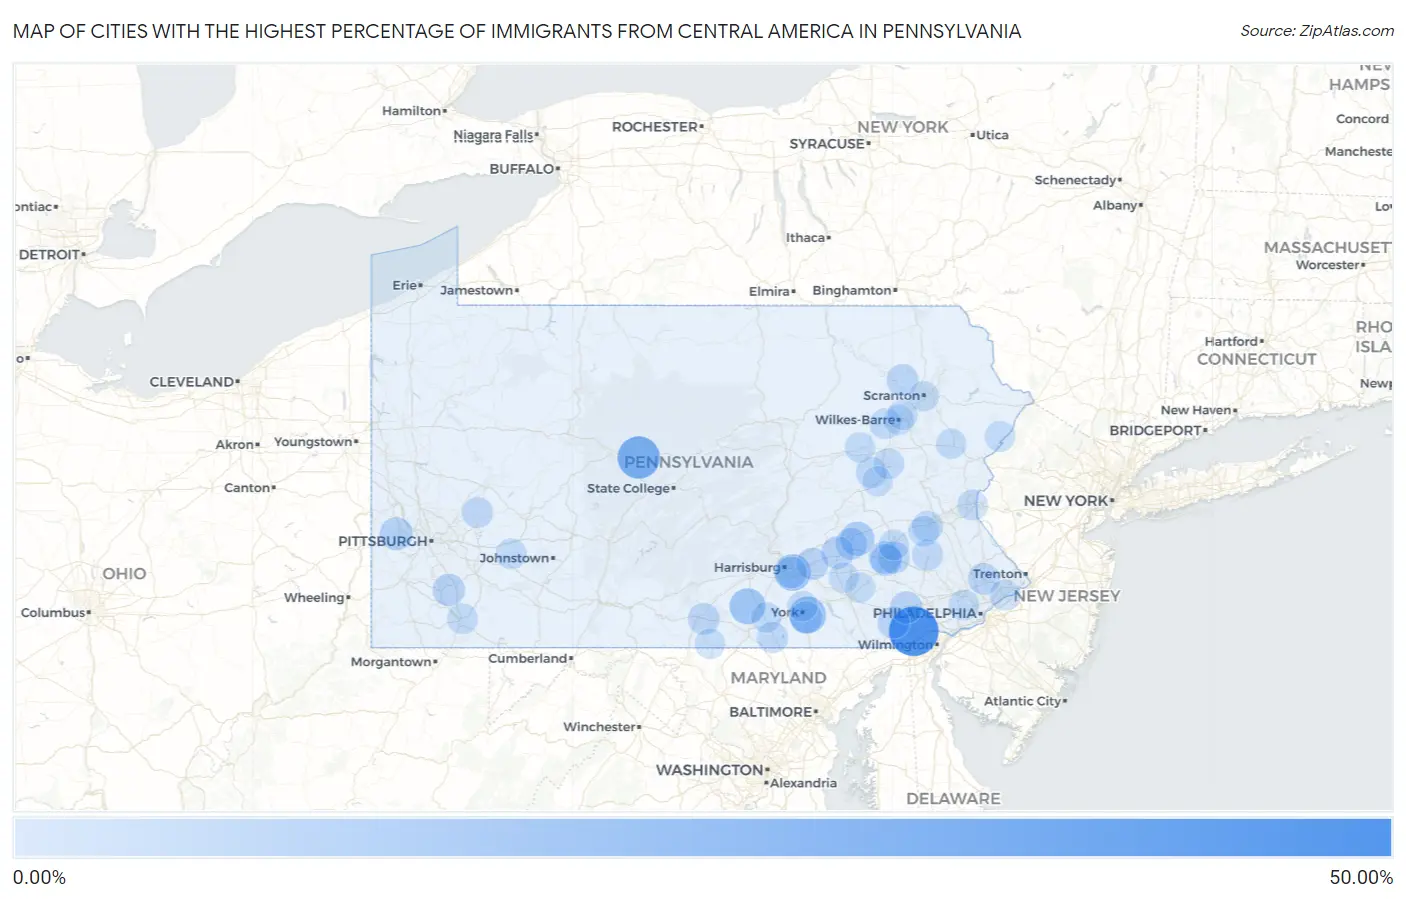
Map of Cities with the Highest Percentage of Immigrants from Central America in Pennsylvania
0.00%
50.00%
Cities with the Highest Percentage of Immigrants from Central America in Pennsylvania
| City | Central America | vs State | vs National | |
| 1. | Toughkenamon | 46.11% | 0.70%(+45.4)#-1 | 4.37%(+41.7)#0 |
| 2. | Avondale Borough | 45.65% | 0.70%(+44.9)#0 | 4.37%(+41.3)#1 |
| 3. | Kylertown | 29.15% | 0.70%(+28.4)#1 | 4.37%(+24.8)#2 |
| 4. | York Springs Borough | 24.08% | 0.70%(+23.4)#2 | 4.37%(+19.7)#3 |
| 5. | Kennett Square Borough | 20.29% | 0.70%(+19.6)#3 | 4.37%(+15.9)#4 |
| 6. | Gratz Borough | 18.59% | 0.70%(+17.9)#4 | 4.37%(+14.2)#5 |
| 7. | Queens Gate | 16.84% | 0.70%(+16.1)#5 | 4.37%(+12.5)#6 |
| 8. | Bressler | 16.13% | 0.70%(+15.4)#6 | 4.37%(+11.8)#7 |
| 9. | Gardners | 14.43% | 0.70%(+13.7)#7 | 4.37%(+10.1)#8 |
| 10. | Oxford Borough | 13.61% | 0.70%(+12.9)#8 | 4.37%(+9.24)#9 |
| 11. | Mifflintown Borough | 12.98% | 0.70%(+12.3)#9 | 4.37%(+8.61)#10 |
| 12. | Nottingham | 12.95% | 0.70%(+12.2)#10 | 4.37%(+8.58)#11 |
| 13. | Bendersville Borough | 12.52% | 0.70%(+11.8)#11 | 4.37%(+8.15)#12 |
| 14. | Rehrersburg | 10.40% | 0.70%(+9.70)#12 | 4.37%(+6.03)#13 |
| 15. | West Grove Borough | 9.81% | 0.70%(+9.11)#13 | 4.37%(+5.44)#14 |
| 16. | Troy Borough | 9.36% | 0.70%(+8.66)#14 | 4.37%(+4.99)#15 |
| 17. | Mont Clare | 9.12% | 0.70%(+8.42)#15 | 4.37%(+4.75)#16 |
| 18. | Norristown Borough | 8.52% | 0.70%(+7.82)#16 | 4.37%(+4.15)#248 |
| 19. | Clinton | 8.33% | 0.70%(+7.63)#17 | 4.37%(+3.96)#249 |
| 20. | New Oxford Borough | 7.67% | 0.70%(+6.97)#18 | 4.37%(+3.30)#250 |
| 21. | Springmont | 7.23% | 0.70%(+6.53)#19 | 4.37%(+2.86)#251 |
| 22. | Sand Hill | 7.01% | 0.70%(+6.31)#20 | 4.37%(+2.64)#252 |
| 23. | Coatesville | 6.91% | 0.70%(+6.21)#21 | 4.37%(+2.54)#253 |
| 24. | Fairhope | 6.66% | 0.70%(+5.95)#22 | 4.37%(+2.29)#254 |
| 25. | Reading | 6.25% | 0.70%(+5.55)#23 | 4.37%(+1.88)#255 |
| 26. | Tyler Run | 6.23% | 0.70%(+5.53)#24 | 4.37%(+1.86)#256 |
| 27. | Mount Aetna | 5.98% | 0.70%(+5.28)#25 | 4.37%(+1.61)#257 |
| 28. | Chambersburg Borough | 5.95% | 0.70%(+5.24)#26 | 4.37%(+1.58)#258 |
| 29. | Cochranville | 5.94% | 0.70%(+5.24)#27 | 4.37%(+1.57)#259 |
| 30. | Souderton Borough | 5.93% | 0.70%(+5.23)#28 | 4.37%(+1.56)#260 |
| 31. | Cove Forge | 5.88% | 0.70%(+5.18)#29 | 4.37%(+1.51)#261 |
| 32. | Hershey | 5.81% | 0.70%(+5.11)#30 | 4.37%(+1.44)#262 |
| 33. | Lincoln Park | 5.74% | 0.70%(+5.04)#31 | 4.37%(+1.37)#263 |
| 34. | West Hazleton Borough | 5.69% | 0.70%(+4.99)#32 | 4.37%(+1.32)#264 |
| 35. | Lake Winola | 5.48% | 0.70%(+4.78)#33 | 4.37%(+1.11)#265 |
| 36. | Horsham | 5.36% | 0.70%(+4.66)#34 | 4.37%(+0.986)#266 |
| 37. | Laceyville Borough | 5.28% | 0.70%(+4.58)#35 | 4.37%(+0.907)#267 |
| 38. | Enhaut | 5.11% | 0.70%(+4.41)#36 | 4.37%(+0.742)#268 |
| 39. | Guilford | 5.11% | 0.70%(+4.41)#37 | 4.37%(+0.737)#269 |
| 40. | Quakertown Borough | 4.53% | 0.70%(+3.83)#38 | 4.37%(+0.163)#270 |
| 41. | Parkesburg Borough | 4.45% | 0.70%(+3.75)#39 | 4.37%(+0.078)#271 |
| 42. | Fountain Hill Borough | 4.38% | 0.70%(+3.68)#40 | 4.37%(+0.008)#272 |
| 43. | Pennville | 4.12% | 0.70%(+3.42)#41 | 4.37%(-0.251)#273 |
| 44. | West Homestead Borough | 4.06% | 0.70%(+3.36)#42 | 4.37%(-0.306)#274 |
| 45. | Moosic Borough | 4.05% | 0.70%(+3.35)#43 | 4.37%(-0.323)#275 |
| 46. | Biglerville Borough | 4.04% | 0.70%(+3.34)#44 | 4.37%(-0.330)#276 |
| 47. | Hyde Park | 3.99% | 0.70%(+3.29)#45 | 4.37%(-0.382)#277 |
| 48. | New Berlinville | 3.90% | 0.70%(+3.19)#46 | 4.37%(-0.475)#278 |
| 49. | Valley View Cdp York County | 3.85% | 0.70%(+3.15)#47 | 4.37%(-0.515)#279 |
| 50. | Shenandoah Borough | 3.66% | 0.70%(+2.96)#48 | 4.37%(-0.709)#280 |
| 51. | Cornwells Heights | 3.66% | 0.70%(+2.96)#49 | 4.37%(-0.711)#281 |
| 52. | Sheppton | 3.56% | 0.70%(+2.86)#50 | 4.37%(-0.806)#282 |
| 53. | Breinigsville | 3.54% | 0.70%(+2.84)#51 | 4.37%(-0.828)#283 |
| 54. | West Nanticoke | 3.41% | 0.70%(+2.71)#52 | 4.37%(-0.961)#284 |
| 55. | Delta Borough | 3.40% | 0.70%(+2.70)#53 | 4.37%(-0.970)#285 |
| 56. | Easton | 3.39% | 0.70%(+2.69)#54 | 4.37%(-0.980)#286 |
| 57. | Millwood | 3.36% | 0.70%(+2.66)#55 | 4.37%(-1.01)#287 |
| 58. | Hawley Borough | 3.33% | 0.70%(+2.63)#56 | 4.37%(-1.04)#288 |
| 59. | Bloomfield Borough | 3.21% | 0.70%(+2.51)#57 | 4.37%(-1.16)#289 |
| 60. | Hazleton | 3.15% | 0.70%(+2.45)#58 | 4.37%(-1.22)#290 |
| 61. | Mertztown | 3.15% | 0.70%(+2.45)#59 | 4.37%(-1.22)#291 |
| 62. | Coal Center Borough | 3.12% | 0.70%(+2.42)#60 | 4.37%(-1.25)#292 |
| 63. | Oliver | 3.11% | 0.70%(+2.41)#61 | 4.37%(-1.26)#293 |
| 64. | Temple | 3.11% | 0.70%(+2.41)#62 | 4.37%(-1.26)#294 |
| 65. | Pine Ridge | 3.04% | 0.70%(+2.34)#63 | 4.37%(-1.33)#295 |
| 66. | Hampton | 2.94% | 0.70%(+2.24)#64 | 4.37%(-1.43)#296 |
| 67. | Port Royal Borough | 2.88% | 0.70%(+2.18)#65 | 4.37%(-1.49)#297 |
| 68. | Briar Creek Borough | 2.88% | 0.70%(+2.18)#66 | 4.37%(-1.49)#298 |
| 69. | Haverford College | 2.87% | 0.70%(+2.17)#67 | 4.37%(-1.50)#299 |
| 70. | Collingdale Borough | 2.87% | 0.70%(+2.16)#68 | 4.37%(-1.50)#300 |
| 71. | Milford Borough | 2.83% | 0.70%(+2.13)#69 | 4.37%(-1.54)#301 |
| 72. | Bentleyville Borough | 2.74% | 0.70%(+2.04)#70 | 4.37%(-1.63)#302 |
| 73. | Hanover Borough | 2.73% | 0.70%(+2.03)#71 | 4.37%(-1.64)#303 |
| 74. | Emerald Lakes | 2.70% | 0.70%(+1.99)#72 | 4.37%(-1.67)#304 |
| 75. | Tamaqua Borough | 2.66% | 0.70%(+1.96)#73 | 4.37%(-1.71)#305 |
| 76. | Emigsville | 2.63% | 0.70%(+1.93)#74 | 4.37%(-1.74)#306 |
| 77. | Lehighton Borough | 2.61% | 0.70%(+1.91)#75 | 4.37%(-1.76)#307 |
| 78. | Frazer | 2.57% | 0.70%(+1.87)#76 | 4.37%(-1.80)#308 |
| 79. | Wayne | 2.57% | 0.70%(+1.87)#77 | 4.37%(-1.80)#309 |
| 80. | East Berwick | 2.46% | 0.70%(+1.76)#78 | 4.37%(-1.91)#310 |
| 81. | Gettysburg Borough | 2.44% | 0.70%(+1.74)#79 | 4.37%(-1.93)#311 |
| 82. | Wilkes Barre | 2.43% | 0.70%(+1.73)#80 | 4.37%(-1.94)#312 |
| 83. | Delano | 2.34% | 0.70%(+1.64)#81 | 4.37%(-2.03)#313 |
| 84. | New Paris Borough | 2.30% | 0.70%(+1.60)#82 | 4.37%(-2.07)#314 |
| 85. | Osceola Mills Borough | 2.30% | 0.70%(+1.60)#83 | 4.37%(-2.07)#315 |
| 86. | Manchester Borough | 2.25% | 0.70%(+1.55)#84 | 4.37%(-2.12)#316 |
| 87. | Bridgeport Borough | 2.24% | 0.70%(+1.54)#85 | 4.37%(-2.13)#317 |
| 88. | Arendtsville Borough | 2.24% | 0.70%(+1.54)#86 | 4.37%(-2.13)#318 |
| 89. | Penryn | 2.23% | 0.70%(+1.53)#87 | 4.37%(-2.14)#319 |
| 90. | Brownstown | 2.21% | 0.70%(+1.50)#88 | 4.37%(-2.16)#320 |
| 91. | Eagleville Cdp Montgomery County | 2.17% | 0.70%(+1.47)#89 | 4.37%(-2.20)#321 |
| 92. | North Catasauqua Borough | 2.13% | 0.70%(+1.43)#90 | 4.37%(-2.24)#322 |
| 93. | Wayne Heights | 2.10% | 0.70%(+1.40)#91 | 4.37%(-2.27)#323 |
| 94. | Scranton | 2.10% | 0.70%(+1.39)#92 | 4.37%(-2.27)#324 |
| 95. | Mount Pocono Borough | 2.07% | 0.70%(+1.37)#93 | 4.37%(-2.30)#325 |
| 96. | Bowmanstown Borough | 2.02% | 0.70%(+1.32)#94 | 4.37%(-2.35)#326 |
| 97. | Lansdale Borough | 2.01% | 0.70%(+1.31)#95 | 4.37%(-2.36)#327 |
| 98. | Delaware Water Gap Borough | 1.99% | 0.70%(+1.29)#96 | 4.37%(-2.38)#328 |
| 99. | Quarryville Borough | 1.98% | 0.70%(+1.28)#97 | 4.37%(-2.39)#329 |
| 100. | Plains | 1.95% | 0.70%(+1.25)#98 | 4.37%(-2.42)#330 |
Common Questions
What are the Top 10 Cities with the Highest Percentage of Immigrants from Central America in Pennsylvania?
Top 10 Cities with the Highest Percentage of Immigrants from Central America in Pennsylvania are:
#1
46.11%
#2
29.15%
#3
16.84%
#4
16.13%
#5
14.43%
#6
10.40%
#7
8.33%
#8
7.23%
#9
7.01%
#10
6.91%
What city has the Highest Percentage of Immigrants from Central America in Pennsylvania?
Toughkenamon has the Highest Percentage of Immigrants from Central America in Pennsylvania with 46.11%.
What is the Percentage of Immigrants from Central America in the State of Pennsylvania?
Percentage of Immigrants from Central America in Pennsylvania is 0.70%.
What is the Percentage of Immigrants from Central America in the United States?
Percentage of Immigrants from Central America in the United States is 4.37%.