Cities with the Highest Percentage of Immigrants from Central America in Delaware
RELATED REPORTS & OPTIONS
Central America
Delaware
Compare Cities
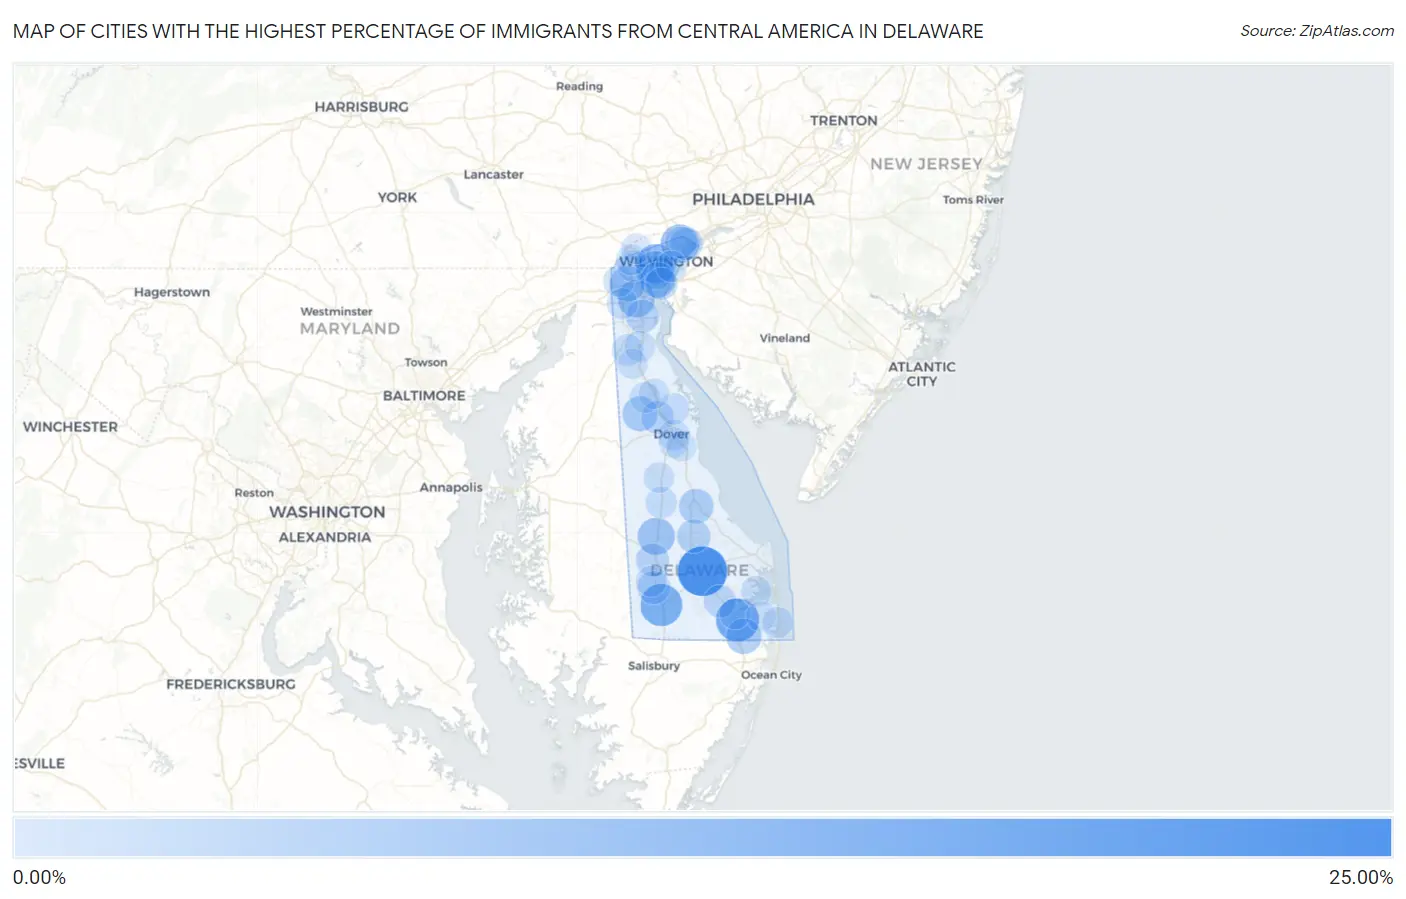
Map of Cities with the Highest Percentage of Immigrants from Central America in Delaware
0.00%
25.00%
Cities with the Highest Percentage of Immigrants from Central America in Delaware
| City | Central America | vs State | vs National | |
| 1. | Georgetown | 23.93% | 2.36%(+21.6)#-1 | 4.37%(+19.6)#0 |
| 2. | Frankford | 15.80% | 2.36%(+13.4)#0 | 4.37%(+11.4)#1 |
| 3. | Laurel | 14.67% | 2.36%(+12.3)#1 | 4.37%(+10.3)#2 |
| 4. | Elsmere | 11.24% | 2.36%(+8.88)#2 | 4.37%(+6.87)#3 |
| 5. | Ardencroft | 10.00% | 2.36%(+7.64)#3 | 4.37%(+5.63)#4 |
| 6. | Newport | 9.34% | 2.36%(+6.99)#4 | 4.37%(+4.97)#5 |
| 7. | Greenwood | 8.42% | 2.36%(+6.06)#5 | 4.37%(+4.05)#6 |
| 8. | Bear | 8.34% | 2.36%(+5.98)#6 | 4.37%(+3.97)#7 |
| 9. | Wilmington Manor | 6.65% | 2.36%(+4.29)#7 | 4.37%(+2.28)#8 |
| 10. | Brookside | 6.41% | 2.36%(+4.05)#8 | 4.37%(+2.04)#9 |
| 11. | Selbyville | 6.33% | 2.36%(+3.97)#9 | 4.37%(+1.96)#10 |
| 12. | Kenton | 6.00% | 2.36%(+3.64)#10 | 4.37%(+1.63)#11 |
| 13. | Milford | 5.40% | 2.36%(+3.04)#11 | 4.37%(+1.03)#12 |
| 14. | Ellendale | 3.94% | 2.36%(+1.58)#12 | 4.37%(-0.429)#13 |
| 15. | Bridgeville | 3.55% | 2.36%(+1.19)#13 | 4.37%(-0.818)#14 |
| 16. | St Georges | 3.45% | 2.36%(+1.09)#14 | 4.37%(-0.919)#15 |
| 17. | Blades | 3.44% | 2.36%(+1.08)#15 | 4.37%(-0.933)#16 |
| 18. | Lincoln | 3.34% | 2.36%(+0.976)#16 | 4.37%(-1.03)#17 |
| 19. | Cheswold | 3.05% | 2.36%(+0.691)#17 | 4.37%(-1.32)#18 |
| 20. | Claymont | 3.00% | 2.36%(+0.643)#18 | 4.37%(-1.37)#19 |
| 21. | Millsboro | 2.85% | 2.36%(+0.491)#19 | 4.37%(-1.52)#20 |
| 22. | New Castle | 2.35% | 2.36%(-0.006)#20 | 4.37%(-2.02)#21 |
| 23. | Ardentown | 1.79% | 2.36%(-0.566)#21 | 4.37%(-2.58)#22 |
| 24. | Middletown | 1.46% | 2.36%(-0.905)#22 | 4.37%(-2.91)#23 |
| 25. | Harrington | 1.33% | 2.36%(-1.03)#23 | 4.37%(-3.04)#24 |
| 26. | Wilmington | 1.32% | 2.36%(-1.04)#24 | 4.37%(-3.05)#25 |
| 27. | Leipsic | 1.17% | 2.36%(-1.19)#25 | 4.37%(-3.20)#26 |
| 28. | Dagsboro | 1.05% | 2.36%(-1.31)#26 | 4.37%(-3.32)#27 |
| 29. | Glasgow | 1.05% | 2.36%(-1.31)#27 | 4.37%(-3.32)#28 |
| 30. | Newark | 1.03% | 2.36%(-1.33)#28 | 4.37%(-3.34)#29 |
| 31. | South Bethany | 1.02% | 2.36%(-1.34)#29 | 4.37%(-3.35)#30 |
| 32. | Pike Creek Valley | 0.95% | 2.36%(-1.41)#30 | 4.37%(-3.42)#31 |
| 33. | Dover | 0.95% | 2.36%(-1.41)#31 | 4.37%(-3.42)#32 |
| 34. | Seaford | 0.84% | 2.36%(-1.52)#32 | 4.37%(-3.53)#33 |
| 35. | Odessa | 0.77% | 2.36%(-1.59)#33 | 4.37%(-3.60)#34 |
| 36. | Clayton | 0.68% | 2.36%(-1.68)#34 | 4.37%(-3.69)#35 |
| 37. | Felton | 0.62% | 2.36%(-1.74)#35 | 4.37%(-3.75)#36 |
| 38. | Pike Creek | 0.47% | 2.36%(-1.89)#36 | 4.37%(-3.90)#37 |
| 39. | Hockessin | 0.45% | 2.36%(-1.91)#37 | 4.37%(-3.92)#38 |
| 40. | Long Neck | 0.30% | 2.36%(-2.06)#38 | 4.37%(-4.07)#39 |
| 41. | Smyrna | 0.24% | 2.36%(-2.12)#39 | 4.37%(-4.13)#40 |
| 42. | Townsend | 0.22% | 2.36%(-2.14)#40 | 4.37%(-4.15)#41 |
| 43. | Millville | 0.19% | 2.36%(-2.16)#41 | 4.37%(-4.18)#42 |
| 44. | Kent Acres | 0.19% | 2.36%(-2.17)#42 | 4.37%(-4.18)#43 |
| 45. | Dover Base Housing | 0.12% | 2.36%(-2.24)#43 | 4.37%(-4.25)#44 |
1
Common Questions
What are the Top 10 Cities with the Highest Percentage of Immigrants from Central America in Delaware?
Top 10 Cities with the Highest Percentage of Immigrants from Central America in Delaware are:
#1
23.93%
#2
15.80%
#3
14.67%
#4
11.24%
#5
10.00%
#6
9.34%
#7
8.42%
#8
8.34%
#9
6.65%
#10
6.41%
What city has the Highest Percentage of Immigrants from Central America in Delaware?
Georgetown has the Highest Percentage of Immigrants from Central America in Delaware with 23.93%.
What is the Percentage of Immigrants from Central America in the State of Delaware?
Percentage of Immigrants from Central America in Delaware is 2.36%.
What is the Percentage of Immigrants from Central America in the United States?
Percentage of Immigrants from Central America in the United States is 4.37%.