Cities with the Highest Percentage of Population Employed in Professional & Scientific Services in Michigan
RELATED REPORTS & OPTIONS
Professional & Scientific Services
Michigan
Compare Cities
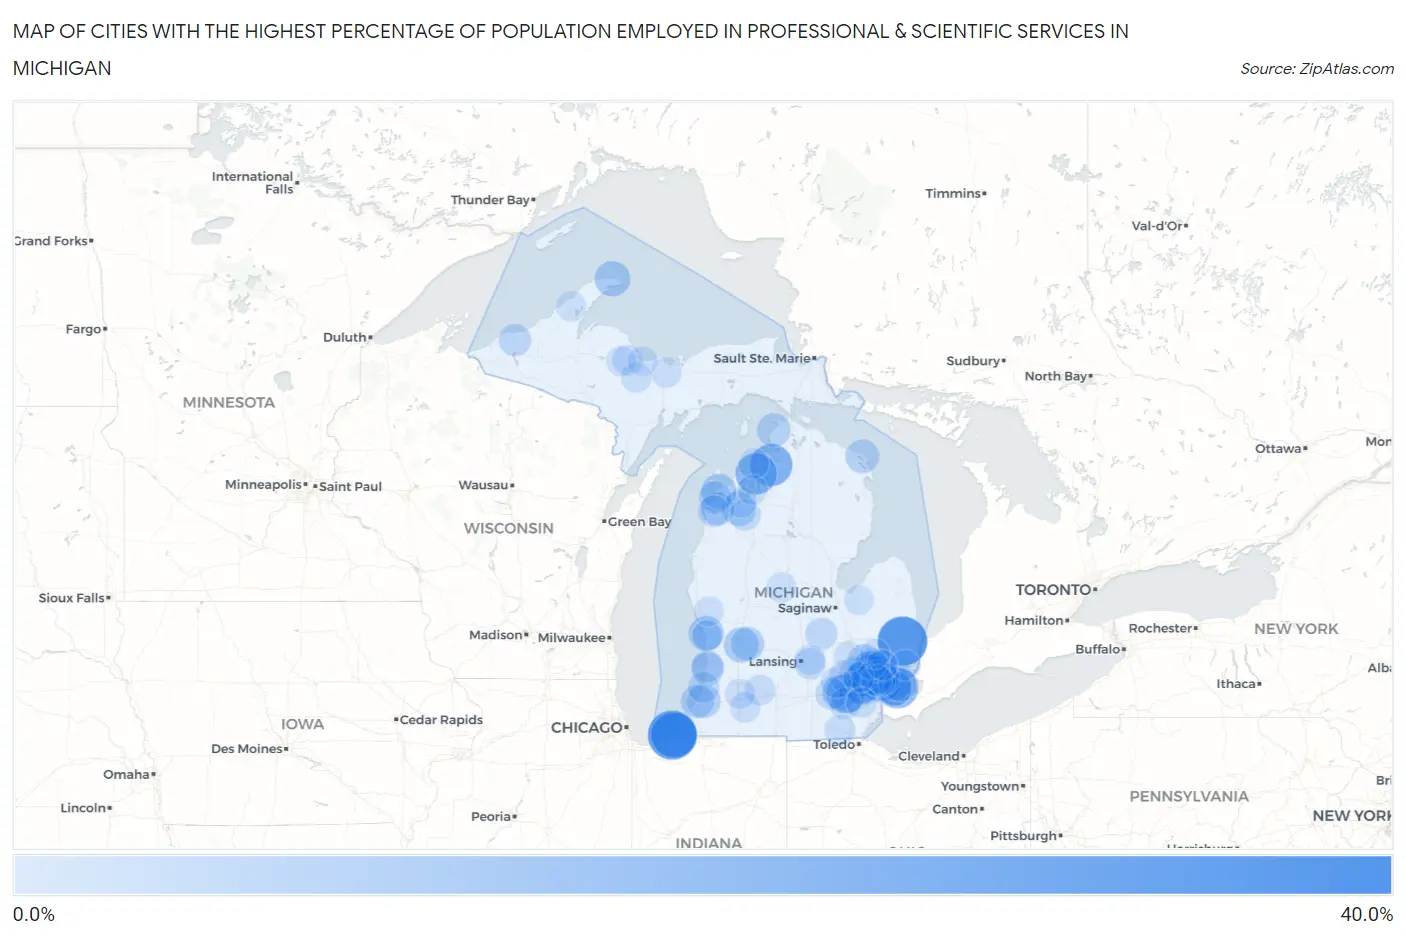
Map of Cities with the Highest Percentage of Population Employed in Professional & Scientific Services in Michigan
0.0%
40.0%
Cities with the Highest Percentage of Population Employed in Professional & Scientific Services in Michigan
| City | % Employed | vs State | vs National | |
| 1. | Trufant | 33.9% | 6.0%(+27.9)#1 | 7.8%(+26.0)#198 |
| 2. | Emmett | 31.5% | 6.0%(+25.5)#2 | 7.8%(+23.7)#247 |
| 3. | Michiana | 31.1% | 6.0%(+25.1)#3 | 7.8%(+23.3)#253 |
| 4. | Grand Beach | 26.9% | 6.0%(+20.9)#4 | 7.8%(+19.0)#385 |
| 5. | Bergland | 25.5% | 6.0%(+19.5)#5 | 7.8%(+17.7)#442 |
| 6. | Beverly Hills | 23.1% | 6.0%(+17.1)#6 | 7.8%(+15.3)#573 |
| 7. | Advance | 22.8% | 6.0%(+16.8)#7 | 7.8%(+14.9)#602 |
| 8. | Fulton | 22.2% | 6.0%(+16.2)#8 | 7.8%(+14.4)#649 |
| 9. | Grosse Pointe Farms | 22.1% | 6.0%(+16.1)#9 | 7.8%(+14.3)#658 |
| 10. | Pleasant Ridge | 21.7% | 6.0%(+15.7)#10 | 7.8%(+13.9)#691 |
| 11. | Eastport | 21.7% | 6.0%(+15.7)#11 | 7.8%(+13.9)#698 |
| 12. | Franklin | 20.8% | 6.0%(+14.8)#12 | 7.8%(+12.9)#806 |
| 13. | Barton Hills | 19.3% | 6.0%(+13.3)#13 | 7.8%(+11.4)#975 |
| 14. | Northville | 18.9% | 6.0%(+12.9)#14 | 7.8%(+11.1)#1,036 |
| 15. | Bloomfield Hills | 17.7% | 6.0%(+11.7)#15 | 7.8%(+9.84)#1,228 |
| 16. | Birmingham | 17.7% | 6.0%(+11.7)#16 | 7.8%(+9.82)#1,235 |
| 17. | Orchard Lake Village | 17.4% | 6.0%(+11.4)#17 | 7.8%(+9.60)#1,284 |
| 18. | Mears | 16.5% | 6.0%(+10.5)#18 | 7.8%(+8.69)#1,473 |
| 19. | Sylvan Lake | 16.5% | 6.0%(+10.5)#19 | 7.8%(+8.68)#1,479 |
| 20. | Huntington Woods | 15.5% | 6.0%(+9.45)#20 | 7.8%(+7.61)#1,744 |
| 21. | Royal Oak | 15.4% | 6.0%(+9.36)#21 | 7.8%(+7.52)#1,780 |
| 22. | Ferndale | 15.2% | 6.0%(+9.20)#22 | 7.8%(+7.36)#1,807 |
| 23. | Copper Harbor | 14.8% | 6.0%(+8.81)#23 | 7.8%(+6.97)#1,924 |
| 24. | Ferrysburg | 14.5% | 6.0%(+8.52)#24 | 7.8%(+6.67)#2,018 |
| 25. | Berkley | 14.2% | 6.0%(+8.18)#25 | 7.8%(+6.34)#2,113 |
| 26. | East Grand Rapids | 14.2% | 6.0%(+8.17)#26 | 7.8%(+6.33)#2,118 |
| 27. | Glen Arbor | 14.2% | 6.0%(+8.15)#27 | 7.8%(+6.31)#2,121 |
| 28. | Grosse Pointe Park | 14.1% | 6.0%(+8.13)#28 | 7.8%(+6.29)#2,133 |
| 29. | Farmington | 14.1% | 6.0%(+8.07)#29 | 7.8%(+6.23)#2,150 |
| 30. | Dexter | 14.0% | 6.0%(+8.00)#30 | 7.8%(+6.15)#2,177 |
| 31. | Troy | 13.6% | 6.0%(+7.63)#31 | 7.8%(+5.79)#2,292 |
| 32. | Village Of Clarkston | 13.2% | 6.0%(+7.24)#32 | 7.8%(+5.40)#2,448 |
| 33. | Chums Corner | 13.2% | 6.0%(+7.15)#33 | 7.8%(+5.31)#2,483 |
| 34. | Keego Harbor | 13.1% | 6.0%(+7.07)#34 | 7.8%(+5.23)#2,518 |
| 35. | Grosse Pointe | 13.1% | 6.0%(+7.05)#35 | 7.8%(+5.21)#2,524 |
| 36. | Bingham Farms | 12.8% | 6.0%(+6.80)#36 | 7.8%(+4.96)#2,616 |
| 37. | Presque Isle Harbor | 12.8% | 6.0%(+6.77)#37 | 7.8%(+4.93)#2,626 |
| 38. | Novi | 12.7% | 6.0%(+6.71)#38 | 7.8%(+4.87)#2,658 |
| 39. | Clawson | 12.7% | 6.0%(+6.69)#39 | 7.8%(+4.85)#2,674 |
| 40. | Paw Paw Lake | 12.7% | 6.0%(+6.67)#40 | 7.8%(+4.83)#2,680 |
| 41. | Forest Hills | 12.6% | 6.0%(+6.58)#41 | 7.8%(+4.74)#2,715 |
| 42. | Cross Village | 12.5% | 6.0%(+6.49)#42 | 7.8%(+4.65)#2,766 |
| 43. | Farmington Hills | 12.4% | 6.0%(+6.40)#43 | 7.8%(+4.56)#2,805 |
| 44. | Lake Michigan Beach | 12.3% | 6.0%(+6.29)#44 | 7.8%(+4.45)#2,857 |
| 45. | Plymouth | 12.1% | 6.0%(+6.08)#45 | 7.8%(+4.24)#2,964 |
| 46. | Honor | 12.1% | 6.0%(+6.06)#46 | 7.8%(+4.22)#2,969 |
| 47. | Grosse Pointe Woods | 12.0% | 6.0%(+6.04)#47 | 7.8%(+4.20)#2,976 |
| 48. | Village Of Grosse Pointe Shores | 11.8% | 6.0%(+5.82)#48 | 7.8%(+3.98)#3,099 |
| 49. | Douglas | 11.8% | 6.0%(+5.80)#49 | 7.8%(+3.96)#3,111 |
| 50. | Ann Arbor | 11.5% | 6.0%(+5.51)#50 | 7.8%(+3.67)#3,252 |
| 51. | Empire | 11.5% | 6.0%(+5.48)#51 | 7.8%(+3.64)#3,267 |
| 52. | Crystal | 11.4% | 6.0%(+5.38)#52 | 7.8%(+3.54)#3,312 |
| 53. | Millburg | 11.2% | 6.0%(+5.15)#53 | 7.8%(+3.30)#3,432 |
| 54. | White Pine | 11.0% | 6.0%(+5.01)#54 | 7.8%(+3.17)#3,502 |
| 55. | Hermansville | 10.9% | 6.0%(+4.88)#55 | 7.8%(+3.04)#3,588 |
| 56. | Rochester Hills | 10.7% | 6.0%(+4.73)#56 | 7.8%(+2.89)#3,687 |
| 57. | Madison Heights | 10.6% | 6.0%(+4.56)#57 | 7.8%(+2.72)#3,798 |
| 58. | Henderson | 10.6% | 6.0%(+4.55)#58 | 7.8%(+2.71)#3,801 |
| 59. | Auburn Hills | 10.5% | 6.0%(+4.54)#59 | 7.8%(+2.70)#3,816 |
| 60. | Oak Park | 10.4% | 6.0%(+4.39)#60 | 7.8%(+2.55)#3,909 |
| 61. | Brighton | 10.3% | 6.0%(+4.33)#61 | 7.8%(+2.49)#3,951 |
| 62. | Chelsea | 10.3% | 6.0%(+4.33)#62 | 7.8%(+2.49)#3,952 |
| 63. | Saugatuck | 10.3% | 6.0%(+4.32)#63 | 7.8%(+2.48)#3,962 |
| 64. | Beulah | 10.2% | 6.0%(+4.20)#64 | 7.8%(+2.36)#4,040 |
| 65. | South Haven | 10.1% | 6.0%(+4.09)#65 | 7.8%(+2.25)#4,106 |
| 66. | Milford | 10.0% | 6.0%(+4.03)#66 | 7.8%(+2.19)#4,129 |
| 67. | Kingsley | 10.0% | 6.0%(+4.01)#67 | 7.8%(+2.17)#4,145 |
| 68. | Lakeport | 9.9% | 6.0%(+3.89)#68 | 7.8%(+2.05)#4,221 |
| 69. | Okemos | 9.9% | 6.0%(+3.86)#69 | 7.8%(+2.02)#4,244 |
| 70. | Walled Lake | 9.8% | 6.0%(+3.76)#70 | 7.8%(+1.92)#4,321 |
| 71. | Lathrup Village | 9.7% | 6.0%(+3.66)#71 | 7.8%(+1.82)#4,391 |
| 72. | Saline | 9.6% | 6.0%(+3.63)#72 | 7.8%(+1.79)#4,418 |
| 73. | Lake Angelus | 9.6% | 6.0%(+3.62)#73 | 7.8%(+1.78)#4,424 |
| 74. | Lamont | 9.6% | 6.0%(+3.58)#74 | 7.8%(+1.74)#4,447 |
| 75. | Wixom | 9.3% | 6.0%(+3.24)#75 | 7.8%(+1.40)#4,739 |
| 76. | Belleville | 9.1% | 6.0%(+3.12)#76 | 7.8%(+1.28)#4,840 |
| 77. | Pinckney | 9.1% | 6.0%(+3.06)#77 | 7.8%(+1.22)#4,902 |
| 78. | Level Park Oak Park | 9.0% | 6.0%(+3.04)#78 | 7.8%(+1.20)#4,929 |
| 79. | Rochester | 9.0% | 6.0%(+3.02)#79 | 7.8%(+1.18)#4,937 |
| 80. | Blissfield | 9.0% | 6.0%(+2.98)#80 | 7.8%(+1.14)#4,966 |
| 81. | Traverse City | 8.9% | 6.0%(+2.93)#81 | 7.8%(+1.09)#5,019 |
| 82. | Norwood | 8.9% | 6.0%(+2.88)#82 | 7.8%(+1.04)#5,065 |
| 83. | Chatham | 8.9% | 6.0%(+2.88)#83 | 7.8%(+1.04)#5,067 |
| 84. | Vicksburg | 8.8% | 6.0%(+2.84)#84 | 7.8%(+1.00)#5,105 |
| 85. | Haslett | 8.8% | 6.0%(+2.83)#85 | 7.8%(+0.986)#5,119 |
| 86. | Negaunee | 8.7% | 6.0%(+2.72)#86 | 7.8%(+0.874)#5,217 |
| 87. | New Baltimore | 8.7% | 6.0%(+2.66)#87 | 7.8%(+0.819)#5,264 |
| 88. | Gwinn | 8.6% | 6.0%(+2.63)#88 | 7.8%(+0.792)#5,288 |
| 89. | Westwood | 8.6% | 6.0%(+2.59)#89 | 7.8%(+0.744)#5,331 |
| 90. | Grand Haven | 8.5% | 6.0%(+2.51)#90 | 7.8%(+0.669)#5,395 |
| 91. | Fenton | 8.5% | 6.0%(+2.49)#91 | 7.8%(+0.648)#5,407 |
| 92. | Hancock | 8.5% | 6.0%(+2.46)#92 | 7.8%(+0.622)#5,424 |
| 93. | West Ishpeming | 8.5% | 6.0%(+2.45)#93 | 7.8%(+0.610)#5,440 |
| 94. | Beal City | 8.4% | 6.0%(+2.43)#94 | 7.8%(+0.586)#5,458 |
| 95. | Spring Lake | 8.4% | 6.0%(+2.42)#95 | 7.8%(+0.579)#5,471 |
| 96. | Twin Lake | 8.4% | 6.0%(+2.40)#96 | 7.8%(+0.558)#5,499 |
| 97. | Harvey | 8.4% | 6.0%(+2.36)#97 | 7.8%(+0.520)#5,529 |
| 98. | Oxford | 8.4% | 6.0%(+2.35)#98 | 7.8%(+0.512)#5,533 |
| 99. | Elk Rapids | 8.3% | 6.0%(+2.33)#99 | 7.8%(+0.486)#5,555 |
| 100. | Fairgrove | 8.3% | 6.0%(+2.33)#100 | 7.8%(+0.486)#5,560 |
Common Questions
What are the Top 10 Cities with the Highest Percentage of Population Employed in Professional & Scientific Services in Michigan?
Top 10 Cities with the Highest Percentage of Population Employed in Professional & Scientific Services in Michigan are:
#1
31.5%
#2
31.1%
#3
26.9%
#4
23.1%
#5
22.8%
#6
22.1%
#7
21.7%
#8
21.7%
#9
20.8%
#10
19.3%
What city has the Highest Percentage of Population Employed in Professional & Scientific Services in Michigan?
Emmett has the Highest Percentage of Population Employed in Professional & Scientific Services in Michigan with 31.5%.
What is the Percentage of Population Employed in Professional & Scientific Services in the State of Michigan?
Percentage of Population Employed in Professional & Scientific Services in Michigan is 6.0%.
What is the Percentage of Population Employed in Professional & Scientific Services in the United States?
Percentage of Population Employed in Professional & Scientific Services in the United States is 7.8%.