Cities with the Highest Percentage of Population Employed in Professional & Scientific Services in Massachusetts
RELATED REPORTS & OPTIONS
Professional & Scientific Services
Massachusetts
Compare Cities
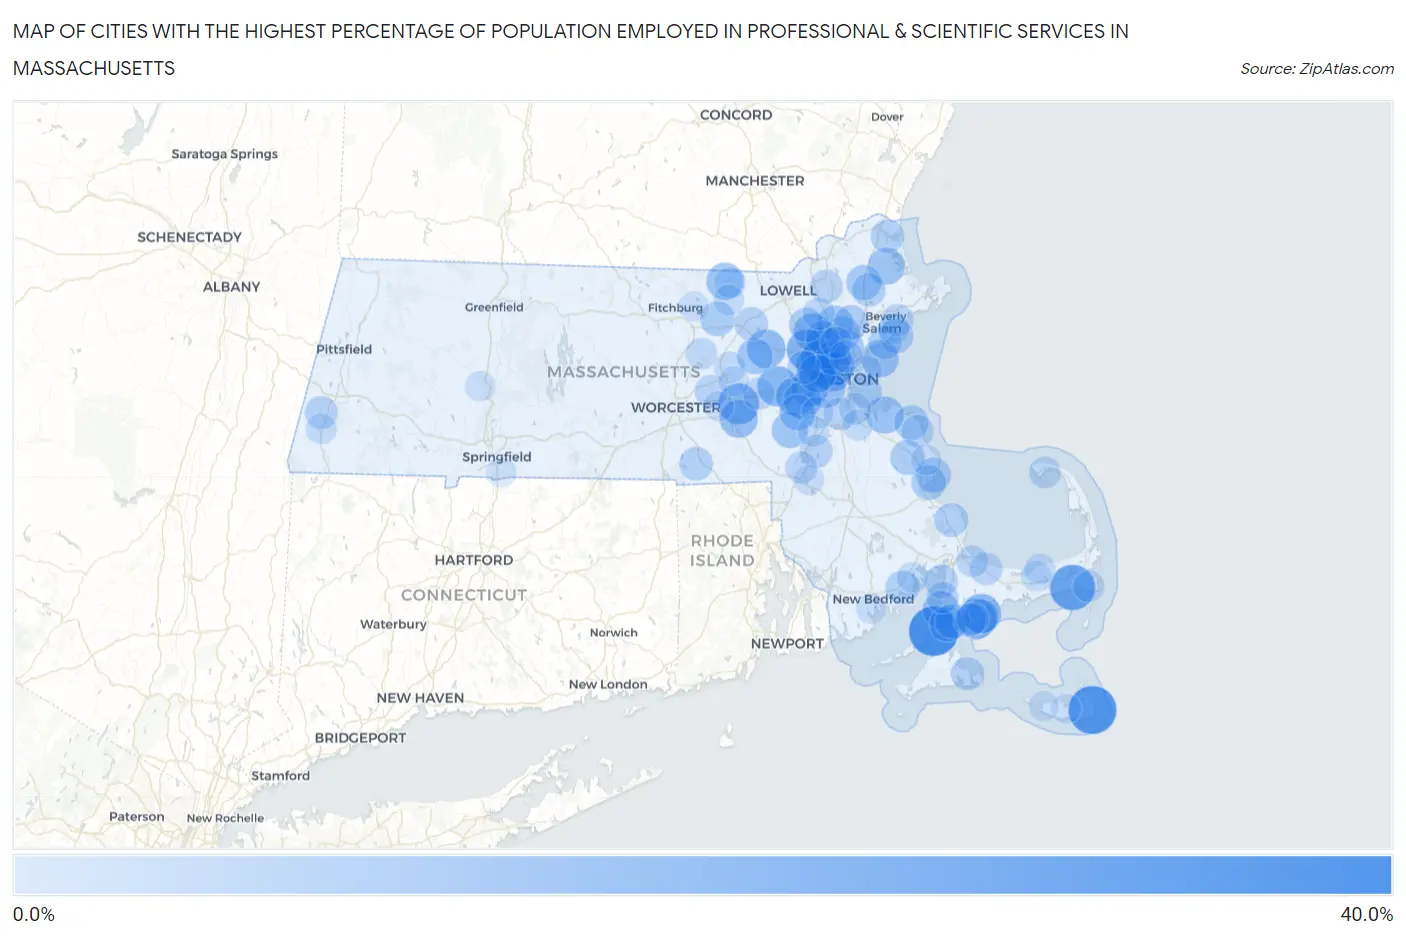
Map of Cities with the Highest Percentage of Population Employed in Professional & Scientific Services in Massachusetts
0.0%
40.0%
Cities with the Highest Percentage of Population Employed in Professional & Scientific Services in Massachusetts
| City | % Employed | vs State | vs National | |
| 1. | Woods Hole | 36.9% | 11.5%(+25.4)#1 | 7.8%(+29.0)#163 |
| 2. | Siasconset | 34.6% | 11.5%(+23.1)#2 | 7.8%(+26.8)#187 |
| 3. | Harwich Port | 30.8% | 11.5%(+19.3)#3 | 7.8%(+22.9)#259 |
| 4. | Belmont | 26.4% | 11.5%(+14.9)#4 | 7.8%(+18.5)#402 |
| 5. | Lexington | 25.5% | 11.5%(+14.0)#5 | 7.8%(+17.6)#444 |
| 6. | Winchester | 24.9% | 11.5%(+13.4)#6 | 7.8%(+17.0)#471 |
| 7. | Cordaville | 24.6% | 11.5%(+13.1)#7 | 7.8%(+16.7)#486 |
| 8. | Cochituate | 23.8% | 11.5%(+12.3)#8 | 7.8%(+15.9)#527 |
| 9. | New Seabury | 23.6% | 11.5%(+12.1)#9 | 7.8%(+15.8)#539 |
| 10. | Cambridge | 23.5% | 11.5%(+12.0)#10 | 7.8%(+15.6)#548 |
| 11. | Popponesset Island | 23.1% | 11.5%(+11.6)#11 | 7.8%(+15.2)#581 |
| 12. | Arlington | 23.1% | 11.5%(+11.6)#12 | 7.8%(+15.2)#582 |
| 13. | Somerville | 22.0% | 11.5%(+10.5)#13 | 7.8%(+14.1)#669 |
| 14. | West Concord | 21.7% | 11.5%(+10.2)#14 | 7.8%(+13.9)#697 |
| 15. | Wellesley | 20.9% | 11.5%(+9.46)#15 | 7.8%(+13.1)#789 |
| 16. | Hopkinton | 20.9% | 11.5%(+9.41)#16 | 7.8%(+13.0)#795 |
| 17. | Brookline | 20.8% | 11.5%(+9.29)#17 | 7.8%(+12.9)#807 |
| 18. | Burlington | 20.8% | 11.5%(+9.28)#18 | 7.8%(+12.9)#809 |
| 19. | Newton | 20.7% | 11.5%(+9.27)#19 | 7.8%(+12.9)#810 |
| 20. | Needham | 20.4% | 11.5%(+8.91)#20 | 7.8%(+12.5)#842 |
| 21. | Watertown Town | 20.3% | 11.5%(+8.79)#21 | 7.8%(+12.4)#859 |
| 22. | Nahant | 19.9% | 11.5%(+8.45)#22 | 7.8%(+12.1)#897 |
| 23. | Hingham | 19.7% | 11.5%(+8.23)#23 | 7.8%(+11.9)#927 |
| 24. | Pepperell | 19.6% | 11.5%(+8.16)#24 | 7.8%(+11.8)#935 |
| 25. | West Falmouth | 19.3% | 11.5%(+7.79)#25 | 7.8%(+11.4)#977 |
| 26. | Rowley | 19.1% | 11.5%(+7.58)#26 | 7.8%(+11.2)#1,009 |
| 27. | Medfield | 18.6% | 11.5%(+7.10)#27 | 7.8%(+10.7)#1,075 |
| 28. | Reading | 18.2% | 11.5%(+6.70)#28 | 7.8%(+10.3)#1,141 |
| 29. | Maynard | 17.8% | 11.5%(+6.35)#29 | 7.8%(+9.98)#1,194 |
| 30. | Dover | 17.8% | 11.5%(+6.30)#30 | 7.8%(+9.93)#1,207 |
| 31. | Falmouth | 17.6% | 11.5%(+6.10)#31 | 7.8%(+9.73)#1,248 |
| 32. | Melrose | 17.1% | 11.5%(+5.65)#32 | 7.8%(+9.28)#1,347 |
| 33. | Boxford | 16.8% | 11.5%(+5.30)#33 | 7.8%(+8.93)#1,422 |
| 34. | Wakefield | 16.8% | 11.5%(+5.28)#34 | 7.8%(+8.91)#1,427 |
| 35. | Medford | 16.7% | 11.5%(+5.19)#35 | 7.8%(+8.82)#1,442 |
| 36. | North Scituate | 16.3% | 11.5%(+4.86)#36 | 7.8%(+8.49)#1,523 |
| 37. | Duxbury | 16.3% | 11.5%(+4.85)#37 | 7.8%(+8.49)#1,525 |
| 38. | Devens | 16.3% | 11.5%(+4.84)#38 | 7.8%(+8.47)#1,528 |
| 39. | Lynnfield | 16.2% | 11.5%(+4.69)#39 | 7.8%(+8.32)#1,562 |
| 40. | South Duxbury | 16.2% | 11.5%(+4.67)#40 | 7.8%(+8.30)#1,567 |
| 41. | Popponesset | 16.1% | 11.5%(+4.66)#41 | 7.8%(+8.30)#1,569 |
| 42. | North Pembroke | 16.1% | 11.5%(+4.66)#42 | 7.8%(+8.29)#1,572 |
| 43. | Teaticket | 16.0% | 11.5%(+4.56)#43 | 7.8%(+8.19)#1,592 |
| 44. | Pinehurst | 16.0% | 11.5%(+4.47)#44 | 7.8%(+8.10)#1,614 |
| 45. | Marblehead | 15.5% | 11.5%(+4.01)#45 | 7.8%(+7.64)#1,732 |
| 46. | Boston | 15.3% | 11.5%(+3.80)#46 | 7.8%(+7.43)#1,798 |
| 47. | The Pinehills | 15.1% | 11.5%(+3.59)#47 | 7.8%(+7.22)#1,846 |
| 48. | Mattapoisett Center | 15.0% | 11.5%(+3.56)#48 | 7.8%(+7.20)#1,851 |
| 49. | Topsfield | 15.0% | 11.5%(+3.48)#49 | 7.8%(+7.11)#1,873 |
| 50. | Swampscott | 14.9% | 11.5%(+3.40)#50 | 7.8%(+7.03)#1,908 |
| 51. | Woburn | 14.8% | 11.5%(+3.32)#51 | 7.8%(+6.95)#1,930 |
| 52. | Newburyport | 14.7% | 11.5%(+3.19)#52 | 7.8%(+6.82)#1,964 |
| 53. | East Douglas | 14.7% | 11.5%(+3.18)#53 | 7.8%(+6.81)#1,969 |
| 54. | Pocasset | 14.6% | 11.5%(+3.12)#54 | 7.8%(+6.75)#1,986 |
| 55. | Littleton Common | 14.6% | 11.5%(+3.09)#55 | 7.8%(+6.72)#1,997 |
| 56. | Edgartown | 14.3% | 11.5%(+2.81)#56 | 7.8%(+6.44)#2,075 |
| 57. | Sharon | 14.1% | 11.5%(+2.60)#57 | 7.8%(+6.23)#2,151 |
| 58. | Waltham | 14.1% | 11.5%(+2.59)#58 | 7.8%(+6.23)#2,154 |
| 59. | Andover | 14.0% | 11.5%(+2.51)#59 | 7.8%(+6.14)#2,186 |
| 60. | Housatonic | 13.7% | 11.5%(+2.24)#60 | 7.8%(+5.87)#2,261 |
| 61. | Malden | 13.6% | 11.5%(+2.11)#61 | 7.8%(+5.74)#2,305 |
| 62. | Northborough | 13.6% | 11.5%(+2.11)#62 | 7.8%(+5.74)#2,307 |
| 63. | East Sandwich | 13.6% | 11.5%(+2.08)#63 | 7.8%(+5.71)#2,320 |
| 64. | Milton | 13.5% | 11.5%(+2.05)#64 | 7.8%(+5.68)#2,331 |
| 65. | Scituate | 13.3% | 11.5%(+1.86)#65 | 7.8%(+5.49)#2,405 |
| 66. | Seconsett Island | 13.3% | 11.5%(+1.85)#66 | 7.8%(+5.49)#2,411 |
| 67. | Monomoscoy Island | 13.2% | 11.5%(+1.76)#67 | 7.8%(+5.39)#2,454 |
| 68. | Wilmington | 13.0% | 11.5%(+1.50)#68 | 7.8%(+5.14)#2,554 |
| 69. | Beverly | 12.9% | 11.5%(+1.42)#69 | 7.8%(+5.05)#2,590 |
| 70. | Provincetown | 12.7% | 11.5%(+1.24)#70 | 7.8%(+4.88)#2,657 |
| 71. | Foxborough | 12.6% | 11.5%(+1.17)#71 | 7.8%(+4.80)#2,693 |
| 72. | Framingham | 12.6% | 11.5%(+1.11)#72 | 7.8%(+4.74)#2,717 |
| 73. | North Falmouth | 12.6% | 11.5%(+1.07)#73 | 7.8%(+4.71)#2,736 |
| 74. | Sandwich | 12.5% | 11.5%(+1.00)#74 | 7.8%(+4.64)#2,775 |
| 75. | Quincy | 12.4% | 11.5%(+0.967)#75 | 7.8%(+4.60)#2,789 |
| 76. | West Chatham | 12.3% | 11.5%(+0.819)#76 | 7.8%(+4.45)#2,855 |
| 77. | Stoneham | 12.2% | 11.5%(+0.746)#77 | 7.8%(+4.38)#2,888 |
| 78. | Hudson | 12.2% | 11.5%(+0.680)#78 | 7.8%(+4.31)#2,922 |
| 79. | Dedham | 12.2% | 11.5%(+0.680)#79 | 7.8%(+4.31)#2,923 |
| 80. | South Lancaster | 11.9% | 11.5%(+0.457)#80 | 7.8%(+4.09)#3,043 |
| 81. | Norwood | 11.8% | 11.5%(+0.359)#81 | 7.8%(+3.99)#3,094 |
| 82. | Salem | 11.6% | 11.5%(+0.089)#82 | 7.8%(+3.72)#3,220 |
| 83. | Winthrop Town | 11.4% | 11.5%(-0.129)#83 | 7.8%(+3.50)#3,327 |
| 84. | Marion Center | 11.3% | 11.5%(-0.139)#84 | 7.8%(+3.49)#3,331 |
| 85. | East Pepperell | 11.2% | 11.5%(-0.234)#85 | 7.8%(+3.40)#3,396 |
| 86. | Braintree Town | 11.2% | 11.5%(-0.295)#86 | 7.8%(+3.34)#3,417 |
| 87. | Dennis | 11.2% | 11.5%(-0.312)#87 | 7.8%(+3.32)#3,424 |
| 88. | Great Barrington | 11.1% | 11.5%(-0.426)#88 | 7.8%(+3.21)#3,490 |
| 89. | Groton | 11.1% | 11.5%(-0.427)#89 | 7.8%(+3.21)#3,491 |
| 90. | Yarmouth Port | 10.9% | 11.5%(-0.588)#90 | 7.8%(+3.04)#3,586 |
| 91. | Marshfield | 10.7% | 11.5%(-0.816)#91 | 7.8%(+2.82)#3,737 |
| 92. | Mansfield Center | 10.6% | 11.5%(-0.866)#92 | 7.8%(+2.77)#3,768 |
| 93. | Marlborough | 10.5% | 11.5%(-0.988)#93 | 7.8%(+2.64)#3,846 |
| 94. | Northampton | 10.4% | 11.5%(-1.10)#94 | 7.8%(+2.53)#3,927 |
| 95. | Bliss Corner | 10.3% | 11.5%(-1.17)#95 | 7.8%(+2.46)#3,973 |
| 96. | Westborough | 10.2% | 11.5%(-1.26)#96 | 7.8%(+2.37)#4,027 |
| 97. | Lunenburg | 10.1% | 11.5%(-1.36)#97 | 7.8%(+2.28)#4,088 |
| 98. | Longmeadow | 10.1% | 11.5%(-1.42)#98 | 7.8%(+2.21)#4,117 |
| 99. | Nantucket | 10.0% | 11.5%(-1.45)#99 | 7.8%(+2.18)#4,138 |
| 100. | Madaket | 9.9% | 11.5%(-1.58)#100 | 7.8%(+2.05)#4,229 |
Common Questions
What are the Top 10 Cities with the Highest Percentage of Population Employed in Professional & Scientific Services in Massachusetts?
Top 10 Cities with the Highest Percentage of Population Employed in Professional & Scientific Services in Massachusetts are:
#1
36.9%
#2
34.6%
#3
30.8%
#4
26.4%
#5
25.5%
#6
24.9%
#7
24.6%
#8
23.8%
#9
23.6%
#10
23.5%
What city has the Highest Percentage of Population Employed in Professional & Scientific Services in Massachusetts?
Woods Hole has the Highest Percentage of Population Employed in Professional & Scientific Services in Massachusetts with 36.9%.
What is the Percentage of Population Employed in Professional & Scientific Services in the State of Massachusetts?
Percentage of Population Employed in Professional & Scientific Services in Massachusetts is 11.5%.
What is the Percentage of Population Employed in Professional & Scientific Services in the United States?
Percentage of Population Employed in Professional & Scientific Services in the United States is 7.8%.