Cities with the Highest Percentage of Population Employed in Professional & Scientific Services in Wisconsin
RELATED REPORTS & OPTIONS
Professional & Scientific Services
Wisconsin
Compare Cities
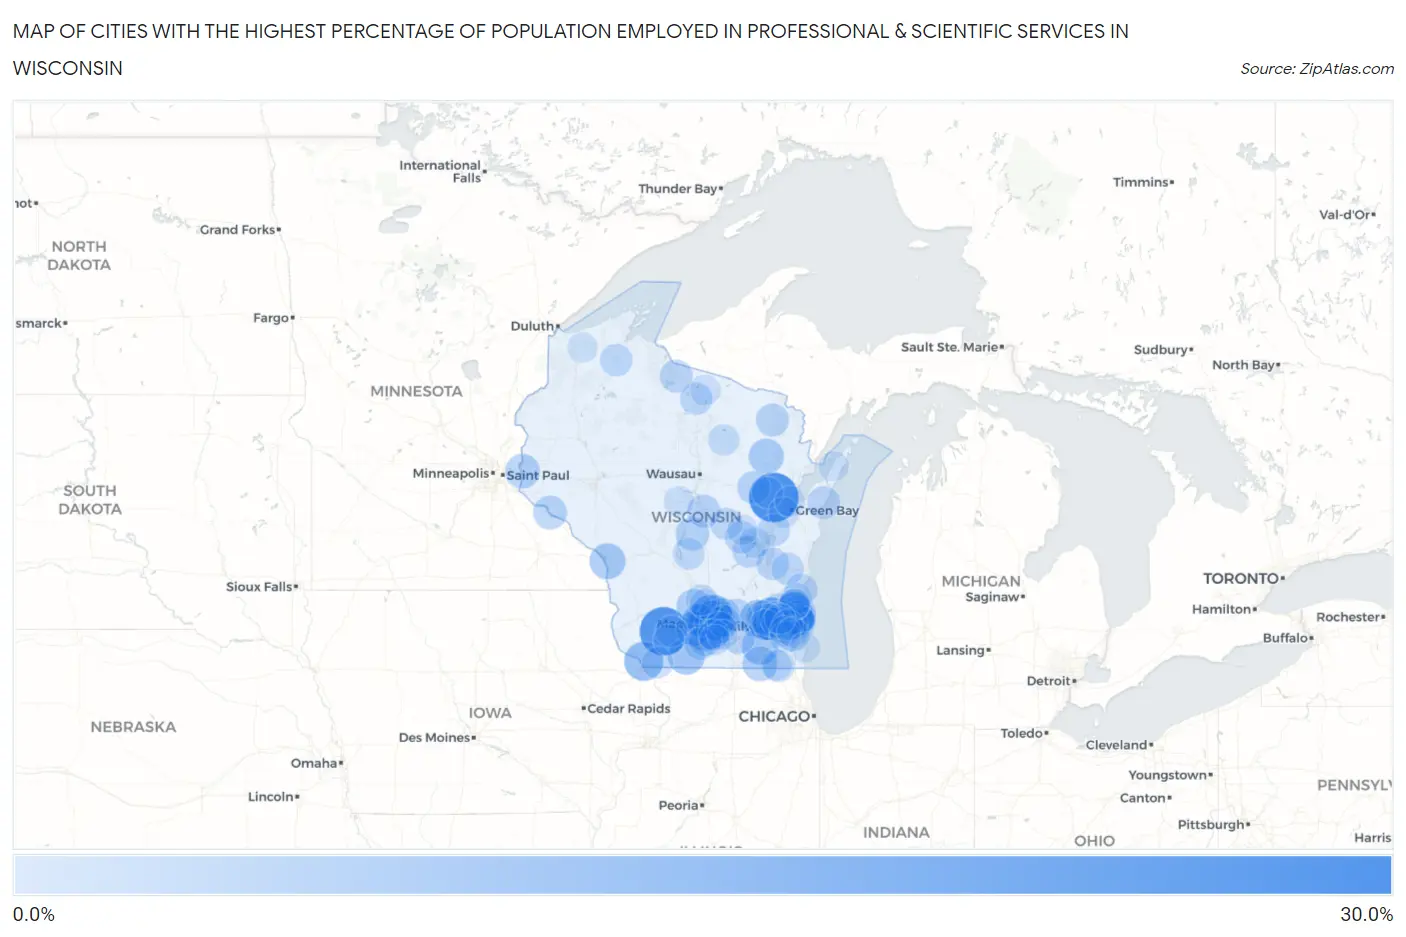
Map of Cities with the Highest Percentage of Population Employed in Professional & Scientific Services in Wisconsin
0.0%
30.0%
Cities with the Highest Percentage of Population Employed in Professional & Scientific Services in Wisconsin
| City | % Employed | vs State | vs National | |
| 1. | Angelica | 26.9% | 5.4%(+21.5)#1 | 7.8%(+19.1)#384 |
| 2. | Edmund | 25.7% | 5.4%(+20.3)#2 | 7.8%(+17.9)#433 |
| 3. | Shopiere | 21.4% | 5.4%(+16.0)#3 | 7.8%(+13.6)#726 |
| 4. | Chenequa | 19.5% | 5.4%(+14.1)#4 | 7.8%(+11.6)#954 |
| 5. | Verona | 18.0% | 5.4%(+12.5)#5 | 7.8%(+10.1)#1,169 |
| 6. | Shorewood Hills | 17.7% | 5.4%(+12.3)#6 | 7.8%(+9.86)#1,218 |
| 7. | Waunakee | 17.6% | 5.4%(+12.1)#7 | 7.8%(+9.71)#1,254 |
| 8. | Middleton | 16.7% | 5.4%(+11.2)#8 | 7.8%(+8.81)#1,454 |
| 9. | Maple Bluff | 16.2% | 5.4%(+10.8)#9 | 7.8%(+8.34)#1,559 |
| 10. | Kieler | 16.1% | 5.4%(+10.7)#10 | 7.8%(+8.24)#1,583 |
| 11. | Ixonia | 14.9% | 5.4%(+9.44)#11 | 7.8%(+7.03)#1,909 |
| 12. | Fitchburg | 14.6% | 5.4%(+9.12)#12 | 7.8%(+6.70)#2,004 |
| 13. | Thiensville | 14.5% | 5.4%(+9.10)#13 | 7.8%(+6.69)#2,009 |
| 14. | Bayside | 14.4% | 5.4%(+8.96)#14 | 7.8%(+6.55)#2,043 |
| 15. | Mequon | 14.4% | 5.4%(+8.92)#15 | 7.8%(+6.51)#2,053 |
| 16. | Woodford | 13.8% | 5.4%(+8.36)#16 | 7.8%(+5.95)#2,233 |
| 17. | Oconomowoc Lake | 13.7% | 5.4%(+8.30)#17 | 7.8%(+5.89)#2,250 |
| 18. | Nashotah | 13.7% | 5.4%(+8.28)#18 | 7.8%(+5.87)#2,265 |
| 19. | Lauderdale Lakes | 13.6% | 5.4%(+8.21)#19 | 7.8%(+5.80)#2,287 |
| 20. | River Hills | 13.2% | 5.4%(+7.72)#20 | 7.8%(+5.30)#2,489 |
| 21. | Madison | 13.0% | 5.4%(+7.53)#21 | 7.8%(+5.11)#2,561 |
| 22. | French Island | 12.9% | 5.4%(+7.52)#22 | 7.8%(+5.10)#2,568 |
| 23. | Brookfield | 12.9% | 5.4%(+7.51)#23 | 7.8%(+5.10)#2,570 |
| 24. | Mount Horeb | 12.3% | 5.4%(+6.85)#24 | 7.8%(+4.43)#2,863 |
| 25. | Mountain | 12.2% | 5.4%(+6.74)#25 | 7.8%(+4.33)#2,916 |
| 26. | Rubicon | 12.2% | 5.4%(+6.73)#26 | 7.8%(+4.31)#2,918 |
| 27. | Glendale | 12.2% | 5.4%(+6.72)#27 | 7.8%(+4.31)#2,924 |
| 28. | Fontana On Geneva Lake | 11.7% | 5.4%(+6.25)#28 | 7.8%(+3.84)#3,165 |
| 29. | Greendale | 11.6% | 5.4%(+6.14)#29 | 7.8%(+3.73)#3,217 |
| 30. | North Hudson | 11.5% | 5.4%(+6.10)#30 | 7.8%(+3.68)#3,242 |
| 31. | Prairie Du Sac | 11.4% | 5.4%(+6.00)#31 | 7.8%(+3.59)#3,288 |
| 32. | Fox Point | 11.1% | 5.4%(+5.71)#32 | 7.8%(+3.29)#3,437 |
| 33. | Sun Prairie | 11.1% | 5.4%(+5.62)#33 | 7.8%(+3.20)#3,492 |
| 34. | Shorewood | 10.9% | 5.4%(+5.42)#34 | 7.8%(+3.01)#3,618 |
| 35. | Stockholm | 10.7% | 5.4%(+5.28)#35 | 7.8%(+2.87)#3,705 |
| 36. | Lake Camelot | 10.6% | 5.4%(+5.15)#36 | 7.8%(+2.73)#3,788 |
| 37. | Monona | 10.5% | 5.4%(+5.02)#37 | 7.8%(+2.60)#3,876 |
| 38. | Lac La Belle | 10.4% | 5.4%(+5.01)#38 | 7.8%(+2.60)#3,879 |
| 39. | Richfield | 10.3% | 5.4%(+4.88)#39 | 7.8%(+2.46)#3,971 |
| 40. | Whiting | 10.2% | 5.4%(+4.76)#40 | 7.8%(+2.34)#4,046 |
| 41. | Delafield | 10.1% | 5.4%(+4.68)#41 | 7.8%(+2.26)#4,093 |
| 42. | Hartland | 10.0% | 5.4%(+4.61)#42 | 7.8%(+2.19)#4,127 |
| 43. | Goodman | 10.0% | 5.4%(+4.57)#43 | 7.8%(+2.15)#4,162 |
| 44. | Thornton | 10.0% | 5.4%(+4.57)#44 | 7.8%(+2.15)#4,168 |
| 45. | Cross Plains | 9.9% | 5.4%(+4.51)#45 | 7.8%(+2.09)#4,195 |
| 46. | Mercer | 9.9% | 5.4%(+4.42)#46 | 7.8%(+2.01)#4,256 |
| 47. | Algoma | 9.8% | 5.4%(+4.37)#47 | 7.8%(+1.95)#4,293 |
| 48. | Lake Koshkonong | 9.8% | 5.4%(+4.37)#48 | 7.8%(+1.95)#4,294 |
| 49. | Waukau | 9.7% | 5.4%(+4.22)#49 | 7.8%(+1.81)#4,398 |
| 50. | Okauchee Lake | 9.6% | 5.4%(+4.14)#50 | 7.8%(+1.72)#4,469 |
| 51. | Waterloo | 9.5% | 5.4%(+4.10)#51 | 7.8%(+1.68)#4,501 |
| 52. | Belleville | 9.5% | 5.4%(+4.07)#52 | 7.8%(+1.66)#4,527 |
| 53. | Deforest | 9.5% | 5.4%(+4.04)#53 | 7.8%(+1.63)#4,552 |
| 54. | Wauwatosa | 9.5% | 5.4%(+4.04)#54 | 7.8%(+1.62)#4,558 |
| 55. | Belgium | 9.5% | 5.4%(+4.03)#55 | 7.8%(+1.62)#4,561 |
| 56. | Cottage Grove | 9.5% | 5.4%(+4.02)#56 | 7.8%(+1.60)#4,569 |
| 57. | Tustin | 9.4% | 5.4%(+4.00)#57 | 7.8%(+1.59)#4,589 |
| 58. | St Peter | 9.4% | 5.4%(+3.95)#58 | 7.8%(+1.53)#4,627 |
| 59. | Grand View | 9.4% | 5.4%(+3.94)#59 | 7.8%(+1.53)#4,638 |
| 60. | Kimberly | 9.3% | 5.4%(+3.87)#60 | 7.8%(+1.46)#4,689 |
| 61. | Greenbush | 9.3% | 5.4%(+3.83)#61 | 7.8%(+1.41)#4,730 |
| 62. | Woodruff | 9.3% | 5.4%(+3.82)#62 | 7.8%(+1.41)#4,736 |
| 63. | Whitefish Bay | 9.2% | 5.4%(+3.80)#63 | 7.8%(+1.39)#4,751 |
| 64. | Chain O Lakes | 9.1% | 5.4%(+3.69)#64 | 7.8%(+1.27)#4,848 |
| 65. | New Glarus | 9.0% | 5.4%(+3.55)#65 | 7.8%(+1.14)#4,972 |
| 66. | Saukville | 8.9% | 5.4%(+3.48)#66 | 7.8%(+1.06)#5,050 |
| 67. | Adams | 8.8% | 5.4%(+3.33)#67 | 7.8%(+0.912)#5,187 |
| 68. | Merton | 8.7% | 5.4%(+3.24)#68 | 7.8%(+0.822)#5,260 |
| 69. | Benton | 8.6% | 5.4%(+3.20)#69 | 7.8%(+0.789)#5,291 |
| 70. | Twin Lakes | 8.6% | 5.4%(+3.17)#70 | 7.8%(+0.754)#5,323 |
| 71. | Mcfarland | 8.5% | 5.4%(+3.11)#71 | 7.8%(+0.700)#5,368 |
| 72. | Dodgeville | 8.5% | 5.4%(+3.03)#72 | 7.8%(+0.613)#5,436 |
| 73. | Pewaukee | 8.4% | 5.4%(+3.00)#73 | 7.8%(+0.584)#5,463 |
| 74. | Summit Lake | 8.3% | 5.4%(+2.90)#74 | 7.8%(+0.486)#5,575 |
| 75. | Bonduel | 8.3% | 5.4%(+2.84)#75 | 7.8%(+0.430)#5,613 |
| 76. | Lake Wisconsin | 8.1% | 5.4%(+2.68)#76 | 7.8%(+0.265)#5,781 |
| 77. | Butte Des Morts | 8.1% | 5.4%(+2.67)#77 | 7.8%(+0.255)#5,799 |
| 78. | Cedarburg | 8.1% | 5.4%(+2.64)#78 | 7.8%(+0.230)#5,832 |
| 79. | Summit | 8.1% | 5.4%(+2.64)#79 | 7.8%(+0.222)#5,842 |
| 80. | Muskego | 8.0% | 5.4%(+2.52)#80 | 7.8%(+0.104)#5,964 |
| 81. | Powers Lake | 7.9% | 5.4%(+2.51)#81 | 7.8%(+0.093)#5,976 |
| 82. | Oregon | 7.9% | 5.4%(+2.48)#82 | 7.8%(+0.068)#6,006 |
| 83. | Mineral Point | 7.9% | 5.4%(+2.48)#83 | 7.8%(+0.061)#6,010 |
| 84. | Elm Grove | 7.9% | 5.4%(+2.44)#84 | 7.8%(+0.029)#6,045 |
| 85. | Greenville | 7.9% | 5.4%(+2.43)#85 | 7.8%(+0.020)#6,054 |
| 86. | Grafton | 7.8% | 5.4%(+2.36)#86 | 7.8%(-0.056)#6,147 |
| 87. | New Berlin | 7.8% | 5.4%(+2.34)#87 | 7.8%(-0.075)#6,165 |
| 88. | Hobart | 7.7% | 5.4%(+2.29)#88 | 7.8%(-0.123)#6,211 |
| 89. | Sussex | 7.5% | 5.4%(+2.10)#89 | 7.8%(-0.313)#6,428 |
| 90. | Stoughton | 7.5% | 5.4%(+2.05)#90 | 7.8%(-0.362)#6,474 |
| 91. | Brooklyn | 7.5% | 5.4%(+2.04)#91 | 7.8%(-0.371)#6,484 |
| 92. | Suamico | 7.5% | 5.4%(+2.03)#92 | 7.8%(-0.381)#6,499 |
| 93. | Fremont | 7.3% | 5.4%(+1.92)#93 | 7.8%(-0.499)#6,645 |
| 94. | Auburndale | 7.3% | 5.4%(+1.88)#94 | 7.8%(-0.530)#6,687 |
| 95. | Sayner | 7.3% | 5.4%(+1.88)#95 | 7.8%(-0.530)#6,692 |
| 96. | Greenfield | 7.3% | 5.4%(+1.88)#96 | 7.8%(-0.531)#6,694 |
| 97. | Lodi | 7.3% | 5.4%(+1.87)#97 | 7.8%(-0.545)#6,715 |
| 98. | North Bay | 7.2% | 5.4%(+1.80)#98 | 7.8%(-0.619)#6,794 |
| 99. | Egg Harbor | 7.2% | 5.4%(+1.78)#99 | 7.8%(-0.631)#6,810 |
| 100. | Lake Nebagamon | 7.1% | 5.4%(+1.64)#100 | 7.8%(-0.772)#7,005 |
Common Questions
What are the Top 10 Cities with the Highest Percentage of Population Employed in Professional & Scientific Services in Wisconsin?
Top 10 Cities with the Highest Percentage of Population Employed in Professional & Scientific Services in Wisconsin are:
#1
26.9%
#2
25.7%
#3
19.5%
#4
18.0%
#5
17.7%
#6
17.6%
#7
16.7%
#8
16.2%
#9
16.1%
#10
14.9%
What city has the Highest Percentage of Population Employed in Professional & Scientific Services in Wisconsin?
Angelica has the Highest Percentage of Population Employed in Professional & Scientific Services in Wisconsin with 26.9%.
What is the Percentage of Population Employed in Professional & Scientific Services in the State of Wisconsin?
Percentage of Population Employed in Professional & Scientific Services in Wisconsin is 5.4%.
What is the Percentage of Population Employed in Professional & Scientific Services in the United States?
Percentage of Population Employed in Professional & Scientific Services in the United States is 7.8%.