Cities with the Highest Percentage of Population Employed in Professional & Scientific Services in Ohio
RELATED REPORTS & OPTIONS
Professional & Scientific Services
Ohio
Compare Cities
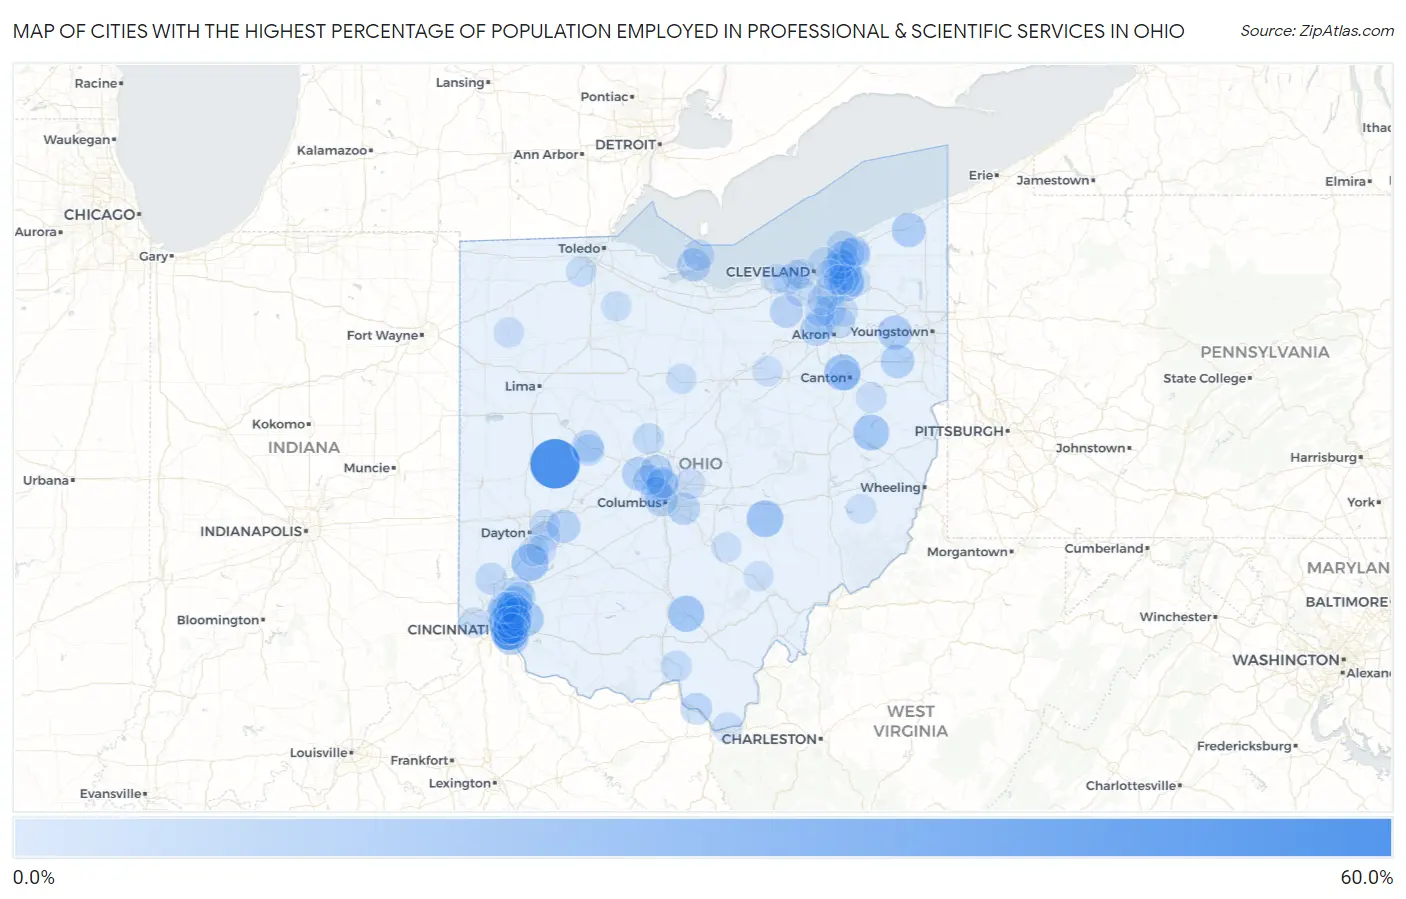
Map of Cities with the Highest Percentage of Population Employed in Professional & Scientific Services in Ohio
0.0%
60.0%
Cities with the Highest Percentage of Population Employed in Professional & Scientific Services in Ohio
| City | % Employed | vs State | vs National | |
| 1. | Rosewood | 58.2% | 6.1%(+52.2)#1 | 7.8%(+50.4)#44 |
| 2. | Plainville | 39.3% | 6.1%(+33.2)#2 | 7.8%(+31.4)#136 |
| 3. | Sherwood | 30.0% | 6.1%(+24.0)#3 | 7.8%(+22.2)#275 |
| 4. | Five Points | 28.0% | 6.1%(+22.0)#4 | 7.8%(+20.2)#337 |
| 5. | Madison Place | 26.9% | 6.1%(+20.8)#5 | 7.8%(+19.0)#386 |
| 6. | East Fultonham | 26.8% | 6.1%(+20.7)#6 | 7.8%(+18.9)#387 |
| 7. | Hills And Dales | 26.0% | 6.1%(+20.0)#7 | 7.8%(+18.2)#420 |
| 8. | Richmond Dale | 26.0% | 6.1%(+19.9)#8 | 7.8%(+18.1)#425 |
| 9. | Bowerston | 24.8% | 6.1%(+18.8)#9 | 7.8%(+17.0)#477 |
| 10. | Day Heights | 23.0% | 6.1%(+17.0)#10 | 7.8%(+15.2)#585 |
| 11. | Coldstream | 22.8% | 6.1%(+16.7)#11 | 7.8%(+14.9)#605 |
| 12. | Bentleyville | 22.2% | 6.1%(+16.2)#12 | 7.8%(+14.4)#643 |
| 13. | Sixteen Mile Stand | 21.9% | 6.1%(+15.8)#13 | 7.8%(+14.0)#679 |
| 14. | Austinburg | 21.1% | 6.1%(+15.0)#14 | 7.8%(+13.2)#770 |
| 15. | Lake Milton | 21.0% | 6.1%(+15.0)#15 | 7.8%(+13.2)#778 |
| 16. | Damascus | 19.8% | 6.1%(+13.8)#16 | 7.8%(+12.0)#914 |
| 17. | New California | 19.3% | 6.1%(+13.2)#17 | 7.8%(+11.4)#972 |
| 18. | Concorde Hills | 19.1% | 6.1%(+13.0)#18 | 7.8%(+11.2)#1,006 |
| 19. | Fruit Hill | 19.0% | 6.1%(+13.0)#19 | 7.8%(+11.2)#1,016 |
| 20. | Birmingham | 18.9% | 6.1%(+12.9)#20 | 7.8%(+11.1)#1,038 |
| 21. | Yellow Springs | 18.9% | 6.1%(+12.8)#21 | 7.8%(+11.0)#1,048 |
| 22. | Lakeside | 18.8% | 6.1%(+12.7)#22 | 7.8%(+10.9)#1,052 |
| 23. | Hamburg | 18.5% | 6.1%(+12.4)#23 | 7.8%(+10.6)#1,088 |
| 24. | Valley City | 18.0% | 6.1%(+11.9)#24 | 7.8%(+10.1)#1,168 |
| 25. | Walton Hills | 17.8% | 6.1%(+11.8)#25 | 7.8%(+9.99)#1,191 |
| 26. | Grandview Heights | 17.8% | 6.1%(+11.7)#26 | 7.8%(+9.95)#1,202 |
| 27. | Kirtland | 17.8% | 6.1%(+11.7)#27 | 7.8%(+9.92)#1,208 |
| 28. | Salem Heights | 17.6% | 6.1%(+11.6)#28 | 7.8%(+9.78)#1,241 |
| 29. | Powell | 17.5% | 6.1%(+11.5)#29 | 7.8%(+9.67)#1,265 |
| 30. | Brice | 17.0% | 6.1%(+11.0)#30 | 7.8%(+9.17)#1,368 |
| 31. | Amberley | 16.8% | 6.1%(+10.8)#31 | 7.8%(+8.99)#1,410 |
| 32. | Riverlea | 16.8% | 6.1%(+10.7)#32 | 7.8%(+8.94)#1,421 |
| 33. | Pigeon Creek | 16.7% | 6.1%(+10.7)#33 | 7.8%(+8.86)#1,435 |
| 34. | Zanesfield | 16.7% | 6.1%(+10.6)#34 | 7.8%(+8.82)#1,445 |
| 35. | Madeira | 16.5% | 6.1%(+10.4)#35 | 7.8%(+8.65)#1,492 |
| 36. | The Village Of Indian Hill | 16.1% | 6.1%(+10.1)#36 | 7.8%(+8.29)#1,570 |
| 37. | Hanging Rock | 16.0% | 6.1%(+9.94)#37 | 7.8%(+8.15)#1,603 |
| 38. | Mason | 15.8% | 6.1%(+9.78)#38 | 7.8%(+7.99)#1,641 |
| 39. | Williamsdale | 15.6% | 6.1%(+9.53)#39 | 7.8%(+7.74)#1,718 |
| 40. | Remington | 15.5% | 6.1%(+9.42)#40 | 7.8%(+7.63)#1,735 |
| 41. | Gates Mills | 15.3% | 6.1%(+9.26)#41 | 7.8%(+7.47)#1,790 |
| 42. | Turpin Hills | 15.2% | 6.1%(+9.11)#42 | 7.8%(+7.32)#1,818 |
| 43. | Blue Ash | 15.2% | 6.1%(+9.10)#43 | 7.8%(+7.31)#1,824 |
| 44. | Waite Hill | 15.0% | 6.1%(+8.94)#44 | 7.8%(+7.15)#1,857 |
| 45. | Valley Hi | 14.9% | 6.1%(+8.89)#45 | 7.8%(+7.09)#1,876 |
| 46. | Landen | 14.9% | 6.1%(+8.88)#46 | 7.8%(+7.09)#1,880 |
| 47. | Upper Arlington | 14.8% | 6.1%(+8.72)#47 | 7.8%(+6.93)#1,941 |
| 48. | Chagrin Falls | 14.7% | 6.1%(+8.63)#48 | 7.8%(+6.84)#1,962 |
| 49. | Timberlake | 14.6% | 6.1%(+8.59)#49 | 7.8%(+6.79)#1,974 |
| 50. | Worthington | 14.6% | 6.1%(+8.53)#50 | 7.8%(+6.73)#1,991 |
| 51. | Radnor | 14.5% | 6.1%(+8.47)#51 | 7.8%(+6.68)#2,014 |
| 52. | Kelleys Island | 14.5% | 6.1%(+8.40)#52 | 7.8%(+6.61)#2,034 |
| 53. | Hunting Valley | 14.4% | 6.1%(+8.33)#53 | 7.8%(+6.54)#2,045 |
| 54. | Dublin | 14.4% | 6.1%(+8.31)#54 | 7.8%(+6.52)#2,051 |
| 55. | Clarktown | 14.3% | 6.1%(+8.23)#55 | 7.8%(+6.44)#2,074 |
| 56. | Miamiville | 14.3% | 6.1%(+8.23)#56 | 7.8%(+6.44)#2,076 |
| 57. | Montgomery | 14.3% | 6.1%(+8.20)#57 | 7.8%(+6.41)#2,095 |
| 58. | Peninsula | 14.0% | 6.1%(+7.95)#58 | 7.8%(+6.16)#2,173 |
| 59. | Lyndhurst | 14.0% | 6.1%(+7.94)#59 | 7.8%(+6.15)#2,180 |
| 60. | Evendale | 14.0% | 6.1%(+7.94)#60 | 7.8%(+6.15)#2,181 |
| 61. | Montrose Ghent | 13.8% | 6.1%(+7.77)#61 | 7.8%(+5.97)#2,223 |
| 62. | Ridgewood | 13.7% | 6.1%(+7.65)#62 | 7.8%(+5.86)#2,267 |
| 63. | Mariemont | 13.5% | 6.1%(+7.47)#63 | 7.8%(+5.68)#2,335 |
| 64. | South Russell | 13.5% | 6.1%(+7.46)#64 | 7.8%(+5.67)#2,336 |
| 65. | Highland Heights | 13.4% | 6.1%(+7.34)#65 | 7.8%(+5.55)#2,389 |
| 66. | Lake Mohawk | 13.4% | 6.1%(+7.33)#66 | 7.8%(+5.54)#2,390 |
| 67. | Moreland Hills | 13.4% | 6.1%(+7.30)#67 | 7.8%(+5.51)#2,400 |
| 68. | Willoughby Hills | 13.3% | 6.1%(+7.28)#68 | 7.8%(+5.49)#2,406 |
| 69. | Hudson | 13.3% | 6.1%(+7.21)#69 | 7.8%(+5.42)#2,438 |
| 70. | Silver Lake | 13.3% | 6.1%(+7.20)#70 | 7.8%(+5.41)#2,442 |
| 71. | Waterville | 13.3% | 6.1%(+7.19)#71 | 7.8%(+5.40)#2,445 |
| 72. | Chesapeake | 12.9% | 6.1%(+6.86)#72 | 7.8%(+5.07)#2,581 |
| 73. | Wright Patterson Afb | 12.9% | 6.1%(+6.86)#73 | 7.8%(+5.07)#2,583 |
| 74. | Middleburg Heights | 12.8% | 6.1%(+6.75)#74 | 7.8%(+4.96)#2,617 |
| 75. | Beavercreek | 12.7% | 6.1%(+6.67)#75 | 7.8%(+4.88)#2,656 |
| 76. | Meyers Lake | 12.7% | 6.1%(+6.66)#76 | 7.8%(+4.86)#2,661 |
| 77. | Richfield | 12.7% | 6.1%(+6.60)#77 | 7.8%(+4.81)#2,688 |
| 78. | Oakwood | 12.7% | 6.1%(+6.60)#78 | 7.8%(+4.81)#2,691 |
| 79. | Bratenahl | 12.6% | 6.1%(+6.51)#79 | 7.8%(+4.72)#2,726 |
| 80. | New Pittsburg | 12.5% | 6.1%(+6.44)#80 | 7.8%(+4.65)#2,757 |
| 81. | Terrace Park | 12.4% | 6.1%(+6.30)#81 | 7.8%(+4.51)#2,825 |
| 82. | New Albany | 12.3% | 6.1%(+6.29)#82 | 7.8%(+4.50)#2,829 |
| 83. | Kirtland Hills | 12.3% | 6.1%(+6.21)#83 | 7.8%(+4.42)#2,871 |
| 84. | Risingsun | 12.2% | 6.1%(+6.19)#84 | 7.8%(+4.40)#2,878 |
| 85. | Dry Run | 12.2% | 6.1%(+6.18)#85 | 7.8%(+4.39)#2,881 |
| 86. | Centerville | 12.2% | 6.1%(+6.18)#86 | 7.8%(+4.39)#2,883 |
| 87. | Mack | 12.2% | 6.1%(+6.16)#87 | 7.8%(+4.37)#2,892 |
| 88. | North Robinson | 12.2% | 6.1%(+6.14)#88 | 7.8%(+4.35)#2,907 |
| 89. | Brecksville | 12.2% | 6.1%(+6.11)#89 | 7.8%(+4.31)#2,919 |
| 90. | Westlake | 12.1% | 6.1%(+6.05)#90 | 7.8%(+4.26)#2,953 |
| 91. | Avon | 12.1% | 6.1%(+6.03)#91 | 7.8%(+4.24)#2,963 |
| 92. | Lakewood | 12.0% | 6.1%(+5.96)#92 | 7.8%(+4.17)#2,988 |
| 93. | Rocky River | 12.0% | 6.1%(+5.91)#93 | 7.8%(+4.12)#3,020 |
| 94. | Shaker Heights | 12.0% | 6.1%(+5.91)#94 | 7.8%(+4.12)#3,021 |
| 95. | Bellbrook | 11.9% | 6.1%(+5.81)#95 | 7.8%(+4.02)#3,074 |
| 96. | Buchtel | 11.8% | 6.1%(+5.74)#96 | 7.8%(+3.95)#3,117 |
| 97. | Blaine | 11.8% | 6.1%(+5.71)#97 | 7.8%(+3.92)#3,127 |
| 98. | Batesville | 11.8% | 6.1%(+5.71)#98 | 7.8%(+3.92)#3,132 |
| 99. | Hide A Way Hills | 11.7% | 6.1%(+5.65)#99 | 7.8%(+3.85)#3,158 |
| 100. | Orange | 11.6% | 6.1%(+5.59)#100 | 7.8%(+3.80)#3,183 |
Common Questions
What are the Top 10 Cities with the Highest Percentage of Population Employed in Professional & Scientific Services in Ohio?
Top 10 Cities with the Highest Percentage of Population Employed in Professional & Scientific Services in Ohio are:
#1
58.2%
#2
39.3%
#3
30.0%
#4
28.0%
#5
26.8%
#6
26.0%
#7
26.0%
#8
24.8%
#9
23.0%
#10
22.8%
What city has the Highest Percentage of Population Employed in Professional & Scientific Services in Ohio?
Rosewood has the Highest Percentage of Population Employed in Professional & Scientific Services in Ohio with 58.2%.
What is the Percentage of Population Employed in Professional & Scientific Services in the State of Ohio?
Percentage of Population Employed in Professional & Scientific Services in Ohio is 6.1%.
What is the Percentage of Population Employed in Professional & Scientific Services in the United States?
Percentage of Population Employed in Professional & Scientific Services in the United States is 7.8%.