Cities with the Highest Percentage of Population Employed in Professional & Scientific Services in Arkansas
RELATED REPORTS & OPTIONS
Professional & Scientific Services
Arkansas
Compare Cities
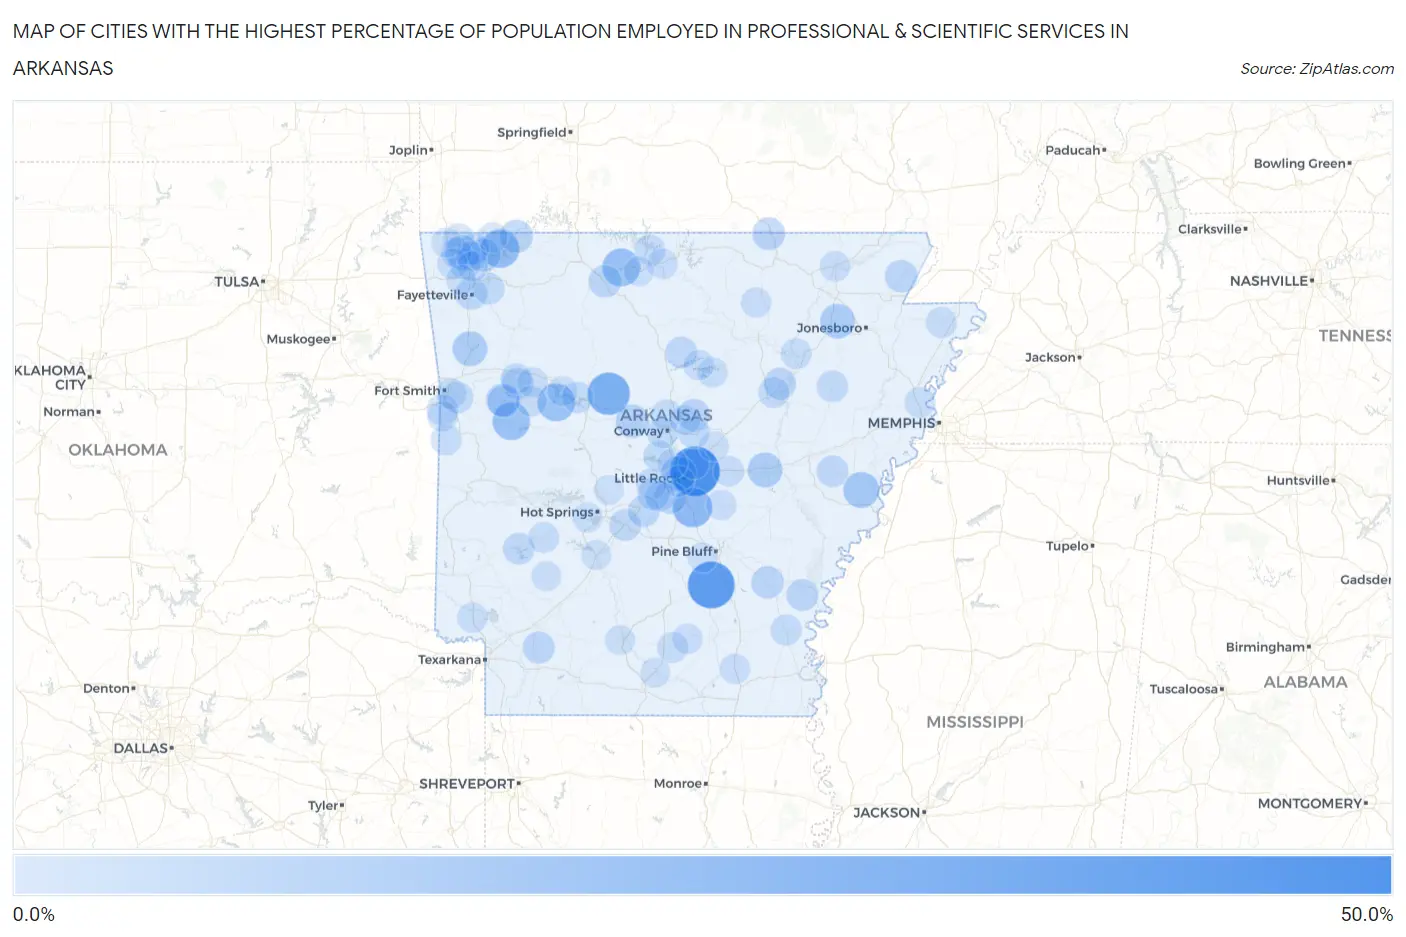
Map of Cities with the Highest Percentage of Population Employed in Professional & Scientific Services in Arkansas
0.0%
50.0%
Cities with the Highest Percentage of Population Employed in Professional & Scientific Services in Arkansas
| City | % Employed | vs State | vs National | |
| 1. | Mcalmont | 45.6% | 4.4%(+41.2)#1 | 7.8%(+37.7)#98 |
| 2. | Woodlawn | 39.7% | 4.4%(+35.3)#2 | 7.8%(+31.8)#131 |
| 3. | Oak Grove | 30.0% | 4.4%(+25.6)#3 | 7.8%(+22.2)#276 |
| 4. | Bismarck | 28.3% | 4.4%(+23.9)#4 | 7.8%(+20.4)#323 |
| 5. | Woodson | 24.2% | 4.4%(+19.8)#5 | 7.8%(+16.4)#510 |
| 6. | Lost Bridge Village | 21.8% | 4.4%(+17.5)#6 | 7.8%(+14.0)#681 |
| 7. | Pyatt | 20.6% | 4.4%(+16.2)#7 | 7.8%(+12.7)#826 |
| 8. | Magazine | 20.1% | 4.4%(+15.7)#8 | 7.8%(+12.2)#876 |
| 9. | New Blaine | 19.9% | 4.4%(+15.5)#9 | 7.8%(+12.0)#902 |
| 10. | Lagrange | 16.7% | 4.4%(+12.3)#10 | 7.8%(+8.82)#1,451 |
| 11. | Lacey | 16.5% | 4.4%(+12.2)#11 | 7.8%(+8.67)#1,483 |
| 12. | Cammack Village | 14.7% | 4.4%(+10.3)#12 | 7.8%(+6.83)#1,963 |
| 13. | Hazen | 14.3% | 4.4%(+9.98)#13 | 7.8%(+6.49)#2,060 |
| 14. | Chester | 14.3% | 4.4%(+9.93)#14 | 7.8%(+6.44)#2,081 |
| 15. | Egypt | 14.3% | 4.4%(+9.93)#15 | 7.8%(+6.44)#2,082 |
| 16. | Springfield | 14.2% | 4.4%(+9.84)#16 | 7.8%(+6.35)#2,111 |
| 17. | Bentonville | 13.0% | 4.4%(+8.60)#17 | 7.8%(+5.11)#2,565 |
| 18. | Morrilton | 11.5% | 4.4%(+7.17)#18 | 7.8%(+3.68)#3,240 |
| 19. | Prairie Creek | 11.2% | 4.4%(+6.83)#19 | 7.8%(+3.34)#3,415 |
| 20. | Beaver | 11.1% | 4.4%(+6.75)#20 | 7.8%(+3.26)#3,453 |
| 21. | Ratcliff | 10.6% | 4.4%(+6.25)#21 | 7.8%(+2.76)#3,775 |
| 22. | Mammoth Spring | 10.1% | 4.4%(+5.74)#22 | 7.8%(+2.25)#4,099 |
| 23. | Shannon Hills | 10.0% | 4.4%(+5.59)#23 | 7.8%(+2.10)#4,192 |
| 24. | Gould | 9.9% | 4.4%(+5.56)#24 | 7.8%(+2.07)#4,206 |
| 25. | Marmaduke | 9.8% | 4.4%(+5.49)#25 | 7.8%(+2.00)#4,262 |
| 26. | Valley Springs | 9.7% | 4.4%(+5.34)#26 | 7.8%(+1.85)#4,367 |
| 27. | Caulksville | 9.6% | 4.4%(+5.26)#27 | 7.8%(+1.77)#4,436 |
| 28. | Wilburn | 9.2% | 4.4%(+4.85)#28 | 7.8%(+1.36)#4,772 |
| 29. | Patmos | 9.1% | 4.4%(+4.73)#29 | 7.8%(+1.24)#4,889 |
| 30. | Salem | 9.0% | 4.4%(+4.69)#30 | 7.8%(+1.20)#4,920 |
| 31. | Enola | 9.0% | 4.4%(+4.67)#31 | 7.8%(+1.18)#4,939 |
| 32. | Sardis | 9.0% | 4.4%(+4.62)#32 | 7.8%(+1.13)#4,980 |
| 33. | Bradford | 8.8% | 4.4%(+4.43)#33 | 7.8%(+0.944)#5,164 |
| 34. | Watson | 8.8% | 4.4%(+4.42)#34 | 7.8%(+0.924)#5,181 |
| 35. | Fayetteville | 8.7% | 4.4%(+4.30)#35 | 7.8%(+0.806)#5,280 |
| 36. | Shirley | 8.5% | 4.4%(+4.12)#36 | 7.8%(+0.627)#5,419 |
| 37. | Denning | 8.4% | 4.4%(+4.06)#37 | 7.8%(+0.574)#5,479 |
| 38. | Moro | 8.3% | 4.4%(+3.98)#38 | 7.8%(+0.486)#5,566 |
| 39. | Rockport | 8.2% | 4.4%(+3.84)#39 | 7.8%(+0.354)#5,680 |
| 40. | Haskell | 8.2% | 4.4%(+3.81)#40 | 7.8%(+0.321)#5,710 |
| 41. | Daisy | 8.1% | 4.4%(+3.78)#41 | 7.8%(+0.292)#5,752 |
| 42. | Goshen | 7.9% | 4.4%(+3.56)#42 | 7.8%(+0.072)#5,998 |
| 43. | Barling | 7.9% | 4.4%(+3.53)#43 | 7.8%(+0.044)#6,030 |
| 44. | Vilonia | 7.8% | 4.4%(+3.47)#44 | 7.8%(-0.017)#6,099 |
| 45. | Hickory Ridge | 7.8% | 4.4%(+3.41)#45 | 7.8%(-0.081)#6,173 |
| 46. | Little Flock | 7.6% | 4.4%(+3.23)#46 | 7.8%(-0.261)#6,374 |
| 47. | Cave Springs | 7.4% | 4.4%(+3.04)#47 | 7.8%(-0.450)#6,575 |
| 48. | Bonanza | 7.3% | 4.4%(+2.98)#48 | 7.8%(-0.508)#6,660 |
| 49. | Little Rock | 7.3% | 4.4%(+2.98)#49 | 7.8%(-0.516)#6,672 |
| 50. | Wooster | 7.2% | 4.4%(+2.84)#50 | 7.8%(-0.646)#6,831 |
| 51. | London | 7.2% | 4.4%(+2.82)#51 | 7.8%(-0.675)#6,861 |
| 52. | Russell | 7.1% | 4.4%(+2.79)#52 | 7.8%(-0.705)#6,903 |
| 53. | Roland | 7.1% | 4.4%(+2.72)#53 | 7.8%(-0.774)#7,009 |
| 54. | Mcgehee | 7.0% | 4.4%(+2.67)#54 | 7.8%(-0.825)#7,059 |
| 55. | Altus | 6.8% | 4.4%(+2.40)#55 | 7.8%(-1.09)#7,424 |
| 56. | Conway | 6.7% | 4.4%(+2.34)#56 | 7.8%(-1.15)#7,509 |
| 57. | Jacksonport | 6.7% | 4.4%(+2.31)#57 | 7.8%(-1.18)#7,575 |
| 58. | Dell | 6.5% | 4.4%(+2.16)#58 | 7.8%(-1.33)#7,777 |
| 59. | Glenwood | 6.5% | 4.4%(+2.14)#59 | 7.8%(-1.35)#7,805 |
| 60. | Avilla | 6.5% | 4.4%(+2.13)#60 | 7.8%(-1.36)#7,830 |
| 61. | Hartford | 6.3% | 4.4%(+1.98)#61 | 7.8%(-1.51)#8,020 |
| 62. | Bella Vista | 6.3% | 4.4%(+1.96)#62 | 7.8%(-1.53)#8,051 |
| 63. | Harrell | 6.3% | 4.4%(+1.96)#63 | 7.8%(-1.53)#8,054 |
| 64. | Sherwood | 6.2% | 4.4%(+1.79)#64 | 7.8%(-1.70)#8,291 |
| 65. | Clarkedale | 6.1% | 4.4%(+1.79)#65 | 7.8%(-1.70)#8,295 |
| 66. | Bull Shoals | 6.1% | 4.4%(+1.74)#66 | 7.8%(-1.75)#8,374 |
| 67. | Lonoke | 6.1% | 4.4%(+1.72)#67 | 7.8%(-1.78)#8,402 |
| 68. | Subiaco | 6.0% | 4.4%(+1.69)#68 | 7.8%(-1.80)#8,452 |
| 69. | Bryant | 6.0% | 4.4%(+1.65)#69 | 7.8%(-1.84)#8,523 |
| 70. | Gassville | 5.9% | 4.4%(+1.59)#70 | 7.8%(-1.90)#8,629 |
| 71. | Hartman | 5.9% | 4.4%(+1.53)#71 | 7.8%(-1.97)#8,726 |
| 72. | Pocahontas | 5.8% | 4.4%(+1.47)#72 | 7.8%(-2.02)#8,819 |
| 73. | Centerton | 5.8% | 4.4%(+1.46)#73 | 7.8%(-2.03)#8,832 |
| 74. | Lowell | 5.8% | 4.4%(+1.42)#74 | 7.8%(-2.07)#8,903 |
| 75. | Sidney | 5.8% | 4.4%(+1.41)#75 | 7.8%(-2.08)#8,918 |
| 76. | Wilton | 5.7% | 4.4%(+1.38)#76 | 7.8%(-2.11)#8,980 |
| 77. | Highfill | 5.7% | 4.4%(+1.34)#77 | 7.8%(-2.15)#9,049 |
| 78. | Banks | 5.6% | 4.4%(+1.28)#78 | 7.8%(-2.21)#9,147 |
| 79. | Rogers | 5.6% | 4.4%(+1.28)#79 | 7.8%(-2.21)#9,152 |
| 80. | England | 5.6% | 4.4%(+1.24)#80 | 7.8%(-2.25)#9,201 |
| 81. | Heber Springs | 5.6% | 4.4%(+1.21)#81 | 7.8%(-2.28)#9,253 |
| 82. | Garfield | 5.5% | 4.4%(+1.15)#82 | 7.8%(-2.34)#9,369 |
| 83. | Fountain Hill | 5.5% | 4.4%(+1.12)#83 | 7.8%(-2.37)#9,418 |
| 84. | Greers Ferry | 5.4% | 4.4%(+1.06)#84 | 7.8%(-2.43)#9,530 |
| 85. | Fort Smith | 5.4% | 4.4%(+1.03)#85 | 7.8%(-2.46)#9,575 |
| 86. | Hackett | 5.4% | 4.4%(+1.02)#86 | 7.8%(-2.47)#9,596 |
| 87. | Rockwell | 5.4% | 4.4%(+1.00)#87 | 7.8%(-2.49)#9,619 |
| 88. | Caddo Valley | 5.3% | 4.4%(+0.906)#88 | 7.8%(-2.58)#9,776 |
| 89. | Holland | 5.3% | 4.4%(+0.906)#89 | 7.8%(-2.58)#9,777 |
| 90. | Hot Springs Village | 5.3% | 4.4%(+0.901)#90 | 7.8%(-2.59)#9,801 |
| 91. | Maumelle | 5.2% | 4.4%(+0.879)#91 | 7.8%(-2.61)#9,831 |
| 92. | Cabot | 5.2% | 4.4%(+0.867)#92 | 7.8%(-2.62)#9,846 |
| 93. | Calion | 5.1% | 4.4%(+0.786)#93 | 7.8%(-2.70)#10,005 |
| 94. | Knoxville | 5.1% | 4.4%(+0.771)#94 | 7.8%(-2.72)#10,037 |
| 95. | Gravette | 5.1% | 4.4%(+0.759)#95 | 7.8%(-2.73)#10,061 |
| 96. | Delight | 5.1% | 4.4%(+0.707)#96 | 7.8%(-2.78)#10,161 |
| 97. | Tontitown | 5.0% | 4.4%(+0.687)#97 | 7.8%(-2.80)#10,205 |
| 98. | Camden | 5.0% | 4.4%(+0.670)#98 | 7.8%(-2.82)#10,241 |
| 99. | Yellville | 5.0% | 4.4%(+0.655)#99 | 7.8%(-2.84)#10,263 |
| 100. | Sulphur Springs | 5.0% | 4.4%(+0.643)#100 | 7.8%(-2.85)#10,277 |
Common Questions
What are the Top 10 Cities with the Highest Percentage of Population Employed in Professional & Scientific Services in Arkansas?
Top 10 Cities with the Highest Percentage of Population Employed in Professional & Scientific Services in Arkansas are:
#1
45.6%
#2
39.7%
#3
30.0%
#4
24.2%
#5
21.8%
#6
20.6%
#7
20.1%
#8
19.9%
#9
16.7%
#10
14.7%
What city has the Highest Percentage of Population Employed in Professional & Scientific Services in Arkansas?
McAlmont has the Highest Percentage of Population Employed in Professional & Scientific Services in Arkansas with 45.6%.
What is the Percentage of Population Employed in Professional & Scientific Services in the State of Arkansas?
Percentage of Population Employed in Professional & Scientific Services in Arkansas is 4.4%.
What is the Percentage of Population Employed in Professional & Scientific Services in the United States?
Percentage of Population Employed in Professional & Scientific Services in the United States is 7.8%.