Cities with the Highest Percentage of Population Employed in Professional & Scientific Services in Indiana
RELATED REPORTS & OPTIONS
Professional & Scientific Services
Indiana
Compare Cities
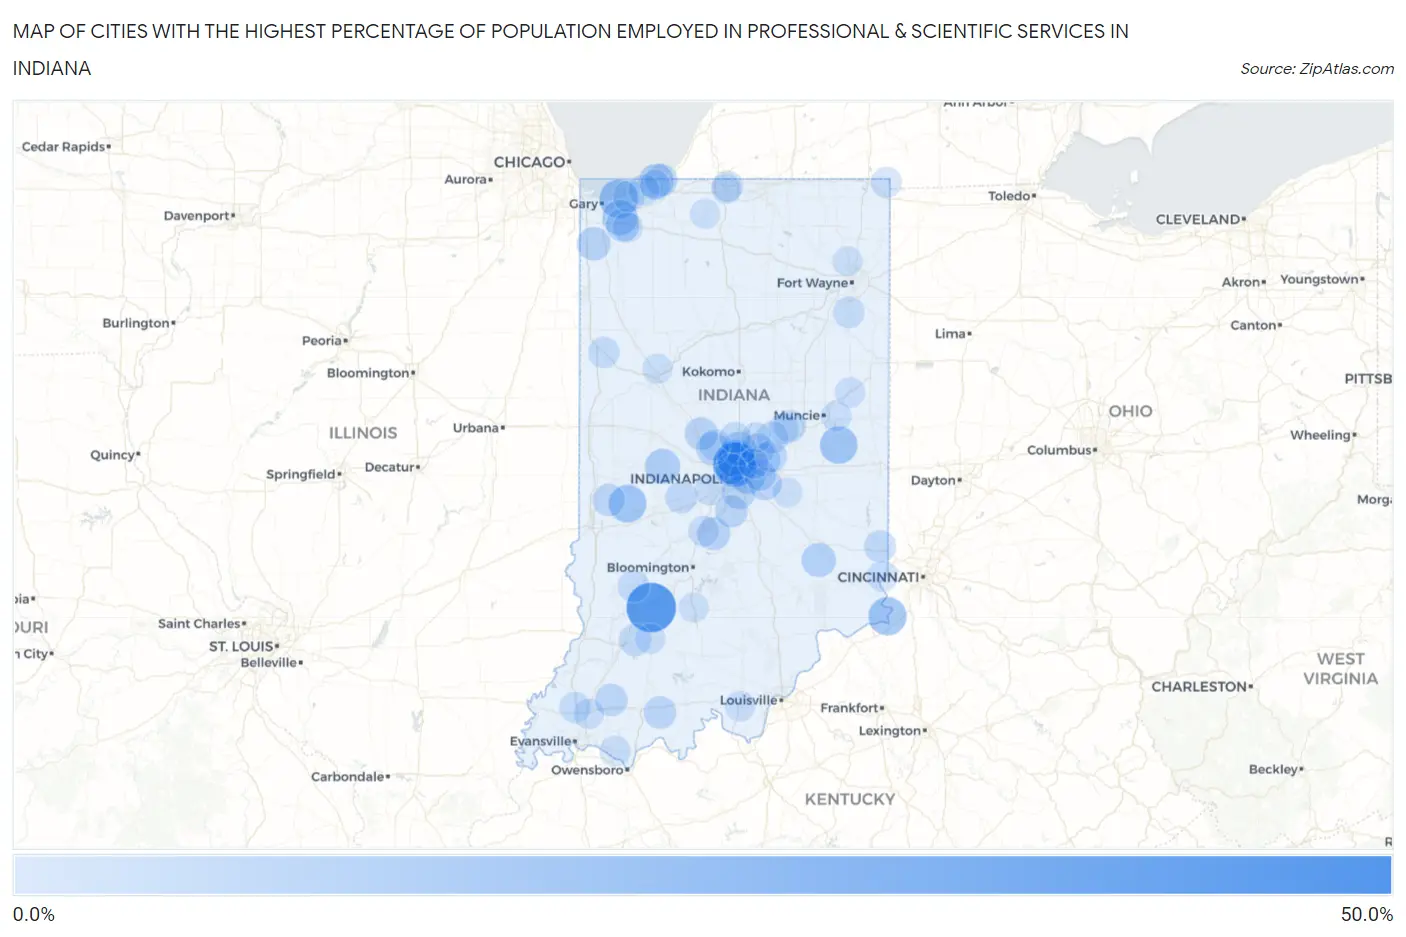
Map of Cities with the Highest Percentage of Population Employed in Professional & Scientific Services in Indiana
0.0%
50.0%
Cities with the Highest Percentage of Population Employed in Professional & Scientific Services in Indiana
| City | % Employed | vs State | vs National | |
| 1. | London | 50.0% | 5.1%(+44.9)#1 | 7.8%(+42.2)#77 |
| 2. | Crane | 45.5% | 5.1%(+40.3)#2 | 7.8%(+37.6)#99 |
| 3. | Hashtown | 45.0% | 5.1%(+39.9)#3 | 7.8%(+37.2)#104 |
| 4. | Crows Nest | 34.5% | 5.1%(+29.3)#4 | 7.8%(+26.6)#190 |
| 5. | North Crows Nest | 32.6% | 5.1%(+27.4)#5 | 7.8%(+24.7)#226 |
| 6. | Rob Roy | 31.8% | 5.1%(+26.7)#6 | 7.8%(+24.0)#242 |
| 7. | Arcola | 28.1% | 5.1%(+22.9)#7 | 7.8%(+20.2)#334 |
| 8. | Ogden Dunes | 23.9% | 5.1%(+18.8)#8 | 7.8%(+16.1)#521 |
| 9. | Westwood | 23.4% | 5.1%(+18.3)#9 | 7.8%(+15.6)#553 |
| 10. | Williams Creek | 22.9% | 5.1%(+17.7)#10 | 7.8%(+15.0)#593 |
| 11. | Patriot | 22.8% | 5.1%(+17.7)#11 | 7.8%(+15.0)#600 |
| 12. | Meridian Hills | 22.7% | 5.1%(+17.5)#12 | 7.8%(+14.8)#608 |
| 13. | Duneland Beach | 22.2% | 5.1%(+17.1)#13 | 7.8%(+14.4)#648 |
| 14. | Carbon | 21.8% | 5.1%(+16.7)#14 | 7.8%(+14.0)#682 |
| 15. | Pleasant Mills | 21.7% | 5.1%(+16.5)#15 | 7.8%(+13.9)#700 |
| 16. | Brimfield | 21.7% | 5.1%(+16.5)#16 | 7.8%(+13.8)#703 |
| 17. | Mooreland | 21.6% | 5.1%(+16.5)#17 | 7.8%(+13.8)#711 |
| 18. | Stewartsville | 17.5% | 5.1%(+12.4)#18 | 7.8%(+9.68)#1,262 |
| 19. | Wheeler | 17.3% | 5.1%(+12.1)#19 | 7.8%(+9.44)#1,316 |
| 20. | Vicksburg | 17.2% | 5.1%(+12.1)#20 | 7.8%(+9.39)#1,322 |
| 21. | Hortonville | 17.1% | 5.1%(+11.9)#21 | 7.8%(+9.25)#1,354 |
| 22. | Long Beach | 17.0% | 5.1%(+11.8)#22 | 7.8%(+9.15)#1,374 |
| 23. | Warren Park | 17.0% | 5.1%(+11.8)#23 | 7.8%(+9.12)#1,380 |
| 24. | Roachdale | 16.9% | 5.1%(+11.7)#24 | 7.8%(+9.01)#1,401 |
| 25. | Millhousen | 15.3% | 5.1%(+10.2)#25 | 7.8%(+7.48)#1,787 |
| 26. | Carmel | 14.9% | 5.1%(+9.74)#26 | 7.8%(+7.04)#1,903 |
| 27. | New London | 14.6% | 5.1%(+9.43)#27 | 7.8%(+6.74)#1,990 |
| 28. | Bridgeton | 14.3% | 5.1%(+9.14)#28 | 7.8%(+6.44)#2,084 |
| 29. | Lake Dalecarlia | 14.2% | 5.1%(+9.07)#29 | 7.8%(+6.37)#2,104 |
| 30. | Shorewood Forest | 13.8% | 5.1%(+8.70)#30 | 7.8%(+6.00)#2,216 |
| 31. | Whitestown | 13.5% | 5.1%(+8.32)#31 | 7.8%(+5.62)#2,359 |
| 32. | Foxcliff Estates | 13.5% | 5.1%(+8.30)#32 | 7.8%(+5.60)#2,365 |
| 33. | Homecroft | 13.4% | 5.1%(+8.27)#33 | 7.8%(+5.57)#2,381 |
| 34. | New Palestine | 13.4% | 5.1%(+8.23)#34 | 7.8%(+5.53)#2,392 |
| 35. | Fishersburg | 13.3% | 5.1%(+8.12)#35 | 7.8%(+5.42)#2,439 |
| 36. | Laud | 13.2% | 5.1%(+8.09)#36 | 7.8%(+5.39)#2,455 |
| 37. | Ulen | 13.2% | 5.1%(+8.06)#37 | 7.8%(+5.36)#2,466 |
| 38. | Painted Hills | 13.1% | 5.1%(+7.92)#38 | 7.8%(+5.22)#2,520 |
| 39. | Mccordsville | 13.0% | 5.1%(+7.85)#39 | 7.8%(+5.15)#2,549 |
| 40. | Fishers | 13.0% | 5.1%(+7.81)#40 | 7.8%(+5.11)#2,564 |
| 41. | South Center | 12.8% | 5.1%(+7.67)#41 | 7.8%(+4.97)#2,612 |
| 42. | Johnson | 12.5% | 5.1%(+7.35)#42 | 7.8%(+4.65)#2,756 |
| 43. | Prairie Creek | 12.3% | 5.1%(+7.16)#43 | 7.8%(+4.46)#2,850 |
| 44. | St Meinrad | 12.3% | 5.1%(+7.14)#44 | 7.8%(+4.44)#2,859 |
| 45. | Bargersville | 12.2% | 5.1%(+7.03)#45 | 7.8%(+4.33)#2,914 |
| 46. | Lakewood | 12.1% | 5.1%(+6.94)#46 | 7.8%(+4.24)#2,960 |
| 47. | Rosedale | 12.0% | 5.1%(+6.88)#47 | 7.8%(+4.18)#2,984 |
| 48. | Spurgeon | 11.8% | 5.1%(+6.69)#48 | 7.8%(+3.99)#3,090 |
| 49. | Michiana Shores | 11.6% | 5.1%(+6.45)#49 | 7.8%(+3.75)#3,203 |
| 50. | Country Club Heights | 11.4% | 5.1%(+6.21)#50 | 7.8%(+3.52)#3,322 |
| 51. | Charlottesville | 11.4% | 5.1%(+6.20)#51 | 7.8%(+3.50)#3,326 |
| 52. | Montgomery | 11.3% | 5.1%(+6.18)#52 | 7.8%(+3.48)#3,338 |
| 53. | Ramsey | 11.3% | 5.1%(+6.12)#53 | 7.8%(+3.43)#3,381 |
| 54. | New Trenton | 11.2% | 5.1%(+6.03)#54 | 7.8%(+3.33)#3,418 |
| 55. | Stilesville | 11.0% | 5.1%(+5.88)#55 | 7.8%(+3.18)#3,496 |
| 56. | Union Mills | 11.0% | 5.1%(+5.86)#56 | 7.8%(+3.16)#3,511 |
| 57. | Grandview Lake | 10.9% | 5.1%(+5.77)#57 | 7.8%(+3.07)#3,571 |
| 58. | Dune Acres | 10.9% | 5.1%(+5.75)#58 | 7.8%(+3.05)#3,583 |
| 59. | Lapel | 10.9% | 5.1%(+5.74)#59 | 7.8%(+3.05)#3,585 |
| 60. | Cumberland | 10.8% | 5.1%(+5.62)#60 | 7.8%(+2.92)#3,662 |
| 61. | Fortville | 10.7% | 5.1%(+5.58)#61 | 7.8%(+2.88)#3,694 |
| 62. | Switz City | 10.7% | 5.1%(+5.54)#62 | 7.8%(+2.84)#3,722 |
| 63. | Zionsville | 10.6% | 5.1%(+5.48)#63 | 7.8%(+2.78)#3,762 |
| 64. | Carrollton | 10.4% | 5.1%(+5.25)#64 | 7.8%(+2.55)#3,905 |
| 65. | Ossian | 10.0% | 5.1%(+4.84)#65 | 7.8%(+2.15)#4,170 |
| 66. | Fowler | 9.9% | 5.1%(+4.77)#66 | 7.8%(+2.08)#4,204 |
| 67. | Westfield | 9.9% | 5.1%(+4.73)#67 | 7.8%(+2.03)#4,239 |
| 68. | Haubstadt | 9.8% | 5.1%(+4.62)#68 | 7.8%(+1.93)#4,317 |
| 69. | Lamb | 9.6% | 5.1%(+4.45)#69 | 7.8%(+1.75)#4,442 |
| 70. | Beverly Shores | 9.5% | 5.1%(+4.37)#70 | 7.8%(+1.68)#4,507 |
| 71. | Merriam | 9.5% | 5.1%(+4.34)#71 | 7.8%(+1.64)#4,543 |
| 72. | Harrison Lake | 9.5% | 5.1%(+4.33)#72 | 7.8%(+1.64)#4,547 |
| 73. | Benton | 9.4% | 5.1%(+4.30)#73 | 7.8%(+1.60)#4,571 |
| 74. | Indian Village | 9.3% | 5.1%(+4.11)#74 | 7.8%(+1.41)#4,731 |
| 75. | Clear Lake | 9.1% | 5.1%(+4.00)#75 | 7.8%(+1.30)#4,828 |
| 76. | Flat Rock | 9.1% | 5.1%(+3.94)#76 | 7.8%(+1.24)#4,874 |
| 77. | Martinsville | 9.1% | 5.1%(+3.91)#77 | 7.8%(+1.21)#4,907 |
| 78. | Lawrenceburg | 9.0% | 5.1%(+3.90)#78 | 7.8%(+1.20)#4,924 |
| 79. | Hatfield | 9.0% | 5.1%(+3.84)#79 | 7.8%(+1.14)#4,968 |
| 80. | Edgewood | 9.0% | 5.1%(+3.81)#80 | 7.8%(+1.11)#4,995 |
| 81. | Plainfield | 9.0% | 5.1%(+3.81)#81 | 7.8%(+1.11)#4,997 |
| 82. | Mineral Springs | 8.8% | 5.1%(+3.67)#82 | 7.8%(+0.976)#5,132 |
| 83. | Wynnedale | 8.7% | 5.1%(+3.55)#83 | 7.8%(+0.848)#5,243 |
| 84. | Elberfeld | 8.5% | 5.1%(+3.34)#84 | 7.8%(+0.639)#5,411 |
| 85. | Selma | 8.4% | 5.1%(+3.24)#85 | 7.8%(+0.546)#5,507 |
| 86. | Noblesville | 8.4% | 5.1%(+3.20)#86 | 7.8%(+0.503)#5,541 |
| 87. | Tippecanoe | 8.3% | 5.1%(+3.18)#87 | 7.8%(+0.486)#5,563 |
| 88. | Adams Lake | 8.2% | 5.1%(+3.10)#88 | 7.8%(+0.400)#5,639 |
| 89. | Loogootee | 8.2% | 5.1%(+3.01)#89 | 7.8%(+0.314)#5,720 |
| 90. | Redkey | 8.1% | 5.1%(+2.99)#90 | 7.8%(+0.292)#5,748 |
| 91. | Pottawattamie Park | 8.1% | 5.1%(+2.96)#91 | 7.8%(+0.261)#5,789 |
| 92. | Corydon | 8.1% | 5.1%(+2.96)#92 | 7.8%(+0.259)#5,795 |
| 93. | Aberdeen | 8.1% | 5.1%(+2.90)#93 | 7.8%(+0.207)#5,861 |
| 94. | Battle Ground | 7.9% | 5.1%(+2.80)#94 | 7.8%(+0.099)#5,969 |
| 95. | North Liberty | 7.8% | 5.1%(+2.60)#95 | 7.8%(-0.096)#6,187 |
| 96. | Huntertown | 7.7% | 5.1%(+2.59)#96 | 7.8%(-0.107)#6,194 |
| 97. | Oolitic | 7.7% | 5.1%(+2.59)#97 | 7.8%(-0.109)#6,195 |
| 98. | Lawrence | 7.7% | 5.1%(+2.58)#98 | 7.8%(-0.116)#6,204 |
| 99. | Morristown | 7.6% | 5.1%(+2.49)#99 | 7.8%(-0.204)#6,312 |
| 100. | Notre Dame | 7.5% | 5.1%(+2.38)#100 | 7.8%(-0.314)#6,430 |
Common Questions
What are the Top 10 Cities with the Highest Percentage of Population Employed in Professional & Scientific Services in Indiana?
Top 10 Cities with the Highest Percentage of Population Employed in Professional & Scientific Services in Indiana are:
#1
45.5%
#2
34.5%
#3
32.6%
#4
23.9%
#5
22.9%
#6
22.8%
#7
22.7%
#8
21.8%
#9
21.6%
#10
17.3%
What city has the Highest Percentage of Population Employed in Professional & Scientific Services in Indiana?
Crane has the Highest Percentage of Population Employed in Professional & Scientific Services in Indiana with 45.5%.
What is the Percentage of Population Employed in Professional & Scientific Services in the State of Indiana?
Percentage of Population Employed in Professional & Scientific Services in Indiana is 5.1%.
What is the Percentage of Population Employed in Professional & Scientific Services in the United States?
Percentage of Population Employed in Professional & Scientific Services in the United States is 7.8%.