Zip Codes with the Lowest Costs of Housing as Percentage of Income in Newark, NJ

RELATED REPORTS & OPTIONS

Lowest Housing Costs / Income
Population
Families and Households
Female Fertility
Female Fertility (Unmarried)
Race (Community Size)
Race (Percentage)
Ancestry (Community Size)
AfghanAfricanAlbanianAmericanArabArgentineanArmenianAustrianBarbadianBhutaneseBlackfeetBrazilianBritishBritish West IndianBurmeseCanadianCape VerdeanCentral AmericanCentral American IndianCherokeeChileanColombianCosta RicanCroatianCubanDanishDominicanDutchDutch West IndianEastern EuropeanEcuadorianEgyptianEnglishEthiopianEuropeanFrenchFrench CanadianGermanGhanaianGreekGuatemalanGuyaneseHaitianHonduranHungarianIndian (Asian)IranianIraqiIrishIsraeliItalianJamaicanJordanianKenyanKoreanLaotianLatvianLebaneseLiberianLithuanianMexicanMexican American IndianMongolianMoroccanNicaraguanNigerianNorwegianPakistaniPalestinianPanamanianPeruvianPolishPortuguesePuerto RicanRomanianRussianSalvadoranScandinavianScotch-IrishScottishSenegaleseSierra LeoneanSouth AmericanSpaniardSpanishSri LankanSubsaharan AfricanSwedishThaiTrinidadian and TobagonianTurkishUgandanUkrainianUruguayanVenezuelanVietnameseWelshWest IndianYugoslavian
Ancestry (Percentage)
AfghanAfricanAlbanianAmericanArabArgentineanArmenianAustrianBarbadianBhutaneseBlackfeetBrazilianBritishBritish West IndianBurmeseCanadianCape VerdeanCentral AmericanCentral American IndianCherokeeChileanColombianCosta RicanCroatianCubanDanishDominicanDutchDutch West IndianEastern EuropeanEcuadorianEgyptianEnglishEthiopianEuropeanFrenchFrench CanadianGermanGhanaianGreekGuatemalanGuyaneseHaitianHonduranHungarianIndian (Asian)IranianIraqiIrishIsraeliItalianJamaicanJordanianKenyanKoreanLaotianLatvianLebaneseLiberianLithuanianMexicanMexican American IndianMongolianMoroccanNicaraguanNigerianNorwegianPakistaniPalestinianPanamanianPeruvianPolishPortuguesePuerto RicanRomanianRussianSalvadoranScandinavianScotch-IrishScottishSenegaleseSierra LeoneanSouth AmericanSpaniardSpanishSri LankanSubsaharan AfricanSwedishThaiTrinidadian and TobagonianTurkishUgandanUkrainianUruguayanVenezuelanVietnameseWelshWest IndianYugoslavian
Immigrant Origin (Total)
Immigrant Origin (Percentage)
Income
Income (Families)
Income (Households)
Poverty
Poverty (Families)
Unemployment
Employment Occupations
Employment Industries
Employer Class
Commute Time
Commute Means
School Enrollment
Education by Degree Field
Occupancy
Finances
Physical Characteristics
Newark
Compare Zip Codes
Comparison Subject

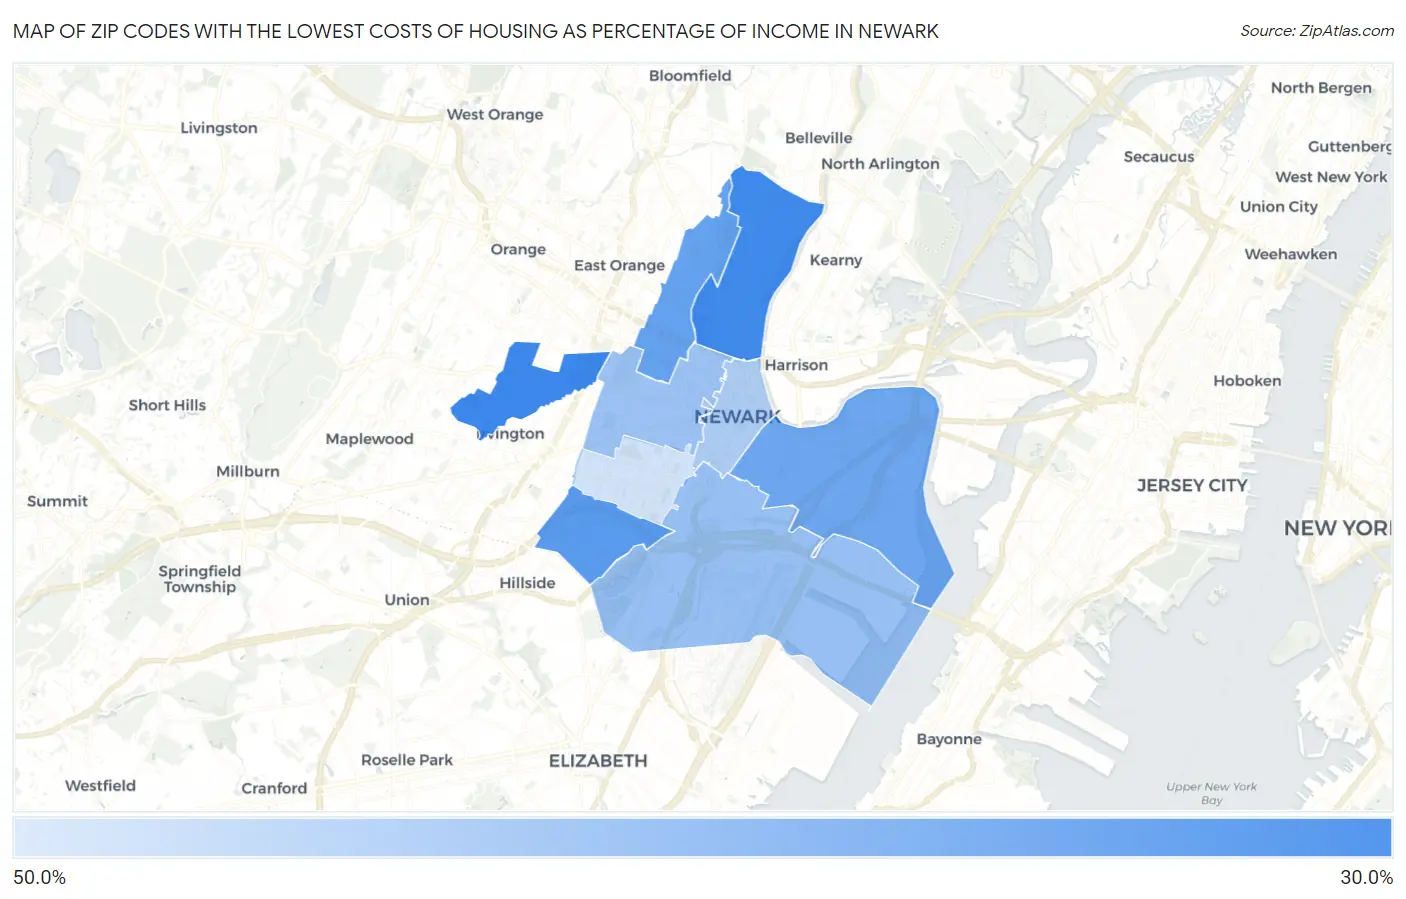
Map of Zip Codes with the Lowest Costs of Housing as Percentage of Income in Newark

50.0%
0.0%
Zip Codes with the Lowest Costs of Housing as Percentage of Income in Newark Map

Zip Codes with the Lowest Costs of Housing as Percentage of Income in Newark, NJ

Zip Code Housing Costs / Income vs State vs National
1.0710631.7%22.5%(+9.24)#53320.4%(+11.3)#29,363
2.0710432.0%22.5%(+9.57)#53520.4%(+11.7)#29,400
3.0711234.0%22.5%(+11.5)#54320.4%(+13.6)#29,598
4.0710734.8%22.5%(+12.3)#54520.4%(+14.4)#29,646
5.0710535.3%22.5%(+12.9)#54820.4%(+15.0)#29,682
6.0711438.5%22.5%(+16.1)#55720.4%(+18.1)#29,802
7.0710338.8%22.5%(+16.3)#55820.4%(+18.4)#29,814
8.0710240.1%22.5%(+17.6)#55920.4%(+19.7)#29,848
9.0710843.0%22.5%(+20.5)#56120.4%(+22.6)#29,909

Common Questions

What are the Top 5 Zip Codes with the Lowest Costs of Housing as Percentage of Income in Newark, NJ?
Top 5 Zip Codes with the Lowest Costs of Housing as Percentage of Income in Newark, NJ are:
#1
31.7%
#2
32.0%
#3
34.0%
#4
34.8%
#5
35.3%
What zip code has the Lowest Costs of Housing as Percentage of Income in Newark, NJ?
07106 has the Lowest Costs of Housing as Percentage of Income in Newark, NJ with 31.7%.
What is the Average Housing Costs as Percentage of Income in Newark, NJ?
Average Housing Costs as Percentage of Income in Newark is 35.3%.
What is the Average Housing Costs as Percentage of Income in New Jersey?
Average Housing Costs as Percentage of Income in New Jersey is 22.5%.
What is the Average Housing Costs as Percentage of Income in the United States?
Average Housing Costs as Percentage of Income in the United States is 20.4%.