Cities with the Lowest Costs of Housing as Percentage of Income in Georgia
RELATED REPORTS & OPTIONS
Lowest Housing Costs / Income
Georgia
Compare Cities
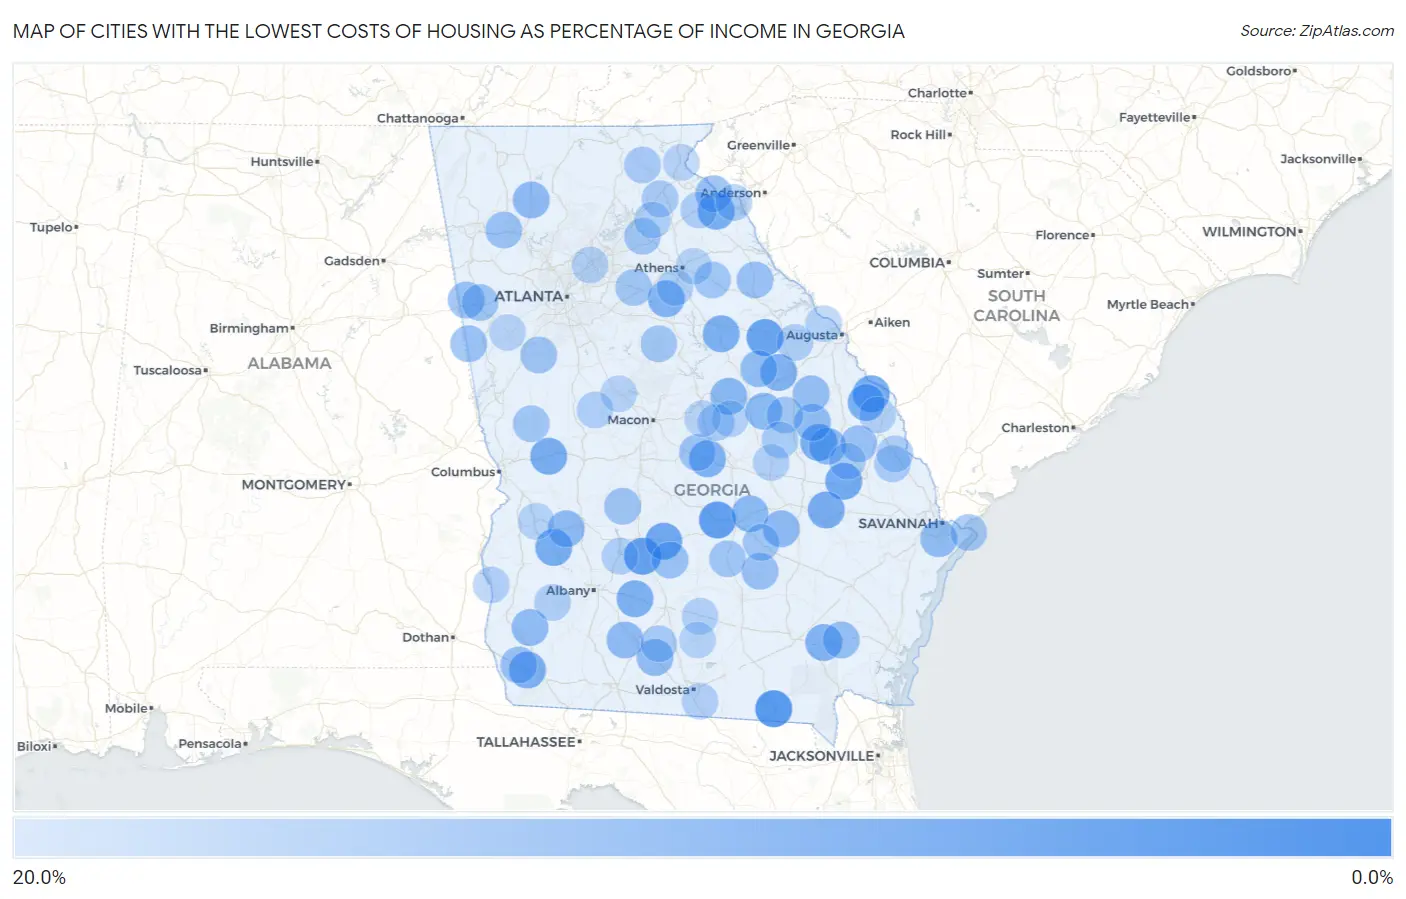
Map of Cities with the Lowest Costs of Housing as Percentage of Income in Georgia
20.0%
0.0%
Cities with the Lowest Costs of Housing as Percentage of Income in Georgia
| City | Housing Costs / Income | vs State | vs National | |
| 1. | Dixie | 2.8% | 20.4%(-17.6)#1 | 20.4%(-17.6)#5 |
| 2. | Smarr | 3.7% | 20.4%(-16.7)#2 | 20.4%(-16.7)#25 |
| 3. | Fargo | 6.0% | 20.4%(-14.4)#3 | 20.4%(-14.3)#167 |
| 4. | Axson | 6.2% | 20.4%(-14.2)#4 | 20.4%(-14.2)#191 |
| 5. | Chauncey | 6.9% | 20.4%(-13.5)#5 | 20.4%(-13.4)#325 |
| 6. | Arabi | 7.5% | 20.4%(-12.9)#6 | 20.4%(-12.9)#425 |
| 7. | Camak | 7.8% | 20.4%(-12.6)#7 | 20.4%(-12.6)#519 |
| 8. | Pitts | 8.4% | 20.4%(-12.0)#8 | 20.4%(-11.9)#705 |
| 9. | Girard | 8.9% | 20.4%(-11.5)#9 | 20.4%(-11.5)#840 |
| 10. | Pulaski | 9.0% | 20.4%(-11.5)#10 | 20.4%(-11.4)#877 |
| 11. | Parrott | 9.2% | 20.4%(-11.2)#11 | 20.4%(-11.2)#964 |
| 12. | Collins | 9.3% | 20.4%(-11.1)#12 | 20.4%(-11.1)#1,012 |
| 13. | Geneva | 9.4% | 20.4%(-11.1)#13 | 20.4%(-11.0)#1,058 |
| 14. | Bowersville | 9.4% | 20.4%(-11.0)#14 | 20.4%(-11.0)#1,084 |
| 15. | Canoochee | 9.4% | 20.4%(-11.0)#15 | 20.4%(-10.9)#1,107 |
| 16. | Sardis | 9.5% | 20.4%(-11.0)#16 | 20.4%(-10.9)#1,116 |
| 17. | White Plains | 9.7% | 20.4%(-10.7)#17 | 20.4%(-10.7)#1,233 |
| 18. | Brinson | 9.7% | 20.4%(-10.7)#18 | 20.4%(-10.7)#1,235 |
| 19. | Montrose | 9.8% | 20.4%(-10.6)#19 | 20.4%(-10.6)#1,304 |
| 20. | Poulan | 9.9% | 20.4%(-10.5)#20 | 20.4%(-10.5)#1,363 |
| 21. | Avera | 10.1% | 20.4%(-10.3)#21 | 20.4%(-10.3)#1,458 |
| 22. | Bostwick | 10.2% | 20.4%(-10.2)#22 | 20.4%(-10.1)#1,549 |
| 23. | Hoboken | 10.3% | 20.4%(-10.2)#23 | 20.4%(-10.1)#1,559 |
| 24. | Rock Spring | 10.9% | 20.4%(-9.51)#24 | 20.4%(-9.47)#2,018 |
| 25. | Deepstep | 11.0% | 20.4%(-9.45)#25 | 20.4%(-9.41)#2,072 |
| 26. | Alamo | 11.2% | 20.4%(-9.25)#26 | 20.4%(-9.21)#2,216 |
| 27. | Riddleville | 11.2% | 20.4%(-9.24)#27 | 20.4%(-9.20)#2,225 |
| 28. | Fairmount | 11.3% | 20.4%(-9.11)#28 | 20.4%(-9.07)#2,335 |
| 29. | Plains | 11.3% | 20.4%(-9.09)#29 | 20.4%(-9.05)#2,348 |
| 30. | Uvalda | 11.3% | 20.4%(-9.08)#30 | 20.4%(-9.04)#2,366 |
| 31. | Garfield | 11.4% | 20.4%(-9.05)#31 | 20.4%(-9.01)#2,397 |
| 32. | Funston | 11.7% | 20.4%(-8.75)#32 | 20.4%(-8.71)#2,674 |
| 33. | Mitchell | 11.7% | 20.4%(-8.71)#33 | 20.4%(-8.67)#2,713 |
| 34. | Damascus | 11.8% | 20.4%(-8.62)#34 | 20.4%(-8.58)#2,815 |
| 35. | Vernonburg | 11.8% | 20.4%(-8.58)#35 | 20.4%(-8.54)#2,859 |
| 36. | Berlin | 11.8% | 20.4%(-8.58)#36 | 20.4%(-8.54)#2,865 |
| 37. | Midville | 11.9% | 20.4%(-8.55)#37 | 20.4%(-8.51)#2,899 |
| 38. | Wildwood | 12.0% | 20.4%(-8.42)#38 | 20.4%(-8.38)#3,030 |
| 39. | Dixie Union | 12.1% | 20.4%(-8.31)#39 | 20.4%(-8.27)#3,130 |
| 40. | Vidette | 12.1% | 20.4%(-8.31)#40 | 20.4%(-8.27)#3,131 |
| 41. | Sterling | 12.1% | 20.4%(-8.29)#41 | 20.4%(-8.25)#3,150 |
| 42. | Nahunta | 12.2% | 20.4%(-8.25)#42 | 20.4%(-8.21)#3,200 |
| 43. | Iron City | 12.3% | 20.4%(-8.08)#43 | 20.4%(-8.04)#3,392 |
| 44. | Tallapoosa | 12.4% | 20.4%(-8.07)#44 | 20.4%(-8.03)#3,410 |
| 45. | Gumlog | 12.4% | 20.4%(-8.07)#45 | 20.4%(-8.02)#3,412 |
| 46. | Rocky Ford | 12.4% | 20.4%(-8.01)#46 | 20.4%(-7.97)#3,469 |
| 47. | Denton | 12.4% | 20.4%(-8.00)#47 | 20.4%(-7.96)#3,484 |
| 48. | Ephesus | 12.5% | 20.4%(-7.89)#48 | 20.4%(-7.85)#3,622 |
| 49. | Tignall | 12.5% | 20.4%(-7.88)#49 | 20.4%(-7.84)#3,633 |
| 50. | Kingston | 12.6% | 20.4%(-7.82)#50 | 20.4%(-7.78)#3,710 |
| 51. | Clyattville | 12.6% | 20.4%(-7.79)#51 | 20.4%(-7.75)#3,738 |
| 52. | Rebecca | 12.7% | 20.4%(-7.76)#52 | 20.4%(-7.72)#3,772 |
| 53. | Danville | 12.8% | 20.4%(-7.66)#53 | 20.4%(-7.62)#3,888 |
| 54. | Turin | 12.9% | 20.4%(-7.48)#54 | 20.4%(-7.44)#4,106 |
| 55. | Byromville | 13.1% | 20.4%(-7.31)#55 | 20.4%(-7.27)#4,330 |
| 56. | Bremen | 13.1% | 20.4%(-7.30)#56 | 20.4%(-7.26)#4,344 |
| 57. | Waynesville | 13.2% | 20.4%(-7.23)#57 | 20.4%(-7.19)#4,429 |
| 58. | Lumber City | 13.2% | 20.4%(-7.17)#58 | 20.4%(-7.13)#4,539 |
| 59. | Lexington | 13.3% | 20.4%(-7.15)#59 | 20.4%(-7.11)#4,565 |
| 60. | Talmo | 13.3% | 20.4%(-7.13)#60 | 20.4%(-7.09)#4,585 |
| 61. | Jacksonville | 13.3% | 20.4%(-7.08)#61 | 20.4%(-7.04)#4,660 |
| 62. | Between | 13.4% | 20.4%(-7.03)#62 | 20.4%(-6.99)#4,731 |
| 63. | Tybee Island | 13.4% | 20.4%(-7.01)#63 | 20.4%(-6.96)#4,760 |
| 64. | Shiloh | 13.5% | 20.4%(-6.94)#64 | 20.4%(-6.90)#4,848 |
| 65. | Shady Dale | 13.5% | 20.4%(-6.92)#65 | 20.4%(-6.88)#4,902 |
| 66. | Bartow | 13.5% | 20.4%(-6.89)#66 | 20.4%(-6.85)#4,926 |
| 67. | Godfrey | 13.8% | 20.4%(-6.66)#67 | 20.4%(-6.62)#5,298 |
| 68. | Echols County Consolidated Government | 13.9% | 20.4%(-6.53)#68 | 20.4%(-6.49)#5,489 |
| 69. | Oliver | 14.0% | 20.4%(-6.41)#69 | 20.4%(-6.37)#5,671 |
| 70. | Ellenton | 14.0% | 20.4%(-6.39)#70 | 20.4%(-6.35)#5,707 |
| 71. | Alto | 14.0% | 20.4%(-6.37)#71 | 20.4%(-6.33)#5,749 |
| 72. | Helen | 14.1% | 20.4%(-6.36)#72 | 20.4%(-6.32)#5,759 |
| 73. | Toomsboro | 14.1% | 20.4%(-6.28)#73 | 20.4%(-6.24)#5,924 |
| 74. | Kite | 14.3% | 20.4%(-6.14)#74 | 20.4%(-6.09)#6,170 |
| 75. | Dearing | 14.5% | 20.4%(-5.96)#75 | 20.4%(-5.92)#6,456 |
| 76. | Carnesville | 14.5% | 20.4%(-5.92)#76 | 20.4%(-5.88)#6,525 |
| 77. | West Brow | 14.5% | 20.4%(-5.91)#77 | 20.4%(-5.87)#6,539 |
| 78. | Newington | 14.5% | 20.4%(-5.89)#78 | 20.4%(-5.84)#6,581 |
| 79. | Reed Creek | 14.5% | 20.4%(-5.88)#79 | 20.4%(-5.84)#6,595 |
| 80. | Portal | 14.7% | 20.4%(-5.72)#80 | 20.4%(-5.68)#6,851 |
| 81. | Warwick | 14.7% | 20.4%(-5.71)#81 | 20.4%(-5.67)#6,865 |
| 82. | Leary | 14.7% | 20.4%(-5.70)#82 | 20.4%(-5.66)#6,886 |
| 83. | Yatesville | 14.8% | 20.4%(-5.61)#83 | 20.4%(-5.57)#7,044 |
| 84. | Bishop | 14.8% | 20.4%(-5.61)#84 | 20.4%(-5.57)#7,046 |
| 85. | Dasher | 14.8% | 20.4%(-5.59)#85 | 20.4%(-5.55)#7,089 |
| 86. | Alapaha | 14.8% | 20.4%(-5.59)#86 | 20.4%(-5.54)#7,092 |
| 87. | Berkeley Lake | 14.9% | 20.4%(-5.56)#87 | 20.4%(-5.52)#7,138 |
| 88. | Adrian | 14.9% | 20.4%(-5.53)#88 | 20.4%(-5.49)#7,190 |
| 89. | Fort Gaines | 14.9% | 20.4%(-5.48)#89 | 20.4%(-5.44)#7,276 |
| 90. | Gillsville | 15.0% | 20.4%(-5.46)#90 | 20.4%(-5.42)#7,309 |
| 91. | Hiltonia | 15.0% | 20.4%(-5.46)#91 | 20.4%(-5.42)#7,313 |
| 92. | Evans | 15.0% | 20.4%(-5.39)#92 | 20.4%(-5.35)#7,451 |
| 93. | Winterville | 15.1% | 20.4%(-5.35)#93 | 20.4%(-5.31)#7,518 |
| 94. | Nashville | 15.1% | 20.4%(-5.33)#94 | 20.4%(-5.29)#7,557 |
| 95. | Oconee | 15.2% | 20.4%(-5.20)#95 | 20.4%(-5.15)#7,814 |
| 96. | Richland | 15.2% | 20.4%(-5.19)#96 | 20.4%(-5.15)#7,824 |
| 97. | Mcintyre | 15.2% | 20.4%(-5.18)#97 | 20.4%(-5.14)#7,845 |
| 98. | Forsyth | 15.3% | 20.4%(-5.12)#98 | 20.4%(-5.08)#7,945 |
| 99. | Whitesburg | 15.3% | 20.4%(-5.11)#99 | 20.4%(-5.07)#7,962 |
| 100. | Tallulah Falls | 15.3% | 20.4%(-5.08)#100 | 20.4%(-5.04)#8,026 |
Common Questions
What are the Top 10 Cities with the Lowest Costs of Housing as Percentage of Income in Georgia?
Top 10 Cities with the Lowest Costs of Housing as Percentage of Income in Georgia are:
What city has the Lowest Costs of Housing as Percentage of Income in Georgia?
Fargo has the Lowest Costs of Housing as Percentage of Income in Georgia with 6.0%.
What is the Average Housing Costs as Percentage of Income in the State of Georgia?
Average Housing Costs as Percentage of Income in Georgia is 20.4%.
What is the Average Housing Costs as Percentage of Income in the United States?
Average Housing Costs as Percentage of Income in the United States is 20.4%.