Cities with the Lowest Costs of Housing as Percentage of Income in Vermont
RELATED REPORTS & OPTIONS
Lowest Housing Costs / Income
Vermont
Compare Cities
Map of Cities with the Lowest Costs of Housing as Percentage of Income in Vermont
25.0%
0.0%
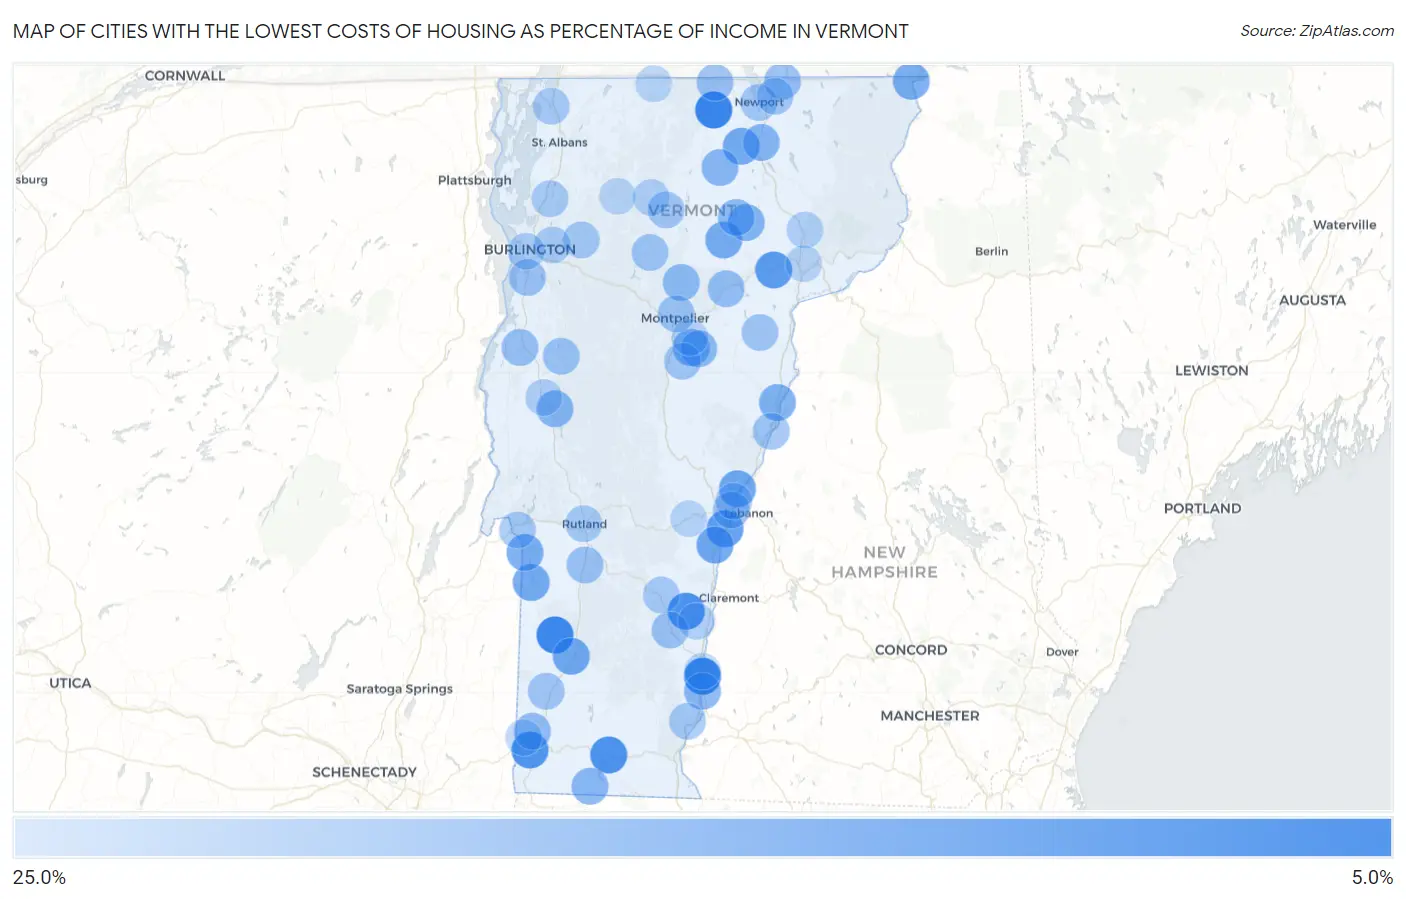
Cities with the Lowest Costs of Housing as Percentage of Income in Vermont
| City | Housing Costs / Income | vs State | vs National | |
| 1. | Troy | 8.5% | 20.9%(-12.5)#1 | 20.4%(-11.9)#719 |
| 2. | North Westminster | 8.8% | 20.9%(-12.1)#2 | 20.4%(-11.6)#825 |
| 3. | Dorset | 8.9% | 20.9%(-12.0)#3 | 20.4%(-11.5)#848 |
| 4. | North Springfield | 10.9% | 20.9%(-9.99)#4 | 20.4%(-9.44)#2,044 |
| 5. | Wilmington | 11.1% | 20.9%(-9.87)#5 | 20.4%(-9.32)#2,134 |
| 6. | Bolton | 11.1% | 20.9%(-9.87)#6 | 20.4%(-9.31)#2,141 |
| 7. | Old Bennington | 11.6% | 20.9%(-9.37)#7 | 20.4%(-8.81)#2,575 |
| 8. | Sutton | 12.0% | 20.9%(-8.89)#8 | 20.4%(-8.33)#3,071 |
| 9. | Danville | 12.8% | 20.9%(-8.16)#9 | 20.4%(-7.60)#3,909 |
| 10. | Pownal | 12.8% | 20.9%(-8.12)#10 | 20.4%(-7.56)#3,963 |
| 11. | South Lincoln | 12.9% | 20.9%(-8.05)#11 | 20.4%(-7.50)#4,040 |
| 12. | Huntington Center | 13.2% | 20.9%(-7.78)#12 | 20.4%(-7.22)#4,387 |
| 13. | North Hartland | 13.3% | 20.9%(-7.61)#13 | 20.4%(-7.06)#4,628 |
| 14. | New Haven | 13.8% | 20.9%(-7.11)#14 | 20.4%(-6.55)#5,402 |
| 15. | North Pownal | 14.0% | 20.9%(-6.92)#15 | 20.4%(-6.37)#5,679 |
| 16. | Norwich | 14.9% | 20.9%(-6.02)#16 | 20.4%(-5.47)#7,239 |
| 17. | Hartland | 15.0% | 20.9%(-5.93)#17 | 20.4%(-5.37)#7,409 |
| 18. | Danby | 15.1% | 20.9%(-5.87)#18 | 20.4%(-5.32)#7,512 |
| 19. | Manchester Center | 15.2% | 20.9%(-5.76)#19 | 20.4%(-5.21)#7,701 |
| 20. | Pownal Center | 15.5% | 20.9%(-5.41)#20 | 20.4%(-4.86)#8,399 |
| 21. | Wells | 15.6% | 20.9%(-5.37)#21 | 20.4%(-4.81)#8,502 |
| 22. | Sheffield | 15.6% | 20.9%(-5.37)#22 | 20.4%(-4.81)#8,506 |
| 23. | Irasburg | 15.7% | 20.9%(-5.23)#23 | 20.4%(-4.67)#8,769 |
| 24. | Hardwick | 15.8% | 20.9%(-5.09)#24 | 20.4%(-4.53)#9,042 |
| 25. | Poultney | 16.0% | 20.9%(-4.95)#25 | 20.4%(-4.39)#9,357 |
| 26. | St. George | 16.0% | 20.9%(-4.91)#26 | 20.4%(-4.35)#9,427 |
| 27. | Canaan | 16.1% | 20.9%(-4.82)#27 | 20.4%(-4.27)#9,616 |
| 28. | Westford | 16.1% | 20.9%(-4.80)#28 | 20.4%(-4.24)#9,681 |
| 29. | Londonderry | 16.7% | 20.9%(-4.19)#29 | 20.4%(-3.64)#11,045 |
| 30. | South Barre | 16.8% | 20.9%(-4.17)#30 | 20.4%(-3.62)#11,090 |
| 31. | Bradford | 16.8% | 20.9%(-4.17)#31 | 20.4%(-3.61)#11,099 |
| 32. | North Clarendon | 17.0% | 20.9%(-3.88)#32 | 20.4%(-3.33)#11,726 |
| 33. | Highgate Center | 17.2% | 20.9%(-3.69)#33 | 20.4%(-3.14)#12,127 |
| 34. | Greensboro Bend | 17.3% | 20.9%(-3.63)#34 | 20.4%(-3.07)#12,281 |
| 35. | Chittenden | 17.6% | 20.9%(-3.30)#35 | 20.4%(-2.75)#13,000 |
| 36. | Bolton Valley | 17.8% | 20.9%(-3.14)#36 | 20.4%(-2.58)#13,377 |
| 37. | East Middlebury | 17.9% | 20.9%(-2.99)#37 | 20.4%(-2.44)#13,676 |
| 38. | Orleans | 18.0% | 20.9%(-2.98)#38 | 20.4%(-2.42)#13,704 |
| 39. | Westminster | 18.2% | 20.9%(-2.73)#39 | 20.4%(-2.17)#14,281 |
| 40. | Readsboro | 18.2% | 20.9%(-2.70)#40 | 20.4%(-2.14)#14,340 |
| 41. | Albany | 18.2% | 20.9%(-2.68)#41 | 20.4%(-2.13)#14,371 |
| 42. | Websterville | 18.3% | 20.9%(-2.65)#42 | 20.4%(-2.10)#14,453 |
| 43. | Huntington | 18.4% | 20.9%(-2.49)#43 | 20.4%(-1.93)#14,845 |
| 44. | Worcester | 18.6% | 20.9%(-2.32)#44 | 20.4%(-1.76)#15,234 |
| 45. | Harmonyville | 18.7% | 20.9%(-2.25)#45 | 20.4%(-1.70)#15,377 |
| 46. | Greensboro | 18.7% | 20.9%(-2.21)#46 | 20.4%(-1.66)#15,476 |
| 47. | Stamford | 19.1% | 20.9%(-1.81)#47 | 20.4%(-1.25)#16,282 |
| 48. | Proctor | 19.2% | 20.9%(-1.74)#48 | 20.4%(-1.19)#16,418 |
| 49. | South Shaftsbury | 19.2% | 20.9%(-1.68)#49 | 20.4%(-1.13)#16,610 |
| 50. | Wolcott | 19.5% | 20.9%(-1.40)#50 | 20.4%(-0.845)#17,185 |
| 51. | Marshfield | 19.6% | 20.9%(-1.38)#51 | 20.4%(-0.821)#17,247 |
| 52. | Derby Line | 19.6% | 20.9%(-1.34)#52 | 20.4%(-0.787)#17,331 |
| 53. | North Hyde Park | 19.6% | 20.9%(-1.34)#53 | 20.4%(-0.781)#17,350 |
| 54. | Bakersfield | 19.7% | 20.9%(-1.20)#54 | 20.4%(-0.644)#17,608 |
| 55. | Vergennes | 19.9% | 20.9%(-1.01)#55 | 20.4%(-0.456)#17,982 |
| 56. | Shelburne | 20.1% | 20.9%(-0.855)#56 | 20.4%(-0.300)#18,259 |
| 57. | White River Junction | 20.1% | 20.9%(-0.811)#57 | 20.4%(-0.256)#18,343 |
| 58. | Wallingford | 20.2% | 20.9%(-0.780)#58 | 20.4%(-0.224)#18,382 |
| 59. | Middletown Springs | 20.2% | 20.9%(-0.753)#59 | 20.4%(-0.197)#18,441 |
| 60. | North Troy | 20.2% | 20.9%(-0.751)#60 | 20.4%(-0.196)#18,445 |
| 61. | Chester | 20.2% | 20.9%(-0.731)#61 | 20.4%(-0.175)#18,485 |
| 62. | Algiers | 20.2% | 20.9%(-0.709)#62 | 20.4%(-0.153)#18,529 |
| 63. | Bristol | 20.3% | 20.9%(-0.606)#63 | 20.4%(-0.051)#18,736 |
| 64. | Montpelier | 20.5% | 20.9%(-0.428)#64 | 20.4%(+0.128)#19,038 |
| 65. | Stowe | 20.6% | 20.9%(-0.313)#65 | 20.4%(+0.243)#19,255 |
| 66. | Fairlee | 20.7% | 20.9%(-0.232)#66 | 20.4%(+0.324)#19,409 |
| 67. | South Hero | 20.8% | 20.9%(-0.143)#67 | 20.4%(+0.413)#19,564 |
| 68. | Groton | 20.8% | 20.9%(-0.116)#68 | 20.4%(+0.439)#19,599 |
| 69. | Hyde Park | 20.9% | 20.9%(-0.020)#69 | 20.4%(+0.536)#19,739 |
| 70. | Arlington | 21.0% | 20.9%(+0.028)#70 | 20.4%(+0.584)#19,831 |
| 71. | Williamstown | 21.0% | 20.9%(+0.072)#71 | 20.4%(+0.628)#19,916 |
| 72. | Newport | 21.1% | 20.9%(+0.160)#72 | 20.4%(+0.716)#20,071 |
| 73. | Derby Center | 21.2% | 20.9%(+0.241)#73 | 20.4%(+0.797)#20,193 |
| 74. | Hanksville | 21.2% | 20.9%(+0.294)#74 | 20.4%(+0.850)#20,277 |
| 75. | Jericho | 21.4% | 20.9%(+0.470)#75 | 20.4%(+1.03)#20,566 |
| 76. | Castleton Four Corners | 21.4% | 20.9%(+0.475)#76 | 20.4%(+1.03)#20,572 |
| 77. | Putney | 21.5% | 20.9%(+0.561)#77 | 20.4%(+1.12)#20,697 |
| 78. | Fair Haven | 21.6% | 20.9%(+0.626)#78 | 20.4%(+1.18)#20,805 |
| 79. | Proctorsville | 21.6% | 20.9%(+0.717)#79 | 20.4%(+1.27)#20,936 |
| 80. | Swanton | 21.7% | 20.9%(+0.774)#80 | 20.4%(+1.33)#21,020 |
| 81. | Rutland | 21.8% | 20.9%(+0.861)#81 | 20.4%(+1.42)#21,133 |
| 82. | Wardsboro | 21.8% | 20.9%(+0.912)#82 | 20.4%(+1.47)#21,196 |
| 83. | Essex Junction | 21.9% | 20.9%(+0.959)#83 | 20.4%(+1.51)#21,268 |
| 84. | Gilman | 21.9% | 20.9%(+0.995)#84 | 20.4%(+1.55)#21,322 |
| 85. | Wilder | 22.0% | 20.9%(+1.03)#85 | 20.4%(+1.59)#21,375 |
| 86. | Milton | 22.0% | 20.9%(+1.12)#86 | 20.4%(+1.67)#21,492 |
| 87. | East Poultney | 22.2% | 20.9%(+1.27)#87 | 20.4%(+1.83)#21,718 |
| 88. | South Burlington | 22.4% | 20.9%(+1.51)#88 | 20.4%(+2.07)#22,055 |
| 89. | Johnson | 22.6% | 20.9%(+1.69)#89 | 20.4%(+2.25)#22,253 |
| 90. | Lyndonville | 22.7% | 20.9%(+1.78)#90 | 20.4%(+2.34)#22,381 |
| 91. | Middlebury | 22.8% | 20.9%(+1.85)#91 | 20.4%(+2.41)#22,471 |
| 92. | Springfield | 23.3% | 20.9%(+2.39)#92 | 20.4%(+2.94)#23,087 |
| 93. | Killington | 23.4% | 20.9%(+2.48)#93 | 20.4%(+3.03)#23,176 |
| 94. | Woodstock | 23.4% | 20.9%(+2.48)#94 | 20.4%(+3.04)#23,183 |
| 95. | North Bennington | 23.6% | 20.9%(+2.63)#95 | 20.4%(+3.19)#23,341 |
| 96. | Richford | 23.6% | 20.9%(+2.67)#96 | 20.4%(+3.22)#23,367 |
| 97. | Bellows Falls | 23.6% | 20.9%(+2.70)#97 | 20.4%(+3.26)#23,402 |
| 98. | St Johnsbury | 23.6% | 20.9%(+2.70)#98 | 20.4%(+3.26)#23,408 |
| 99. | Barre | 23.7% | 20.9%(+2.80)#99 | 20.4%(+3.36)#23,516 |
| 100. | Jeffersonville | 23.7% | 20.9%(+2.81)#100 | 20.4%(+3.36)#23,521 |
1
2Common Questions
What are the Top 10 Cities with the Lowest Costs of Housing as Percentage of Income in Vermont?
Top 10 Cities with the Lowest Costs of Housing as Percentage of Income in Vermont are:
#1
8.5%
#2
8.8%
#3
8.9%
#4
10.9%
#5
11.1%
#6
11.6%
#7
12.8%
#8
13.3%
#9
14.9%
#10
15.0%
What city has the Lowest Costs of Housing as Percentage of Income in Vermont?
Troy has the Lowest Costs of Housing as Percentage of Income in Vermont with 8.5%.
What is the Average Housing Costs as Percentage of Income in the State of Vermont?
Average Housing Costs as Percentage of Income in Vermont is 20.9%.
What is the Average Housing Costs as Percentage of Income in the United States?
Average Housing Costs as Percentage of Income in the United States is 20.4%.