Cities with the Lowest Costs of Housing as Percentage of Income in Ohio
RELATED REPORTS & OPTIONS
Lowest Housing Costs / Income
Ohio
Compare Cities
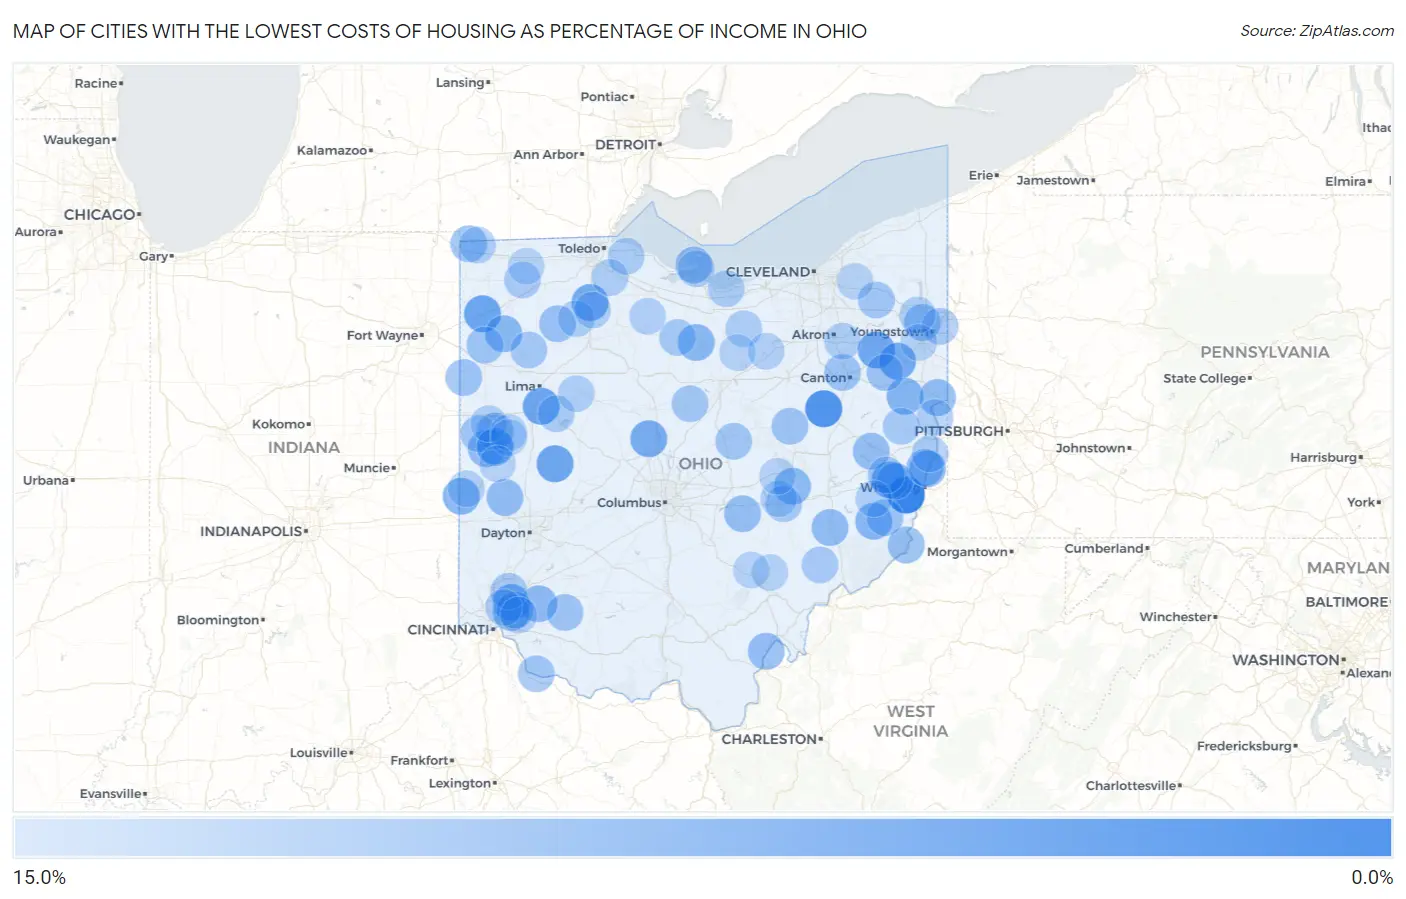
Map of Cities with the Lowest Costs of Housing as Percentage of Income in Ohio
15.0%
0.0%
Cities with the Lowest Costs of Housing as Percentage of Income in Ohio
| City | Housing Costs / Income | vs State | vs National | |
| 1. | Glencoe | 3.0% | 17.9%(-14.9)#1 | 20.4%(-17.4)#9 |
| 2. | Dundee | 4.8% | 17.9%(-13.1)#2 | 20.4%(-15.5)#67 |
| 3. | Cecil | 6.7% | 17.9%(-11.2)#3 | 20.4%(-13.7)#277 |
| 4. | Uniopolis | 6.8% | 17.9%(-11.1)#4 | 20.4%(-13.6)#297 |
| 5. | Rosewood | 6.8% | 17.9%(-11.1)#5 | 20.4%(-13.5)#302 |
| 6. | Limaville | 7.1% | 17.9%(-10.9)#6 | 20.4%(-13.3)#343 |
| 7. | Lafferty | 7.2% | 17.9%(-10.7)#7 | 20.4%(-13.1)#383 |
| 8. | Damascus | 7.3% | 17.9%(-10.6)#8 | 20.4%(-13.1)#394 |
| 9. | Rudolph | 7.5% | 17.9%(-10.4)#9 | 20.4%(-12.9)#430 |
| 10. | Radnor | 7.6% | 17.9%(-10.4)#10 | 20.4%(-12.8)#449 |
| 11. | Maria Stein | 8.0% | 17.9%(-9.96)#11 | 20.4%(-12.4)#558 |
| 12. | Hollansburg | 8.3% | 17.9%(-9.64)#12 | 20.4%(-12.1)#648 |
| 13. | Brecon | 8.4% | 17.9%(-9.55)#13 | 20.4%(-12.0)#675 |
| 14. | Summitville | 8.5% | 17.9%(-9.41)#14 | 20.4%(-11.9)#728 |
| 15. | Bannock | 8.5% | 17.9%(-9.38)#15 | 20.4%(-11.8)#741 |
| 16. | Miltonsburg | 8.6% | 17.9%(-9.34)#16 | 20.4%(-11.8)#753 |
| 17. | Melrose | 8.7% | 17.9%(-9.21)#17 | 20.4%(-11.7)#787 |
| 18. | Celeryville | 8.8% | 17.9%(-9.15)#18 | 20.4%(-11.6)#810 |
| 19. | Adamsville | 9.0% | 17.9%(-8.95)#19 | 20.4%(-11.4)#882 |
| 20. | Pleasant Plain | 9.1% | 17.9%(-8.83)#20 | 20.4%(-11.3)#929 |
| 21. | North Star | 9.2% | 17.9%(-8.74)#21 | 20.4%(-11.2)#966 |
| 22. | Connorville | 9.2% | 17.9%(-8.74)#22 | 20.4%(-11.2)#967 |
| 23. | Rayland | 9.3% | 17.9%(-8.65)#23 | 20.4%(-11.1)#1,001 |
| 24. | Glenmoor | 9.3% | 17.9%(-8.61)#24 | 20.4%(-11.1)#1,022 |
| 25. | Yorkshire | 9.3% | 17.9%(-8.61)#25 | 20.4%(-11.1)#1,023 |
| 26. | Belle Valley | 9.3% | 17.9%(-8.61)#26 | 20.4%(-11.1)#1,027 |
| 27. | Concorde Hills | 9.3% | 17.9%(-8.58)#27 | 20.4%(-11.0)#1,041 |
| 28. | Laura | 9.4% | 17.9%(-8.50)#28 | 20.4%(-11.0)#1,089 |
| 29. | Cheshire | 9.5% | 17.9%(-8.41)#29 | 20.4%(-10.9)#1,137 |
| 30. | Glenford | 9.6% | 17.9%(-8.31)#30 | 20.4%(-10.8)#1,182 |
| 31. | Deersville | 9.6% | 17.9%(-8.30)#31 | 20.4%(-10.8)#1,190 |
| 32. | Lakeside | 9.7% | 17.9%(-8.26)#32 | 20.4%(-10.7)#1,208 |
| 33. | Hannibal | 9.7% | 17.9%(-8.24)#33 | 20.4%(-10.7)#1,221 |
| 34. | Newport Cdp Washington County | 9.8% | 17.9%(-8.14)#34 | 20.4%(-10.6)#1,273 |
| 35. | Belmore | 9.8% | 17.9%(-8.13)#35 | 20.4%(-10.6)#1,275 |
| 36. | Remington | 9.8% | 17.9%(-8.12)#36 | 20.4%(-10.6)#1,293 |
| 37. | Bidwell | 9.8% | 17.9%(-8.09)#37 | 20.4%(-10.6)#1,318 |
| 38. | Nankin | 10.0% | 17.9%(-7.95)#38 | 20.4%(-10.4)#1,394 |
| 39. | Hilltop | 10.0% | 17.9%(-7.94)#39 | 20.4%(-10.4)#1,396 |
| 40. | Nettle Lake | 10.0% | 17.9%(-7.93)#40 | 20.4%(-10.4)#1,404 |
| 41. | Wren | 10.0% | 17.9%(-7.88)#41 | 20.4%(-10.3)#1,429 |
| 42. | Hills And Dales | 10.0% | 17.9%(-7.87)#42 | 20.4%(-10.3)#1,433 |
| 43. | Haviland | 10.1% | 17.9%(-7.78)#43 | 20.4%(-10.2)#1,486 |
| 44. | Wilson | 10.1% | 17.9%(-7.77)#44 | 20.4%(-10.2)#1,497 |
| 45. | St Martin | 10.2% | 17.9%(-7.74)#45 | 20.4%(-10.2)#1,507 |
| 46. | Chickasaw | 10.3% | 17.9%(-7.65)#46 | 20.4%(-10.1)#1,563 |
| 47. | Medway | 10.3% | 17.9%(-7.64)#47 | 20.4%(-10.1)#1,570 |
| 48. | Homeworth | 10.3% | 17.9%(-7.62)#48 | 20.4%(-10.1)#1,578 |
| 49. | Lake Buckhorn | 10.3% | 17.9%(-7.62)#49 | 20.4%(-10.1)#1,579 |
| 50. | Gambier | 10.4% | 17.9%(-7.55)#50 | 20.4%(-10.0)#1,622 |
| 51. | Hiram | 10.4% | 17.9%(-7.52)#51 | 20.4%(-9.98)#1,646 |
| 52. | Chilo | 10.4% | 17.9%(-7.52)#52 | 20.4%(-9.98)#1,647 |
| 53. | St Henry | 10.6% | 17.9%(-7.36)#53 | 20.4%(-9.82)#1,763 |
| 54. | Mount Hope | 10.6% | 17.9%(-7.35)#54 | 20.4%(-9.82)#1,767 |
| 55. | Candlewood Lake | 10.6% | 17.9%(-7.31)#55 | 20.4%(-9.77)#1,805 |
| 56. | Kalida | 10.7% | 17.9%(-7.22)#56 | 20.4%(-9.68)#1,866 |
| 57. | Osgood | 10.8% | 17.9%(-7.15)#57 | 20.4%(-9.61)#1,918 |
| 58. | Flushing | 10.8% | 17.9%(-7.15)#58 | 20.4%(-9.61)#1,919 |
| 59. | Amsterdam | 10.8% | 17.9%(-7.13)#59 | 20.4%(-9.59)#1,928 |
| 60. | Wetherington | 10.8% | 17.9%(-7.13)#60 | 20.4%(-9.59)#1,930 |
| 61. | Pleasant Grove | 10.8% | 17.9%(-7.10)#61 | 20.4%(-9.56)#1,952 |
| 62. | North Lima | 10.8% | 17.9%(-7.08)#62 | 20.4%(-9.55)#1,963 |
| 63. | Attica | 10.9% | 17.9%(-7.03)#63 | 20.4%(-9.49)#2,007 |
| 64. | Evendale | 10.9% | 17.9%(-7.00)#64 | 20.4%(-9.46)#2,030 |
| 65. | Waterford | 11.0% | 17.9%(-6.95)#65 | 20.4%(-9.42)#2,062 |
| 66. | Maplewood Park | 11.0% | 17.9%(-6.89)#66 | 20.4%(-9.35)#2,116 |
| 67. | Ridgeville Corners | 11.0% | 17.9%(-6.88)#67 | 20.4%(-9.34)#2,122 |
| 68. | New Hampshire | 11.1% | 17.9%(-6.85)#68 | 20.4%(-9.32)#2,137 |
| 69. | Williston | 11.1% | 17.9%(-6.78)#69 | 20.4%(-9.24)#2,193 |
| 70. | Mitiwanga | 11.1% | 17.9%(-6.76)#70 | 20.4%(-9.23)#2,205 |
| 71. | New Alexandria | 11.2% | 17.9%(-6.71)#71 | 20.4%(-9.18)#2,249 |
| 72. | Rochester | 11.2% | 17.9%(-6.69)#72 | 20.4%(-9.15)#2,268 |
| 73. | Hoytville | 11.2% | 17.9%(-6.67)#73 | 20.4%(-9.14)#2,278 |
| 74. | Cygnet | 11.3% | 17.9%(-6.66)#74 | 20.4%(-9.12)#2,291 |
| 75. | Marblehead | 11.3% | 17.9%(-6.65)#75 | 20.4%(-9.11)#2,303 |
| 76. | Lake Seneca | 11.3% | 17.9%(-6.62)#76 | 20.4%(-9.08)#2,325 |
| 77. | Stratton | 11.3% | 17.9%(-6.60)#77 | 20.4%(-9.06)#2,342 |
| 78. | Luckey | 11.3% | 17.9%(-6.58)#78 | 20.4%(-9.05)#2,353 |
| 79. | Sawyerwood | 11.3% | 17.9%(-6.58)#79 | 20.4%(-9.05)#2,355 |
| 80. | Barnesville | 11.4% | 17.9%(-6.55)#80 | 20.4%(-9.02)#2,383 |
| 81. | Bolindale | 11.4% | 17.9%(-6.52)#81 | 20.4%(-8.98)#2,418 |
| 82. | Camp Dennison | 11.4% | 17.9%(-6.51)#82 | 20.4%(-8.97)#2,424 |
| 83. | Montezuma | 11.4% | 17.9%(-6.49)#83 | 20.4%(-8.95)#2,442 |
| 84. | New Bremen | 11.5% | 17.9%(-6.44)#84 | 20.4%(-8.90)#2,489 |
| 85. | Mcguffey | 11.5% | 17.9%(-6.44)#85 | 20.4%(-8.90)#2,494 |
| 86. | West Salem | 11.6% | 17.9%(-6.32)#86 | 20.4%(-8.78)#2,607 |
| 87. | Fort Seneca | 11.6% | 17.9%(-6.30)#87 | 20.4%(-8.76)#2,621 |
| 88. | North Zanesville | 11.6% | 17.9%(-6.28)#88 | 20.4%(-8.74)#2,642 |
| 89. | Palestine | 11.6% | 17.9%(-6.27)#89 | 20.4%(-8.73)#2,651 |
| 90. | Sharon Center | 11.7% | 17.9%(-6.25)#90 | 20.4%(-8.71)#2,667 |
| 91. | Reno Beach | 11.8% | 17.9%(-6.14)#91 | 20.4%(-8.60)#2,802 |
| 92. | Minster | 11.8% | 17.9%(-6.11)#92 | 20.4%(-8.58)#2,820 |
| 93. | South Russell | 11.8% | 17.9%(-6.07)#93 | 20.4%(-8.53)#2,875 |
| 94. | Savannah | 11.8% | 17.9%(-6.07)#94 | 20.4%(-8.53)#2,876 |
| 95. | Trimble | 11.8% | 17.9%(-6.07)#95 | 20.4%(-8.53)#2,879 |
| 96. | Carbon Hill | 11.9% | 17.9%(-6.06)#96 | 20.4%(-8.52)#2,885 |
| 97. | Canfield | 11.9% | 17.9%(-6.06)#97 | 20.4%(-8.52)#2,888 |
| 98. | Trinway | 11.9% | 17.9%(-6.06)#98 | 20.4%(-8.52)#2,889 |
| 99. | Versailles | 11.9% | 17.9%(-6.06)#99 | 20.4%(-8.52)#2,893 |
| 100. | Pettisville | 11.9% | 17.9%(-6.04)#100 | 20.4%(-8.51)#2,907 |
Common Questions
What are the Top 10 Cities with the Lowest Costs of Housing as Percentage of Income in Ohio?
Top 10 Cities with the Lowest Costs of Housing as Percentage of Income in Ohio are:
What city has the Lowest Costs of Housing as Percentage of Income in Ohio?
Glencoe has the Lowest Costs of Housing as Percentage of Income in Ohio with 3.0%.
What is the Average Housing Costs as Percentage of Income in the State of Ohio?
Average Housing Costs as Percentage of Income in Ohio is 17.9%.
What is the Average Housing Costs as Percentage of Income in the United States?
Average Housing Costs as Percentage of Income in the United States is 20.4%.