Cities with the Lowest Costs of Housing as Percentage of Income in Utah
RELATED REPORTS & OPTIONS
Lowest Housing Costs / Income
Utah
Compare Cities
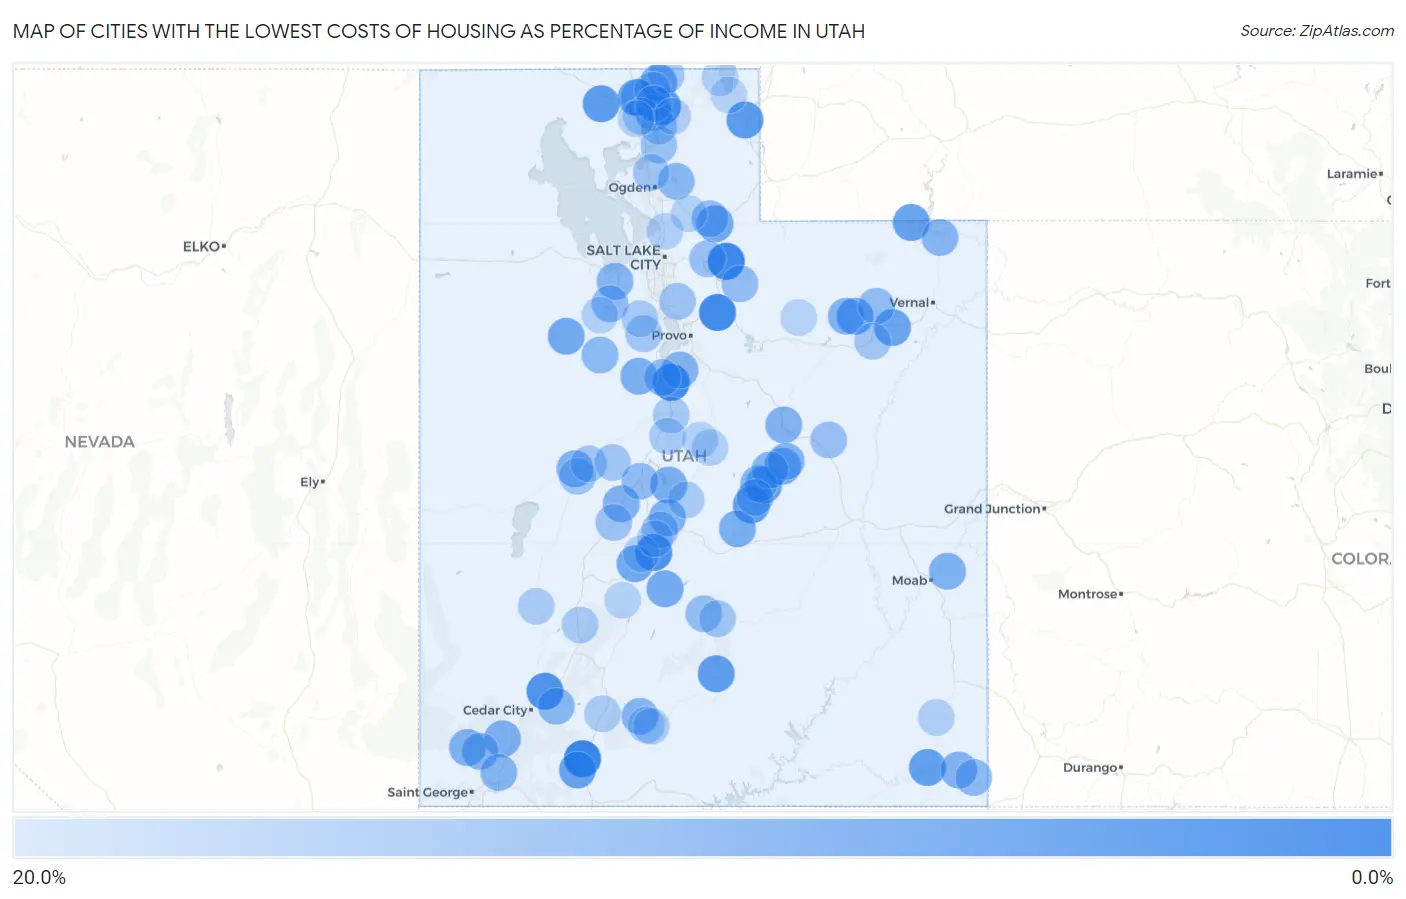
Map of Cities with the Lowest Costs of Housing as Percentage of Income in Utah
20.0%
0.0%
Cities with the Lowest Costs of Housing as Percentage of Income in Utah
| City | Housing Costs / Income | vs State | vs National | |
| 1. | Glendale | 6.5% | 19.4%(-12.9)#1 | 20.4%(-13.8)#253 |
| 2. | Peoa | 6.8% | 19.4%(-12.6)#2 | 20.4%(-13.5)#300 |
| 3. | Rocky Ridge | 7.2% | 19.4%(-12.2)#3 | 20.4%(-13.1)#385 |
| 4. | Wallsburg | 7.3% | 19.4%(-12.1)#4 | 20.4%(-13.1)#397 |
| 5. | Glenwood | 8.1% | 19.4%(-11.4)#5 | 20.4%(-12.3)#589 |
| 6. | Summit | 8.1% | 19.4%(-11.3)#6 | 20.4%(-12.2)#610 |
| 7. | Benson | 8.5% | 19.4%(-10.9)#7 | 20.4%(-11.9)#720 |
| 8. | Randolph | 9.0% | 19.4%(-10.4)#8 | 20.4%(-11.3)#911 |
| 9. | Howell | 9.3% | 19.4%(-10.1)#9 | 20.4%(-11.1)#1,037 |
| 10. | Boulder | 9.4% | 19.4%(-10.1)#10 | 20.4%(-11.0)#1,065 |
| 11. | Ferron | 9.4% | 19.4%(-10.00)#11 | 20.4%(-10.9)#1,102 |
| 12. | Riverside | 9.5% | 19.4%(-9.91)#12 | 20.4%(-10.9)#1,150 |
| 13. | Bluff | 9.5% | 19.4%(-9.90)#13 | 20.4%(-10.8)#1,152 |
| 14. | Manila | 9.7% | 19.4%(-9.68)#14 | 20.4%(-10.6)#1,261 |
| 15. | Castle Dale | 10.0% | 19.4%(-9.41)#15 | 20.4%(-10.4)#1,426 |
| 16. | Orderville | 10.1% | 19.4%(-9.36)#16 | 20.4%(-10.3)#1,450 |
| 17. | Fort Duchesne | 10.2% | 19.4%(-9.25)#17 | 20.4%(-10.2)#1,518 |
| 18. | Echo | 10.6% | 19.4%(-8.85)#18 | 20.4%(-9.79)#1,788 |
| 19. | Bluebell | 10.6% | 19.4%(-8.84)#19 | 20.4%(-9.79)#1,793 |
| 20. | Trenton | 10.6% | 19.4%(-8.79)#20 | 20.4%(-9.74)#1,830 |
| 21. | Dugway | 10.8% | 19.4%(-8.68)#21 | 20.4%(-9.62)#1,909 |
| 22. | Elsinore | 10.8% | 19.4%(-8.66)#22 | 20.4%(-9.61)#1,921 |
| 23. | Koosharem | 11.0% | 19.4%(-8.47)#23 | 20.4%(-9.42)#2,059 |
| 24. | Cleveland | 11.0% | 19.4%(-8.47)#24 | 20.4%(-9.42)#2,063 |
| 25. | Fayette | 11.3% | 19.4%(-8.16)#25 | 20.4%(-9.10)#2,310 |
| 26. | Eureka | 11.3% | 19.4%(-8.12)#26 | 20.4%(-9.07)#2,339 |
| 27. | Emery | 11.4% | 19.4%(-8.02)#27 | 20.4%(-8.96)#2,433 |
| 28. | Redmond | 11.6% | 19.4%(-7.84)#28 | 20.4%(-8.79)#2,594 |
| 29. | Holden | 11.7% | 19.4%(-7.78)#29 | 20.4%(-8.72)#2,660 |
| 30. | New Harmony | 11.7% | 19.4%(-7.77)#30 | 20.4%(-8.72)#2,663 |
| 31. | Central | 11.7% | 19.4%(-7.71)#31 | 20.4%(-8.66)#2,722 |
| 32. | Castle Valley | 11.7% | 19.4%(-7.69)#32 | 20.4%(-8.63)#2,750 |
| 33. | Montezuma Creek | 11.8% | 19.4%(-7.63)#33 | 20.4%(-8.57)#2,826 |
| 34. | Mendon | 11.8% | 19.4%(-7.59)#34 | 20.4%(-8.54)#2,868 |
| 35. | Hinckley | 11.9% | 19.4%(-7.56)#35 | 20.4%(-8.50)#2,913 |
| 36. | Carbonville | 11.9% | 19.4%(-7.54)#36 | 20.4%(-8.48)#2,929 |
| 37. | Altamont | 11.9% | 19.4%(-7.53)#37 | 20.4%(-8.47)#2,936 |
| 38. | Spring Lake | 11.9% | 19.4%(-7.49)#38 | 20.4%(-8.43)#2,978 |
| 39. | Orangeville | 12.1% | 19.4%(-7.38)#39 | 20.4%(-8.32)#3,077 |
| 40. | Elmo | 12.1% | 19.4%(-7.32)#40 | 20.4%(-8.26)#3,135 |
| 41. | Tropic | 12.1% | 19.4%(-7.28)#41 | 20.4%(-8.23)#3,183 |
| 42. | Pine Valley | 12.2% | 19.4%(-7.22)#42 | 20.4%(-8.17)#3,256 |
| 43. | Erda | 12.3% | 19.4%(-7.16)#43 | 20.4%(-8.10)#3,327 |
| 44. | Flaming Gorge | 12.3% | 19.4%(-7.14)#44 | 20.4%(-8.09)#3,344 |
| 45. | Huntington | 12.3% | 19.4%(-7.13)#45 | 20.4%(-8.08)#3,353 |
| 46. | Leeds | 12.3% | 19.4%(-7.09)#46 | 20.4%(-8.04)#3,396 |
| 47. | Huntsville | 12.4% | 19.4%(-7.06)#47 | 20.4%(-8.01)#3,427 |
| 48. | Brian Head | 12.6% | 19.4%(-6.86)#48 | 20.4%(-7.80)#3,677 |
| 49. | Vernon | 12.6% | 19.4%(-6.82)#49 | 20.4%(-7.77)#3,719 |
| 50. | Clawson | 12.7% | 19.4%(-6.73)#50 | 20.4%(-7.68)#3,824 |
| 51. | Stockton | 12.7% | 19.4%(-6.70)#51 | 20.4%(-7.64)#3,860 |
| 52. | Aneth | 12.9% | 19.4%(-6.55)#52 | 20.4%(-7.49)#4,053 |
| 53. | Scipio | 12.9% | 19.4%(-6.48)#53 | 20.4%(-7.43)#4,126 |
| 54. | Henefer | 13.0% | 19.4%(-6.48)#54 | 20.4%(-7.42)#4,137 |
| 55. | Neola | 13.0% | 19.4%(-6.44)#55 | 20.4%(-7.39)#4,172 |
| 56. | Goshen | 13.1% | 19.4%(-6.33)#56 | 20.4%(-7.27)#4,318 |
| 57. | Woodland | 13.1% | 19.4%(-6.30)#57 | 20.4%(-7.24)#4,359 |
| 58. | Bicknell | 13.4% | 19.4%(-6.07)#58 | 20.4%(-7.02)#4,690 |
| 59. | Silver Summit | 13.4% | 19.4%(-6.02)#59 | 20.4%(-6.97)#4,758 |
| 60. | Aurora | 13.5% | 19.4%(-5.96)#60 | 20.4%(-6.91)#4,846 |
| 61. | East Carbon | 13.5% | 19.4%(-5.96)#61 | 20.4%(-6.90)#4,849 |
| 62. | Fielding | 13.5% | 19.4%(-5.96)#62 | 20.4%(-6.90)#4,850 |
| 63. | Mantua | 13.6% | 19.4%(-5.85)#63 | 20.4%(-6.79)#5,016 |
| 64. | Wellsville | 13.7% | 19.4%(-5.76)#64 | 20.4%(-6.70)#5,156 |
| 65. | Deseret | 13.8% | 19.4%(-5.66)#65 | 20.4%(-6.60)#5,317 |
| 66. | Alpine | 13.9% | 19.4%(-5.56)#66 | 20.4%(-6.50)#5,468 |
| 67. | Fillmore | 13.9% | 19.4%(-5.54)#67 | 20.4%(-6.48)#5,505 |
| 68. | Fairfield | 14.0% | 19.4%(-5.39)#68 | 20.4%(-6.33)#5,742 |
| 69. | Delta | 14.1% | 19.4%(-5.37)#69 | 20.4%(-6.32)#5,771 |
| 70. | Pleasant View | 14.1% | 19.4%(-5.36)#70 | 20.4%(-6.30)#5,800 |
| 71. | Torrey | 14.1% | 19.4%(-5.33)#71 | 20.4%(-6.27)#5,845 |
| 72. | Lewiston | 14.1% | 19.4%(-5.32)#72 | 20.4%(-6.26)#5,858 |
| 73. | Myton | 14.1% | 19.4%(-5.31)#73 | 20.4%(-6.25)#5,891 |
| 74. | Oak City | 14.2% | 19.4%(-5.22)#74 | 20.4%(-6.16)#6,051 |
| 75. | Newton | 14.4% | 19.4%(-5.07)#75 | 20.4%(-6.01)#6,306 |
| 76. | Cedar Fort | 14.5% | 19.4%(-4.97)#76 | 20.4%(-5.92)#6,467 |
| 77. | Nephi | 14.6% | 19.4%(-4.87)#77 | 20.4%(-5.82)#6,626 |
| 78. | Beaver | 14.6% | 19.4%(-4.82)#78 | 20.4%(-5.76)#6,713 |
| 79. | Cannonville | 14.6% | 19.4%(-4.79)#79 | 20.4%(-5.74)#6,754 |
| 80. | Deweyville | 14.7% | 19.4%(-4.76)#80 | 20.4%(-5.71)#6,799 |
| 81. | Levan | 14.7% | 19.4%(-4.71)#81 | 20.4%(-5.65)#6,905 |
| 82. | Hatch | 14.8% | 19.4%(-4.66)#82 | 20.4%(-5.61)#6,981 |
| 83. | Milford | 14.8% | 19.4%(-4.64)#83 | 20.4%(-5.58)#7,033 |
| 84. | Mayfield | 14.8% | 19.4%(-4.61)#84 | 20.4%(-5.55)#7,074 |
| 85. | Henrieville | 14.9% | 19.4%(-4.49)#85 | 20.4%(-5.43)#7,287 |
| 86. | Richfield | 15.1% | 19.4%(-4.34)#86 | 20.4%(-5.29)#7,558 |
| 87. | Spring City | 15.1% | 19.4%(-4.34)#87 | 20.4%(-5.29)#7,559 |
| 88. | Peter | 15.2% | 19.4%(-4.27)#88 | 20.4%(-5.22)#7,682 |
| 89. | Blanding | 15.2% | 19.4%(-4.23)#89 | 20.4%(-5.18)#7,761 |
| 90. | Centerville | 15.2% | 19.4%(-4.21)#90 | 20.4%(-5.16)#7,812 |
| 91. | Sigurd | 15.3% | 19.4%(-4.18)#91 | 20.4%(-5.12)#7,880 |
| 92. | Millville | 15.3% | 19.4%(-4.15)#92 | 20.4%(-5.09)#7,929 |
| 93. | Garden City | 15.3% | 19.4%(-4.13)#93 | 20.4%(-5.07)#7,961 |
| 94. | Rush Valley | 15.4% | 19.4%(-4.08)#94 | 20.4%(-5.02)#8,051 |
| 95. | Marysvale | 15.4% | 19.4%(-4.05)#95 | 20.4%(-5.00)#8,104 |
| 96. | Moroni | 15.4% | 19.4%(-4.01)#96 | 20.4%(-4.96)#8,180 |
| 97. | Morgan | 15.5% | 19.4%(-3.98)#97 | 20.4%(-4.93)#8,240 |
| 98. | Elwood | 15.5% | 19.4%(-3.95)#98 | 20.4%(-4.90)#8,303 |
| 99. | Laketown | 15.6% | 19.4%(-3.85)#99 | 20.4%(-4.79)#8,542 |
| 100. | Tabiona | 15.6% | 19.4%(-3.84)#100 | 20.4%(-4.79)#8,552 |
Common Questions
What are the Top 10 Cities with the Lowest Costs of Housing as Percentage of Income in Utah?
Top 10 Cities with the Lowest Costs of Housing as Percentage of Income in Utah are:
What city has the Lowest Costs of Housing as Percentage of Income in Utah?
Glendale has the Lowest Costs of Housing as Percentage of Income in Utah with 6.5%.
What is the Average Housing Costs as Percentage of Income in the State of Utah?
Average Housing Costs as Percentage of Income in Utah is 19.4%.
What is the Average Housing Costs as Percentage of Income in the United States?
Average Housing Costs as Percentage of Income in the United States is 20.4%.