Cities with the Lowest Costs of Housing as Percentage of Income in Indiana
RELATED REPORTS & OPTIONS
Lowest Housing Costs / Income
Indiana
Compare Cities
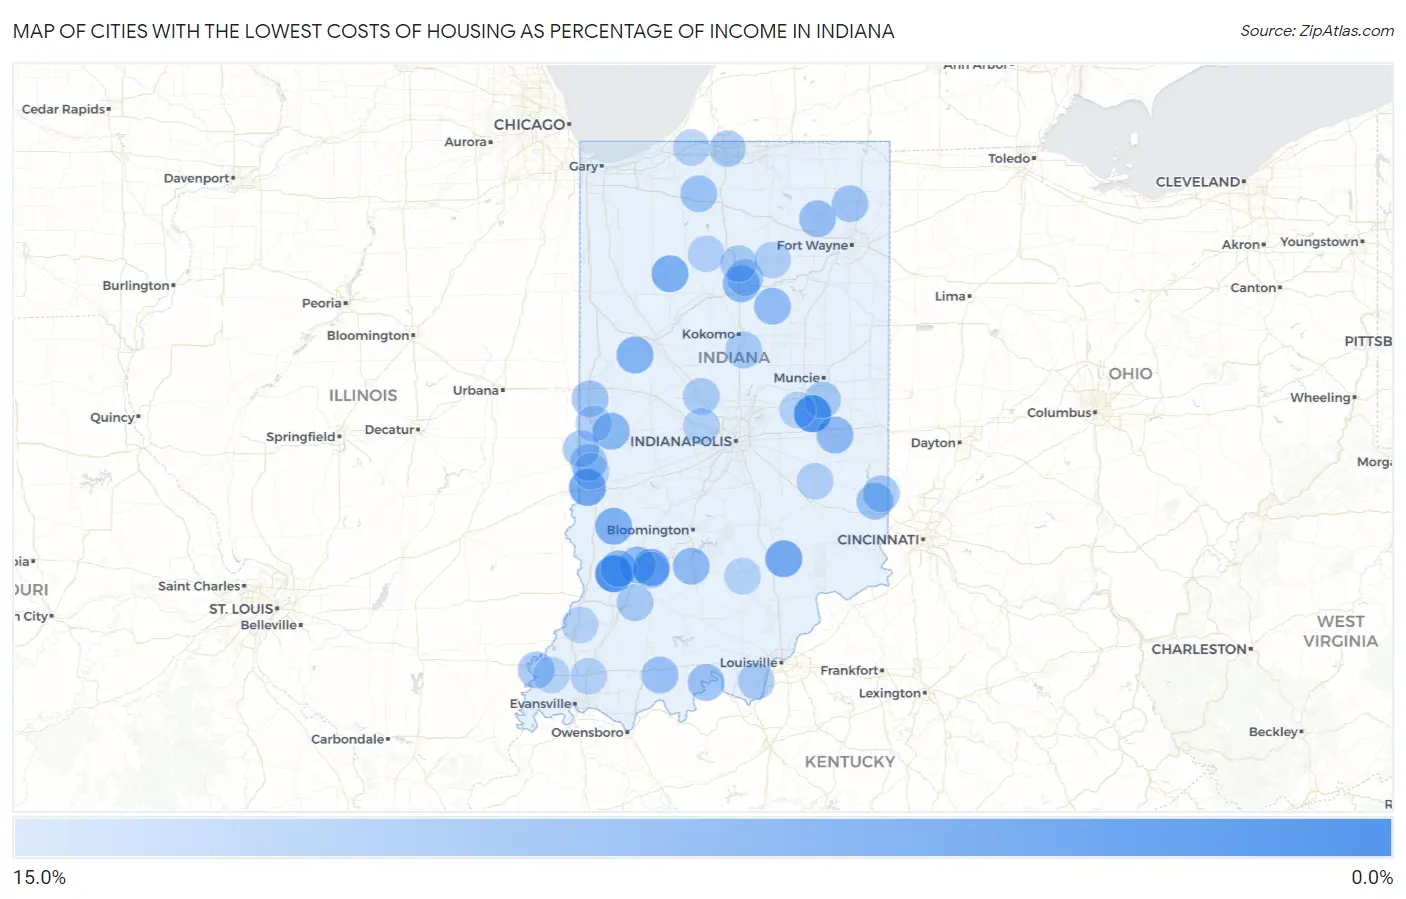
Map of Cities with the Lowest Costs of Housing as Percentage of Income in Indiana
15.0%
0.0%
Cities with the Lowest Costs of Housing as Percentage of Income in Indiana
| City | Housing Costs / Income | vs State | vs National | |
| 1. | Homer | 4.1% | 17.5%(-13.4)#1 | 20.4%(-16.3)#35 |
| 2. | Schaefer Lake | 5.2% | 17.5%(-12.3)#2 | 20.4%(-15.2)#91 |
| 3. | Judah | 5.3% | 17.5%(-12.2)#3 | 20.4%(-15.1)#98 |
| 4. | Westphalia | 5.9% | 17.5%(-11.6)#4 | 20.4%(-14.5)#156 |
| 5. | Cadiz | 6.0% | 17.5%(-11.5)#5 | 20.4%(-14.4)#165 |
| 6. | Ora | 6.3% | 17.5%(-11.2)#6 | 20.4%(-14.1)#210 |
| 7. | Cowan | 6.3% | 17.5%(-11.2)#7 | 20.4%(-14.1)#212 |
| 8. | Browns Crossing | 6.8% | 17.5%(-10.7)#8 | 20.4%(-13.6)#288 |
| 9. | Coesse | 6.9% | 17.5%(-10.6)#9 | 20.4%(-13.5)#307 |
| 10. | Millgrove | 6.9% | 17.5%(-10.6)#10 | 20.4%(-13.5)#308 |
| 11. | Talma | 7.1% | 17.5%(-10.4)#11 | 20.4%(-13.3)#346 |
| 12. | East Oolitic | 7.3% | 17.5%(-10.2)#12 | 20.4%(-13.1)#392 |
| 13. | Servia | 7.4% | 17.5%(-10.0)#13 | 20.4%(-12.9)#422 |
| 14. | Toad Hop | 8.0% | 17.5%(-9.52)#14 | 20.4%(-12.4)#563 |
| 15. | Gilmer Park | 8.1% | 17.5%(-9.42)#15 | 20.4%(-12.3)#591 |
| 16. | Scotland | 8.1% | 17.5%(-9.41)#16 | 20.4%(-12.3)#593 |
| 17. | Hayden | 8.3% | 17.5%(-9.23)#17 | 20.4%(-12.1)#642 |
| 18. | Haysville | 8.3% | 17.5%(-9.22)#18 | 20.4%(-12.1)#644 |
| 19. | Saugany Lake | 8.3% | 17.5%(-9.20)#19 | 20.4%(-12.1)#650 |
| 20. | Harrison Lake | 8.4% | 17.5%(-9.11)#20 | 20.4%(-12.0)#683 |
| 21. | Celestine | 8.4% | 17.5%(-9.04)#21 | 20.4%(-11.9)#706 |
| 22. | Buffalo | 8.7% | 17.5%(-8.77)#22 | 20.4%(-11.7)#791 |
| 23. | Wellsboro | 8.8% | 17.5%(-8.69)#23 | 20.4%(-11.6)#820 |
| 24. | Coalmont | 9.0% | 17.5%(-8.52)#24 | 20.4%(-11.4)#885 |
| 25. | Lincoln | 9.3% | 17.5%(-8.22)#25 | 20.4%(-11.1)#1,011 |
| 26. | Gwynneville | 9.3% | 17.5%(-8.15)#26 | 20.4%(-11.0)#1,043 |
| 27. | West Point | 9.3% | 17.5%(-8.14)#27 | 20.4%(-11.0)#1,044 |
| 28. | Stewartsville | 9.6% | 17.5%(-7.91)#28 | 20.4%(-10.8)#1,171 |
| 29. | Bloomingdale | 9.6% | 17.5%(-7.89)#29 | 20.4%(-10.8)#1,180 |
| 30. | Canton | 9.6% | 17.5%(-7.84)#30 | 20.4%(-10.7)#1,205 |
| 31. | Mexico | 9.7% | 17.5%(-7.81)#31 | 20.4%(-10.7)#1,224 |
| 32. | Grammer | 9.8% | 17.5%(-7.65)#32 | 20.4%(-10.5)#1,330 |
| 33. | Brownsville | 9.9% | 17.5%(-7.62)#33 | 20.4%(-10.5)#1,339 |
| 34. | Straughn | 10.0% | 17.5%(-7.53)#34 | 20.4%(-10.4)#1,390 |
| 35. | Reddington | 10.0% | 17.5%(-7.49)#35 | 20.4%(-10.4)#1,415 |
| 36. | Otter Lake | 10.0% | 17.5%(-7.48)#36 | 20.4%(-10.4)#1,420 |
| 37. | Avoca | 10.0% | 17.5%(-7.45)#37 | 20.4%(-10.3)#1,434 |
| 38. | Mineral Springs | 10.1% | 17.5%(-7.41)#38 | 20.4%(-10.3)#1,457 |
| 39. | Newberry | 10.3% | 17.5%(-7.23)#39 | 20.4%(-10.1)#1,561 |
| 40. | Sandborn | 10.4% | 17.5%(-7.13)#40 | 20.4%(-10.0)#1,618 |
| 41. | Leiters Ford | 10.4% | 17.5%(-7.11)#41 | 20.4%(-10.00)#1,636 |
| 42. | Somerset | 10.4% | 17.5%(-7.08)#42 | 20.4%(-9.97)#1,658 |
| 43. | Tri Lakes | 10.5% | 17.5%(-6.97)#43 | 20.4%(-9.86)#1,734 |
| 44. | Grantsburg | 10.5% | 17.5%(-6.95)#44 | 20.4%(-9.84)#1,749 |
| 45. | Lake Cicott | 10.6% | 17.5%(-6.93)#45 | 20.4%(-9.81)#1,772 |
| 46. | Alton | 10.6% | 17.5%(-6.84)#46 | 20.4%(-9.73)#1,840 |
| 47. | Carrollton | 10.8% | 17.5%(-6.73)#47 | 20.4%(-9.62)#1,915 |
| 48. | Cedar Grove | 10.8% | 17.5%(-6.67)#48 | 20.4%(-9.56)#1,955 |
| 49. | St Meinrad | 10.8% | 17.5%(-6.66)#49 | 20.4%(-9.55)#1,962 |
| 50. | Lake Holiday Hideaway | 10.8% | 17.5%(-6.66)#50 | 20.4%(-9.54)#1,964 |
| 51. | Koontz Lake | 10.9% | 17.5%(-6.58)#51 | 20.4%(-9.47)#2,021 |
| 52. | Arcola | 11.0% | 17.5%(-6.53)#52 | 20.4%(-9.42)#2,057 |
| 53. | Universal | 11.1% | 17.5%(-6.36)#53 | 20.4%(-9.25)#2,185 |
| 54. | Altona | 11.2% | 17.5%(-6.33)#54 | 20.4%(-9.21)#2,209 |
| 55. | Perrysville | 11.2% | 17.5%(-6.28)#55 | 20.4%(-9.16)#2,257 |
| 56. | Mount Carmel | 11.2% | 17.5%(-6.27)#56 | 20.4%(-9.15)#2,264 |
| 57. | St Bernice | 11.2% | 17.5%(-6.24)#57 | 20.4%(-9.13)#2,285 |
| 58. | Griffin | 11.3% | 17.5%(-6.22)#58 | 20.4%(-9.11)#2,300 |
| 59. | Mace | 11.3% | 17.5%(-6.19)#59 | 20.4%(-9.08)#2,331 |
| 60. | Webster | 11.4% | 17.5%(-6.11)#60 | 20.4%(-9.00)#2,402 |
| 61. | Denver | 11.4% | 17.5%(-6.10)#61 | 20.4%(-8.99)#2,412 |
| 62. | Charlottesville | 11.5% | 17.5%(-6.00)#62 | 20.4%(-8.89)#2,505 |
| 63. | Philadelphia | 11.6% | 17.5%(-5.92)#63 | 20.4%(-8.81)#2,582 |
| 64. | Reo | 11.6% | 17.5%(-5.89)#64 | 20.4%(-8.77)#2,610 |
| 65. | Adams Lake | 11.6% | 17.5%(-5.88)#65 | 20.4%(-8.77)#2,615 |
| 66. | Indian Village | 11.6% | 17.5%(-5.88)#66 | 20.4%(-8.76)#2,619 |
| 67. | Elizabeth | 11.6% | 17.5%(-5.86)#67 | 20.4%(-8.75)#2,631 |
| 68. | Macy | 11.7% | 17.5%(-5.83)#68 | 20.4%(-8.72)#2,662 |
| 69. | Springport | 11.7% | 17.5%(-5.77)#69 | 20.4%(-8.65)#2,730 |
| 70. | Montgomery | 11.7% | 17.5%(-5.76)#70 | 20.4%(-8.65)#2,733 |
| 71. | Hoffman Lake | 11.8% | 17.5%(-5.72)#71 | 20.4%(-8.61)#2,788 |
| 72. | Sharpsville | 11.8% | 17.5%(-5.72)#72 | 20.4%(-8.61)#2,790 |
| 73. | Groveland | 11.8% | 17.5%(-5.72)#73 | 20.4%(-8.61)#2,791 |
| 74. | Ulen | 11.9% | 17.5%(-5.56)#74 | 20.4%(-8.44)#2,968 |
| 75. | Fairbanks | 11.9% | 17.5%(-5.55)#75 | 20.4%(-8.43)#2,977 |
| 76. | Mongo | 12.0% | 17.5%(-5.52)#76 | 20.4%(-8.40)#3,006 |
| 77. | Scott | 12.0% | 17.5%(-5.48)#77 | 20.4%(-8.36)#3,046 |
| 78. | Tyner | 12.0% | 17.5%(-5.45)#78 | 20.4%(-8.33)#3,065 |
| 79. | Newbern | 12.1% | 17.5%(-5.39)#79 | 20.4%(-8.27)#3,127 |
| 80. | Waverly | 12.1% | 17.5%(-5.35)#80 | 20.4%(-8.24)#3,167 |
| 81. | Blocher | 12.1% | 17.5%(-5.35)#81 | 20.4%(-8.24)#3,168 |
| 82. | Crane | 12.1% | 17.5%(-5.35)#82 | 20.4%(-8.23)#3,175 |
| 83. | Rockford | 12.2% | 17.5%(-5.32)#83 | 20.4%(-8.20)#3,213 |
| 84. | Marietta | 12.2% | 17.5%(-5.30)#84 | 20.4%(-8.19)#3,233 |
| 85. | Hudson Lake | 12.2% | 17.5%(-5.30)#85 | 20.4%(-8.18)#3,243 |
| 86. | Laketon | 12.2% | 17.5%(-5.26)#86 | 20.4%(-8.14)#3,280 |
| 87. | Wildwood | 12.3% | 17.5%(-5.20)#87 | 20.4%(-8.09)#3,340 |
| 88. | Milroy | 12.3% | 17.5%(-5.20)#88 | 20.4%(-8.09)#3,341 |
| 89. | Lake Everett | 12.3% | 17.5%(-5.17)#89 | 20.4%(-8.05)#3,376 |
| 90. | Newport | 12.4% | 17.5%(-5.08)#90 | 20.4%(-7.97)#3,465 |
| 91. | Pittsboro | 12.4% | 17.5%(-5.07)#91 | 20.4%(-7.96)#3,486 |
| 92. | Elberfeld | 12.4% | 17.5%(-5.07)#92 | 20.4%(-7.96)#3,488 |
| 93. | Kewanna | 12.4% | 17.5%(-5.06)#93 | 20.4%(-7.95)#3,496 |
| 94. | Vallonia | 12.5% | 17.5%(-5.03)#94 | 20.4%(-7.92)#3,530 |
| 95. | Markleville | 12.6% | 17.5%(-4.90)#95 | 20.4%(-7.79)#3,695 |
| 96. | St. Omer | 12.6% | 17.5%(-4.90)#96 | 20.4%(-7.79)#3,701 |
| 97. | Tecumseh | 12.6% | 17.5%(-4.87)#97 | 20.4%(-7.76)#3,732 |
| 98. | Decker | 12.6% | 17.5%(-4.86)#98 | 20.4%(-7.74)#3,751 |
| 99. | Poseyville | 12.7% | 17.5%(-4.82)#99 | 20.4%(-7.71)#3,797 |
| 100. | Perkinsville | 12.7% | 17.5%(-4.82)#100 | 20.4%(-7.71)#3,798 |
Common Questions
What are the Top 10 Cities with the Lowest Costs of Housing as Percentage of Income in Indiana?
Top 10 Cities with the Lowest Costs of Housing as Percentage of Income in Indiana are:
#1
5.9%
#2
6.0%
#3
8.0%
#4
8.1%
#5
8.3%
#6
8.7%
#7
9.0%
#8
9.3%
#9
9.6%
#10
9.7%
What city has the Lowest Costs of Housing as Percentage of Income in Indiana?
Westphalia has the Lowest Costs of Housing as Percentage of Income in Indiana with 5.9%.
What is the Average Housing Costs as Percentage of Income in the State of Indiana?
Average Housing Costs as Percentage of Income in Indiana is 17.5%.
What is the Average Housing Costs as Percentage of Income in the United States?
Average Housing Costs as Percentage of Income in the United States is 20.4%.