Cities with the Lowest Costs of Housing as Percentage of Income in Florida
RELATED REPORTS & OPTIONS
Lowest Housing Costs / Income
Florida
Compare Cities
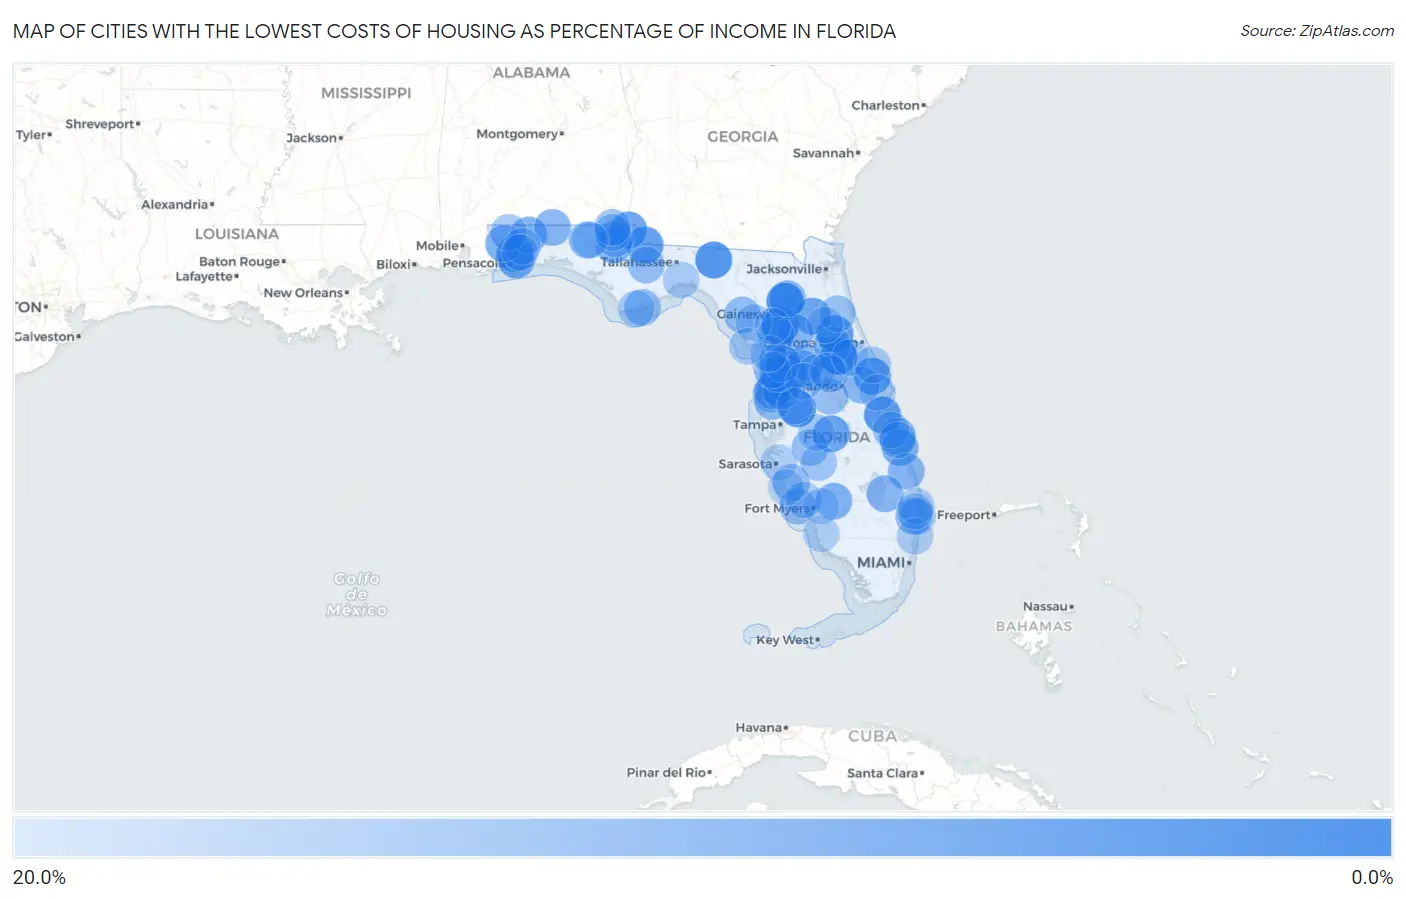
Map of Cities with the Lowest Costs of Housing as Percentage of Income in Florida
20.0%
0.0%
Cities with the Lowest Costs of Housing as Percentage of Income in Florida
| City | Housing Costs / Income | vs State | vs National | |
| 1. | Lake Mack Forest Hills | 7.6% | 23.2%(-15.6)#1 | 20.4%(-12.8)#458 |
| 2. | Raleigh | 7.9% | 23.2%(-15.3)#2 | 20.4%(-12.5)#544 |
| 3. | La Crosse | 8.5% | 23.2%(-14.8)#3 | 20.4%(-11.9)#709 |
| 4. | Crystal Springs | 8.8% | 23.2%(-14.4)#4 | 20.4%(-11.6)#824 |
| 5. | Greenville | 9.4% | 23.2%(-13.9)#5 | 20.4%(-11.0)#1,051 |
| 6. | Melbourne Village | 9.5% | 23.2%(-13.7)#6 | 20.4%(-10.9)#1,130 |
| 7. | Seville | 9.8% | 23.2%(-13.4)#7 | 20.4%(-10.6)#1,316 |
| 8. | Chattahoochee | 9.9% | 23.2%(-13.4)#8 | 20.4%(-10.5)#1,337 |
| 9. | Winding Cypress | 9.9% | 23.2%(-13.3)#9 | 20.4%(-10.5)#1,343 |
| 10. | Black Diamond | 9.9% | 23.2%(-13.3)#10 | 20.4%(-10.5)#1,351 |
| 11. | Mims | 10.3% | 23.2%(-12.9)#11 | 20.4%(-10.1)#1,569 |
| 12. | Mulat | 10.5% | 23.2%(-12.7)#12 | 20.4%(-9.91)#1,703 |
| 13. | Interlachen | 10.6% | 23.2%(-12.6)#13 | 20.4%(-9.79)#1,794 |
| 14. | Bascom | 10.6% | 23.2%(-12.6)#14 | 20.4%(-9.79)#1,795 |
| 15. | Hillcrest Heights | 10.6% | 23.2%(-12.6)#15 | 20.4%(-9.75)#1,824 |
| 16. | Garcon Point | 10.9% | 23.2%(-12.4)#16 | 20.4%(-9.52)#1,988 |
| 17. | Brookridge | 11.1% | 23.2%(-12.1)#17 | 20.4%(-9.26)#2,179 |
| 18. | High Point | 11.2% | 23.2%(-12.0)#18 | 20.4%(-9.20)#2,218 |
| 19. | Inverness Highlands North | 11.5% | 23.2%(-11.8)#19 | 20.4%(-8.91)#2,476 |
| 20. | Wabasso Beach | 11.5% | 23.2%(-11.8)#20 | 20.4%(-8.91)#2,480 |
| 21. | Coleman | 11.5% | 23.2%(-11.7)#21 | 20.4%(-8.88)#2,511 |
| 22. | South Beach | 11.5% | 23.2%(-11.7)#22 | 20.4%(-8.86)#2,528 |
| 23. | Molino | 11.5% | 23.2%(-11.7)#23 | 20.4%(-8.83)#2,561 |
| 24. | Munson | 11.7% | 23.2%(-11.5)#24 | 20.4%(-8.63)#2,762 |
| 25. | Alford | 11.8% | 23.2%(-11.4)#25 | 20.4%(-8.59)#2,810 |
| 26. | Westville | 11.8% | 23.2%(-11.4)#26 | 20.4%(-8.53)#2,880 |
| 27. | Heritage Pines | 11.9% | 23.2%(-11.3)#27 | 20.4%(-8.46)#2,945 |
| 28. | Fort Denaud | 11.9% | 23.2%(-11.3)#28 | 20.4%(-8.46)#2,955 |
| 29. | Floral City | 11.9% | 23.2%(-11.3)#29 | 20.4%(-8.44)#2,967 |
| 30. | Laurel Hill | 12.2% | 23.2%(-11.0)#30 | 20.4%(-8.17)#3,260 |
| 31. | Reddick | 12.3% | 23.2%(-11.0)#31 | 20.4%(-8.12)#3,304 |
| 32. | Golf | 12.3% | 23.2%(-10.9)#32 | 20.4%(-8.04)#3,393 |
| 33. | Astor | 12.3% | 23.2%(-10.9)#33 | 20.4%(-8.03)#3,408 |
| 34. | Indian Lake Estates | 12.4% | 23.2%(-10.9)#34 | 20.4%(-8.02)#3,419 |
| 35. | Rainbow Lakes Estates | 12.4% | 23.2%(-10.8)#35 | 20.4%(-7.98)#3,456 |
| 36. | Rio | 12.4% | 23.2%(-10.8)#36 | 20.4%(-7.97)#3,472 |
| 37. | Whitfield Cdp Santa Rosa County | 12.5% | 23.2%(-10.8)#37 | 20.4%(-7.92)#3,521 |
| 38. | Canal Point | 12.5% | 23.2%(-10.7)#38 | 20.4%(-7.91)#3,544 |
| 39. | Moon Lake | 12.5% | 23.2%(-10.7)#39 | 20.4%(-7.89)#3,577 |
| 40. | Christmas | 12.5% | 23.2%(-10.7)#40 | 20.4%(-7.88)#3,587 |
| 41. | Brooker | 12.8% | 23.2%(-10.4)#41 | 20.4%(-7.60)#3,918 |
| 42. | Cross City | 13.0% | 23.2%(-10.2)#42 | 20.4%(-7.35)#4,217 |
| 43. | Hosford | 13.1% | 23.2%(-10.1)#43 | 20.4%(-7.24)#4,361 |
| 44. | Warm Mineral Springs | 13.2% | 23.2%(-10.0)#44 | 20.4%(-7.20)#4,415 |
| 45. | Cottondale | 13.2% | 23.2%(-10.0)#45 | 20.4%(-7.18)#4,456 |
| 46. | North Brooksville | 13.2% | 23.2%(-10.0)#46 | 20.4%(-7.18)#4,457 |
| 47. | Eastpoint | 13.2% | 23.2%(-10.0)#47 | 20.4%(-7.18)#4,458 |
| 48. | The Villages | 13.2% | 23.2%(-9.99)#48 | 20.4%(-7.15)#4,504 |
| 49. | Zellwood | 13.3% | 23.2%(-9.95)#49 | 20.4%(-7.11)#4,555 |
| 50. | Fort Green Springs | 13.4% | 23.2%(-9.86)#50 | 20.4%(-7.02)#4,698 |
| 51. | Ocklawaha | 13.4% | 23.2%(-9.82)#51 | 20.4%(-6.98)#4,737 |
| 52. | Pineland | 13.4% | 23.2%(-9.82)#52 | 20.4%(-6.98)#4,747 |
| 53. | Jacob City | 13.4% | 23.2%(-9.78)#53 | 20.4%(-6.94)#4,794 |
| 54. | Bay Lake | 13.5% | 23.2%(-9.73)#54 | 20.4%(-6.89)#4,882 |
| 55. | Timber Pines | 13.5% | 23.2%(-9.72)#55 | 20.4%(-6.88)#4,899 |
| 56. | Campbellton | 13.5% | 23.2%(-9.71)#56 | 20.4%(-6.87)#4,906 |
| 57. | Flagler Estates | 13.5% | 23.2%(-9.69)#57 | 20.4%(-6.85)#4,931 |
| 58. | Garden Grove | 13.6% | 23.2%(-9.61)#58 | 20.4%(-6.77)#5,051 |
| 59. | Williston Highlands | 13.7% | 23.2%(-9.55)#59 | 20.4%(-6.71)#5,148 |
| 60. | Sugarmill Woods | 13.7% | 23.2%(-9.51)#60 | 20.4%(-6.67)#5,201 |
| 61. | Brownsdale | 13.7% | 23.2%(-9.50)#61 | 20.4%(-6.66)#5,236 |
| 62. | Lake Helen | 13.8% | 23.2%(-9.38)#62 | 20.4%(-6.54)#5,415 |
| 63. | Micco | 13.9% | 23.2%(-9.36)#63 | 20.4%(-6.52)#5,438 |
| 64. | Gardner | 13.9% | 23.2%(-9.33)#64 | 20.4%(-6.49)#5,491 |
| 65. | Citrus Hills | 14.0% | 23.2%(-9.23)#65 | 20.4%(-6.39)#5,642 |
| 66. | Roeville | 14.0% | 23.2%(-9.22)#66 | 20.4%(-6.38)#5,666 |
| 67. | Rainbow Park | 14.0% | 23.2%(-9.21)#67 | 20.4%(-6.37)#5,682 |
| 68. | Oak Hill | 14.1% | 23.2%(-9.16)#68 | 20.4%(-6.32)#5,760 |
| 69. | Chaires | 14.1% | 23.2%(-9.16)#69 | 20.4%(-6.31)#5,776 |
| 70. | Homeland | 14.2% | 23.2%(-9.07)#70 | 20.4%(-6.23)#5,941 |
| 71. | Manatee Road | 14.2% | 23.2%(-9.04)#71 | 20.4%(-6.20)#5,987 |
| 72. | Homosassa | 14.2% | 23.2%(-9.04)#72 | 20.4%(-6.20)#5,989 |
| 73. | Apalachicola | 14.2% | 23.2%(-9.03)#73 | 20.4%(-6.19)#6,009 |
| 74. | Inglis | 14.2% | 23.2%(-9.01)#74 | 20.4%(-6.17)#6,041 |
| 75. | Yalaha | 14.2% | 23.2%(-9.01)#75 | 20.4%(-6.17)#6,042 |
| 76. | Burnt Store Marina | 14.2% | 23.2%(-8.99)#76 | 20.4%(-6.15)#6,078 |
| 77. | Cedar Key | 14.3% | 23.2%(-8.95)#77 | 20.4%(-6.11)#6,154 |
| 78. | Briny Breezes | 14.4% | 23.2%(-8.85)#78 | 20.4%(-6.01)#6,309 |
| 79. | Webster | 14.4% | 23.2%(-8.81)#79 | 20.4%(-5.96)#6,391 |
| 80. | Vilano Beach | 14.4% | 23.2%(-8.80)#80 | 20.4%(-5.96)#6,393 |
| 81. | St Marks | 14.5% | 23.2%(-8.77)#81 | 20.4%(-5.92)#6,447 |
| 82. | Glen Ridge | 14.5% | 23.2%(-8.72)#82 | 20.4%(-5.87)#6,528 |
| 83. | Sea Ranch Lakes | 14.6% | 23.2%(-8.66)#83 | 20.4%(-5.82)#6,620 |
| 84. | Indian River Shores | 14.6% | 23.2%(-8.60)#84 | 20.4%(-5.76)#6,724 |
| 85. | Sharpes | 14.7% | 23.2%(-8.51)#85 | 20.4%(-5.67)#6,871 |
| 86. | Pine Ridge Cdp Collier County | 14.8% | 23.2%(-8.46)#86 | 20.4%(-5.62)#6,959 |
| 87. | Pine Ridge Cdp Citrus County | 14.8% | 23.2%(-8.46)#87 | 20.4%(-5.61)#6,964 |
| 88. | Vineyards | 14.9% | 23.2%(-8.36)#88 | 20.4%(-5.52)#7,135 |
| 89. | Bagdad | 14.9% | 23.2%(-8.36)#89 | 20.4%(-5.52)#7,143 |
| 90. | Lake Kerr | 14.9% | 23.2%(-8.34)#90 | 20.4%(-5.50)#7,182 |
| 91. | Seminole Manor | 14.9% | 23.2%(-8.33)#91 | 20.4%(-5.49)#7,185 |
| 92. | Buckingham | 14.9% | 23.2%(-8.32)#92 | 20.4%(-5.47)#7,223 |
| 93. | Welaka | 15.0% | 23.2%(-8.25)#93 | 20.4%(-5.41)#7,322 |
| 94. | Zephyrhills West | 15.0% | 23.2%(-8.24)#94 | 20.4%(-5.40)#7,337 |
| 95. | North Merritt Island | 15.0% | 23.2%(-8.24)#95 | 20.4%(-5.39)#7,351 |
| 96. | Kensington Park | 15.0% | 23.2%(-8.21)#96 | 20.4%(-5.36)#7,422 |
| 97. | Tangerine | 15.1% | 23.2%(-8.11)#97 | 20.4%(-5.27)#7,593 |
| 98. | Englewood | 15.1% | 23.2%(-8.07)#98 | 20.4%(-5.23)#7,646 |
| 99. | Caryville | 15.2% | 23.2%(-8.03)#99 | 20.4%(-5.19)#7,744 |
| 100. | East Bronson | 15.2% | 23.2%(-8.00)#100 | 20.4%(-5.16)#7,802 |
Common Questions
What are the Top 10 Cities with the Lowest Costs of Housing as Percentage of Income in Florida?
Top 10 Cities with the Lowest Costs of Housing as Percentage of Income in Florida are:
#1
7.6%
#2
7.9%
#3
8.5%
#4
8.8%
#5
9.4%
#6
9.5%
#7
9.8%
#8
9.9%
#9
9.9%
#10
10.3%
What city has the Lowest Costs of Housing as Percentage of Income in Florida?
Lake Mack Forest Hills has the Lowest Costs of Housing as Percentage of Income in Florida with 7.6%.
What is the Average Housing Costs as Percentage of Income in the State of Florida?
Average Housing Costs as Percentage of Income in Florida is 23.2%.
What is the Average Housing Costs as Percentage of Income in the United States?
Average Housing Costs as Percentage of Income in the United States is 20.4%.