Cities with the Lowest Costs of Housing as Percentage of Income in Mississippi
RELATED REPORTS & OPTIONS
Lowest Housing Costs / Income
Mississippi
Compare Cities
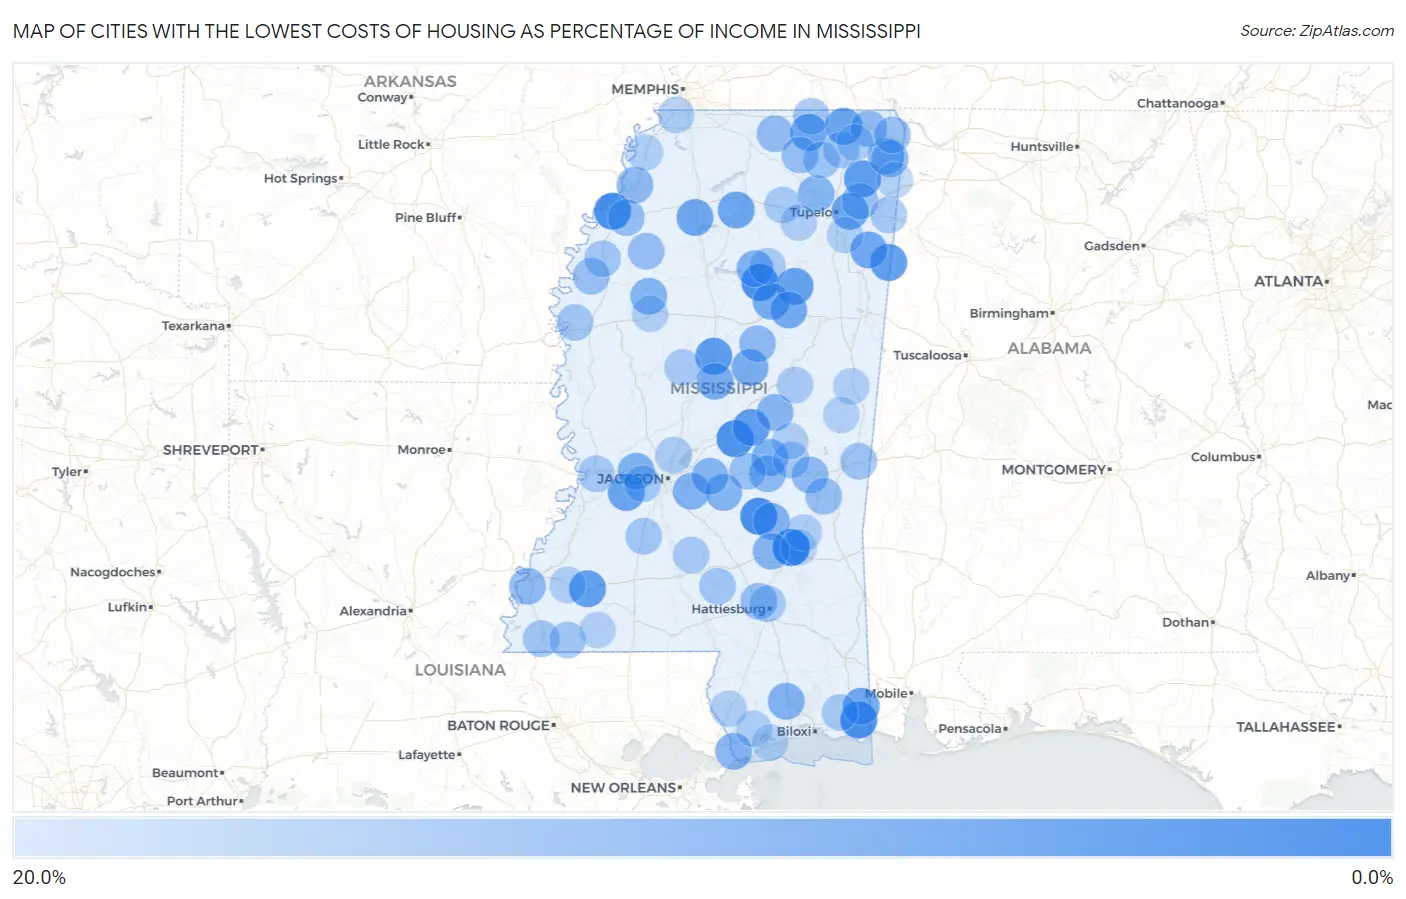
Map of Cities with the Lowest Costs of Housing as Percentage of Income in Mississippi
20.0%
0.0%
Cities with the Lowest Costs of Housing as Percentage of Income in Mississippi
| City | Housing Costs / Income | vs State | vs National | |
| 1. | Sharon | 5.0% | 18.5%(-13.6)#1 | 20.4%(-15.4)#74 |
| 2. | Eastabuchie | 5.3% | 18.5%(-13.3)#2 | 20.4%(-15.1)#99 |
| 3. | Sylvarena | 6.4% | 18.5%(-12.1)#3 | 20.4%(-13.9)#229 |
| 4. | Farrell | 6.5% | 18.5%(-12.0)#4 | 20.4%(-13.8)#252 |
| 5. | Helena | 6.6% | 18.5%(-12.0)#5 | 20.4%(-13.8)#254 |
| 6. | Valley Park | 6.6% | 18.5%(-12.0)#6 | 20.4%(-13.8)#256 |
| 7. | Slate Springs | 6.7% | 18.5%(-11.9)#7 | 20.4%(-13.7)#274 |
| 8. | Lena | 6.9% | 18.5%(-11.6)#8 | 20.4%(-13.4)#324 |
| 9. | Baxterville | 7.5% | 18.5%(-11.0)#9 | 20.4%(-12.8)#443 |
| 10. | West | 8.0% | 18.5%(-10.5)#10 | 20.4%(-12.3)#579 |
| 11. | Marietta | 8.3% | 18.5%(-10.3)#11 | 20.4%(-12.1)#641 |
| 12. | Gattman | 8.4% | 18.5%(-10.2)#12 | 20.4%(-12.0)#688 |
| 13. | Standing Pine | 8.5% | 18.5%(-10.0)#13 | 20.4%(-11.9)#731 |
| 14. | Meadville | 8.6% | 18.5%(-9.94)#14 | 20.4%(-11.8)#763 |
| 15. | Mantee | 8.9% | 18.5%(-9.63)#15 | 20.4%(-11.5)#858 |
| 16. | Falkner | 9.3% | 18.5%(-9.26)#16 | 20.4%(-11.1)#1,019 |
| 17. | Kossuth | 9.3% | 18.5%(-9.25)#17 | 20.4%(-11.1)#1,021 |
| 18. | Mooreville | 9.4% | 18.5%(-9.14)#18 | 20.4%(-11.0)#1,085 |
| 19. | Learned | 9.4% | 18.5%(-9.13)#19 | 20.4%(-11.0)#1,094 |
| 20. | Taylor | 9.6% | 18.5%(-8.94)#20 | 20.4%(-10.8)#1,186 |
| 21. | Big Point | 9.8% | 18.5%(-8.76)#21 | 20.4%(-10.6)#1,286 |
| 22. | Pope | 9.8% | 18.5%(-8.75)#22 | 20.4%(-10.6)#1,302 |
| 23. | Hatley | 9.8% | 18.5%(-8.71)#23 | 20.4%(-10.5)#1,329 |
| 24. | Walthall | 10.3% | 18.5%(-8.29)#24 | 20.4%(-10.1)#1,562 |
| 25. | Mathiston | 10.3% | 18.5%(-8.22)#25 | 20.4%(-10.0)#1,602 |
| 26. | Sallis | 10.6% | 18.5%(-7.97)#26 | 20.4%(-9.80)#1,784 |
| 27. | Ethel | 10.7% | 18.5%(-7.86)#27 | 20.4%(-9.68)#1,863 |
| 28. | Bolton | 11.0% | 18.5%(-7.56)#28 | 20.4%(-9.39)#2,087 |
| 29. | Benton | 11.0% | 18.5%(-7.54)#29 | 20.4%(-9.36)#2,107 |
| 30. | Conehatta | 11.0% | 18.5%(-7.52)#30 | 20.4%(-9.34)#2,120 |
| 31. | Big Creek | 11.2% | 18.5%(-7.35)#31 | 20.4%(-9.18)#2,246 |
| 32. | Pearlington | 11.3% | 18.5%(-7.25)#32 | 20.4%(-9.08)#2,332 |
| 33. | Bay Springs | 11.4% | 18.5%(-7.18)#33 | 20.4%(-9.01)#2,390 |
| 34. | Saucier | 11.4% | 18.5%(-7.16)#34 | 20.4%(-8.99)#2,413 |
| 35. | Robinhood | 11.4% | 18.5%(-7.11)#35 | 20.4%(-8.94)#2,455 |
| 36. | Polkville | 11.6% | 18.5%(-6.98)#36 | 20.4%(-8.81)#2,577 |
| 37. | Pelahatchie | 11.8% | 18.5%(-6.77)#37 | 20.4%(-8.60)#2,803 |
| 38. | Schlater | 11.8% | 18.5%(-6.75)#38 | 20.4%(-8.58)#2,817 |
| 39. | Tishomingo | 11.9% | 18.5%(-6.70)#39 | 20.4%(-8.52)#2,884 |
| 40. | Blue Springs | 11.9% | 18.5%(-6.69)#40 | 20.4%(-8.52)#2,894 |
| 41. | Soso | 11.9% | 18.5%(-6.65)#41 | 20.4%(-8.47)#2,934 |
| 42. | Pearl River | 11.9% | 18.5%(-6.64)#42 | 20.4%(-8.47)#2,938 |
| 43. | Lake | 12.1% | 18.5%(-6.42)#43 | 20.4%(-8.25)#3,151 |
| 44. | French Camp | 12.4% | 18.5%(-6.15)#44 | 20.4%(-7.97)#3,463 |
| 45. | Paden | 12.5% | 18.5%(-6.09)#45 | 20.4%(-7.92)#3,532 |
| 46. | Arkabutla | 12.5% | 18.5%(-6.03)#46 | 20.4%(-7.86)#3,607 |
| 47. | Chunky | 12.5% | 18.5%(-6.03)#47 | 20.4%(-7.85)#3,615 |
| 48. | Lula | 12.5% | 18.5%(-6.00)#48 | 20.4%(-7.83)#3,644 |
| 49. | Cloverdale | 12.6% | 18.5%(-5.99)#49 | 20.4%(-7.82)#3,655 |
| 50. | Glen | 12.7% | 18.5%(-5.87)#50 | 20.4%(-7.70)#3,805 |
| 51. | Snow Lake Shores | 12.8% | 18.5%(-5.75)#51 | 20.4%(-7.58)#3,939 |
| 52. | Rawls Springs | 13.1% | 18.5%(-5.44)#52 | 20.4%(-7.26)#4,337 |
| 53. | Enterprise | 13.2% | 18.5%(-5.38)#53 | 20.4%(-7.20)#4,410 |
| 54. | Blue Mountain | 13.2% | 18.5%(-5.33)#54 | 20.4%(-7.16)#4,490 |
| 55. | Lyon | 13.2% | 18.5%(-5.30)#55 | 20.4%(-7.13)#4,535 |
| 56. | Sumner | 13.3% | 18.5%(-5.28)#56 | 20.4%(-7.11)#4,560 |
| 57. | Pace | 13.4% | 18.5%(-5.11)#57 | 20.4%(-6.94)#4,811 |
| 58. | Mantachie | 13.5% | 18.5%(-5.01)#58 | 20.4%(-6.83)#4,959 |
| 59. | Forest | 13.6% | 18.5%(-4.97)#59 | 20.4%(-6.79)#5,014 |
| 60. | Iuka | 13.6% | 18.5%(-4.90)#60 | 20.4%(-6.73)#5,116 |
| 61. | Toomsuba | 13.8% | 18.5%(-4.80)#61 | 20.4%(-6.62)#5,283 |
| 62. | Dumas | 13.8% | 18.5%(-4.77)#62 | 20.4%(-6.59)#5,328 |
| 63. | Woodville | 14.0% | 18.5%(-4.53)#63 | 20.4%(-6.35)#5,702 |
| 64. | Bassfield | 14.1% | 18.5%(-4.45)#64 | 20.4%(-6.28)#5,833 |
| 65. | Jumpertown | 14.1% | 18.5%(-4.44)#65 | 20.4%(-6.27)#5,856 |
| 66. | Winstonville | 14.2% | 18.5%(-4.36)#66 | 20.4%(-6.19)#6,001 |
| 67. | Hazlehurst | 14.2% | 18.5%(-4.35)#67 | 20.4%(-6.18)#6,027 |
| 68. | Raymond | 14.3% | 18.5%(-4.23)#68 | 20.4%(-6.06)#6,219 |
| 69. | Metcalfe | 14.3% | 18.5%(-4.20)#69 | 20.4%(-6.03)#6,282 |
| 70. | Longview | 14.4% | 18.5%(-4.18)#70 | 20.4%(-6.01)#6,312 |
| 71. | Walnut | 14.4% | 18.5%(-4.16)#71 | 20.4%(-5.99)#6,342 |
| 72. | Centreville | 14.4% | 18.5%(-4.16)#72 | 20.4%(-5.98)#6,351 |
| 73. | Tremont | 14.4% | 18.5%(-4.15)#73 | 20.4%(-5.98)#6,371 |
| 74. | Decatur | 14.5% | 18.5%(-4.04)#74 | 20.4%(-5.86)#6,553 |
| 75. | Beechwood | 14.5% | 18.5%(-4.03)#75 | 20.4%(-5.85)#6,565 |
| 76. | Thaxton | 14.6% | 18.5%(-3.93)#76 | 20.4%(-5.75)#6,726 |
| 77. | Vancleave | 14.7% | 18.5%(-3.88)#77 | 20.4%(-5.71)#6,794 |
| 78. | Glendale | 14.7% | 18.5%(-3.88)#78 | 20.4%(-5.71)#6,801 |
| 79. | Calhoun City | 14.8% | 18.5%(-3.76)#79 | 20.4%(-5.58)#7,029 |
| 80. | Lexington | 14.8% | 18.5%(-3.75)#80 | 20.4%(-5.57)#7,045 |
| 81. | Noxapater | 14.8% | 18.5%(-3.70)#81 | 20.4%(-5.53)#7,126 |
| 82. | New Hebron | 14.8% | 18.5%(-3.70)#82 | 20.4%(-5.53)#7,128 |
| 83. | Lynchburg | 15.0% | 18.5%(-3.59)#83 | 20.4%(-5.42)#7,305 |
| 84. | Rienzi | 15.0% | 18.5%(-3.55)#84 | 20.4%(-5.38)#7,380 |
| 85. | Madison | 15.0% | 18.5%(-3.53)#85 | 20.4%(-5.36)#7,439 |
| 86. | Roxie | 15.1% | 18.5%(-3.42)#86 | 20.4%(-5.25)#7,619 |
| 87. | Heidelberg | 15.1% | 18.5%(-3.42)#87 | 20.4%(-5.24)#7,627 |
| 88. | Algoma | 15.2% | 18.5%(-3.37)#88 | 20.4%(-5.20)#7,719 |
| 89. | Union | 15.2% | 18.5%(-3.33)#89 | 20.4%(-5.15)#7,817 |
| 90. | Hide A Way Lake | 15.3% | 18.5%(-3.25)#90 | 20.4%(-5.08)#7,949 |
| 91. | Kiln | 15.4% | 18.5%(-3.12)#91 | 20.4%(-4.94)#8,200 |
| 92. | Shuqualak | 15.5% | 18.5%(-3.09)#92 | 20.4%(-4.91)#8,267 |
| 93. | Nettleton | 15.5% | 18.5%(-3.07)#93 | 20.4%(-4.90)#8,313 |
| 94. | Mississippi Valley State University | 15.5% | 18.5%(-3.07)#94 | 20.4%(-4.89)#8,319 |
| 95. | Tunica | 15.5% | 18.5%(-3.06)#95 | 20.4%(-4.89)#8,334 |
| 96. | De Kalb | 15.5% | 18.5%(-3.03)#96 | 20.4%(-4.85)#8,412 |
| 97. | Liberty | 15.6% | 18.5%(-2.94)#97 | 20.4%(-4.77)#8,580 |
| 98. | Golden | 15.8% | 18.5%(-2.76)#98 | 20.4%(-4.59)#8,943 |
| 99. | Sandersville | 15.9% | 18.5%(-2.65)#99 | 20.4%(-4.47)#9,189 |
| 100. | Henderson Point | 16.0% | 18.5%(-2.60)#100 | 20.4%(-4.42)#9,291 |
Common Questions
What are the Top 10 Cities with the Lowest Costs of Housing as Percentage of Income in Mississippi?
Top 10 Cities with the Lowest Costs of Housing as Percentage of Income in Mississippi are:
#1
5.0%
#2
6.4%
#3
6.5%
#4
6.6%
#5
6.7%
#6
6.9%
#7
8.0%
#8
8.3%
#9
8.4%
#10
8.5%
What city has the Lowest Costs of Housing as Percentage of Income in Mississippi?
Sharon has the Lowest Costs of Housing as Percentage of Income in Mississippi with 5.0%.
What is the Average Housing Costs as Percentage of Income in the State of Mississippi?
Average Housing Costs as Percentage of Income in Mississippi is 18.5%.
What is the Average Housing Costs as Percentage of Income in the United States?
Average Housing Costs as Percentage of Income in the United States is 20.4%.