Cities with the Lowest Costs of Housing as Percentage of Income in Texas
RELATED REPORTS & OPTIONS
Lowest Housing Costs / Income
Texas
Compare Cities
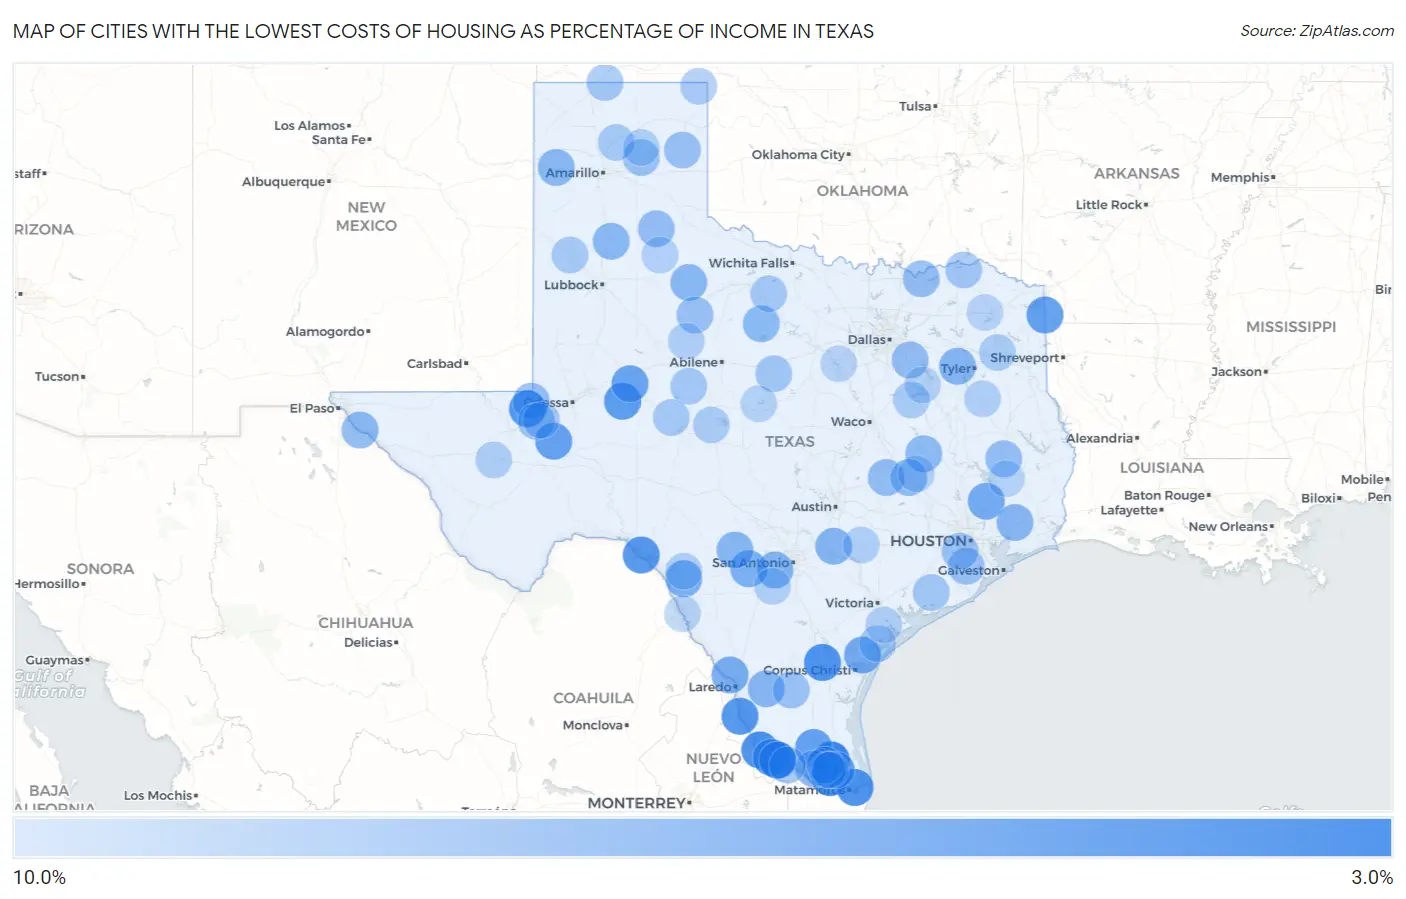
Map of Cities with the Lowest Costs of Housing as Percentage of Income in Texas
10.0%
0.0%
Cities with the Lowest Costs of Housing as Percentage of Income in Texas
| City | Housing Costs / Income | vs State | vs National | |
| 1. | Zapata Ranch | 3.7% | 20.8%(-17.0)#1 | 20.4%(-16.6)#26 |
| 2. | Iglesia Antigua | 4.2% | 20.8%(-16.6)#2 | 20.4%(-16.2)#38 |
| 3. | Allison | 4.2% | 20.8%(-16.6)#3 | 20.4%(-16.2)#39 |
| 4. | La Minita | 4.6% | 20.8%(-16.2)#4 | 20.4%(-15.8)#52 |
| 5. | Reid Hope King | 4.7% | 20.8%(-16.1)#5 | 20.4%(-15.7)#57 |
| 6. | Alfred | 4.8% | 20.8%(-16.0)#6 | 20.4%(-15.6)#64 |
| 7. | Santa Cruz | 4.9% | 20.8%(-15.9)#7 | 20.4%(-15.5)#70 |
| 8. | Tow | 5.0% | 20.8%(-15.8)#8 | 20.4%(-15.3)#76 |
| 9. | San Ygnacio | 5.1% | 20.8%(-15.7)#9 | 20.4%(-15.3)#80 |
| 10. | Wink | 5.1% | 20.8%(-15.7)#10 | 20.4%(-15.3)#83 |
| 11. | Box Canyon | 5.2% | 20.8%(-15.6)#11 | 20.4%(-15.2)#90 |
| 12. | Mi Ranchito Estate | 5.2% | 20.8%(-15.5)#12 | 20.4%(-15.1)#97 |
| 13. | Juarez | 5.5% | 20.8%(-15.3)#13 | 20.4%(-14.9)#111 |
| 14. | Garden City | 5.7% | 20.8%(-15.1)#14 | 20.4%(-14.7)#125 |
| 15. | Bloomburg | 5.8% | 20.8%(-15.0)#15 | 20.4%(-14.6)#141 |
| 16. | Imperial | 5.9% | 20.8%(-14.9)#16 | 20.4%(-14.5)#157 |
| 17. | Santa Rosa | 6.0% | 20.8%(-14.8)#17 | 20.4%(-14.4)#161 |
| 18. | Linn | 6.0% | 20.8%(-14.8)#18 | 20.4%(-14.4)#162 |
| 19. | Forsan | 6.3% | 20.8%(-14.5)#19 | 20.4%(-14.1)#207 |
| 20. | Beaver Creek | 6.3% | 20.8%(-14.5)#20 | 20.4%(-14.1)#214 |
| 21. | Tradewinds | 6.6% | 20.8%(-14.2)#21 | 20.4%(-13.8)#264 |
| 22. | Neches | 6.7% | 20.8%(-14.1)#22 | 20.4%(-13.7)#271 |
| 23. | North Cleveland | 6.8% | 20.8%(-14.0)#23 | 20.4%(-13.6)#283 |
| 24. | Center Point | 6.9% | 20.8%(-13.9)#24 | 20.4%(-13.5)#305 |
| 25. | Ranchos Penitas West | 6.9% | 20.8%(-13.9)#25 | 20.4%(-13.5)#309 |
| 26. | Petty | 6.9% | 20.8%(-13.9)#26 | 20.4%(-13.4)#323 |
| 27. | Valera | 7.1% | 20.8%(-13.7)#27 | 20.4%(-13.3)#351 |
| 28. | D Hanis | 7.1% | 20.8%(-13.7)#28 | 20.4%(-13.3)#355 |
| 29. | Spofford | 7.1% | 20.8%(-13.7)#29 | 20.4%(-13.3)#358 |
| 30. | Dime Box | 7.2% | 20.8%(-13.6)#30 | 20.4%(-13.2)#370 |
| 31. | Olivarez | 7.4% | 20.8%(-13.3)#31 | 20.4%(-12.9)#421 |
| 32. | Lacoste | 7.6% | 20.8%(-13.2)#32 | 20.4%(-12.8)#455 |
| 33. | Kingsbury | 7.6% | 20.8%(-13.2)#33 | 20.4%(-12.8)#461 |
| 34. | Edom | 7.6% | 20.8%(-13.2)#34 | 20.4%(-12.7)#469 |
| 35. | Utopia | 7.6% | 20.8%(-13.1)#35 | 20.4%(-12.7)#476 |
| 36. | Oilton | 7.7% | 20.8%(-13.1)#36 | 20.4%(-12.7)#481 |
| 37. | Devers | 7.7% | 20.8%(-13.1)#37 | 20.4%(-12.7)#489 |
| 38. | Tornillo | 7.8% | 20.8%(-13.0)#38 | 20.4%(-12.6)#504 |
| 39. | Guthrie | 7.8% | 20.8%(-13.0)#39 | 20.4%(-12.6)#509 |
| 40. | Adrian | 7.8% | 20.8%(-13.0)#40 | 20.4%(-12.5)#528 |
| 41. | Seth Ward | 7.8% | 20.8%(-13.0)#41 | 20.4%(-12.5)#529 |
| 42. | Hilltop Lakes | 7.9% | 20.8%(-12.9)#42 | 20.4%(-12.5)#537 |
| 43. | Woodson | 7.9% | 20.8%(-12.9)#43 | 20.4%(-12.5)#539 |
| 44. | North Alamo | 7.9% | 20.8%(-12.8)#44 | 20.4%(-12.4)#556 |
| 45. | Southwest Sandhill | 8.1% | 20.8%(-12.7)#45 | 20.4%(-12.3)#594 |
| 46. | Milano | 8.2% | 20.8%(-12.6)#46 | 20.4%(-12.2)#621 |
| 47. | Ravenna | 8.2% | 20.8%(-12.6)#47 | 20.4%(-12.2)#625 |
| 48. | Lake Bryan | 8.3% | 20.8%(-12.5)#48 | 20.4%(-12.1)#637 |
| 49. | Rosser | 8.3% | 20.8%(-12.5)#49 | 20.4%(-12.1)#645 |
| 50. | Turkey | 8.3% | 20.8%(-12.5)#50 | 20.4%(-12.1)#653 |
| 51. | Pleasant Hill | 8.3% | 20.8%(-12.5)#51 | 20.4%(-12.1)#656 |
| 52. | Kermit | 8.4% | 20.8%(-12.4)#52 | 20.4%(-12.0)#670 |
| 53. | Aspermont | 8.5% | 20.8%(-12.3)#53 | 20.4%(-11.9)#724 |
| 54. | Laguna Seca | 8.5% | 20.8%(-12.3)#54 | 20.4%(-11.9)#727 |
| 55. | Wingate | 8.5% | 20.8%(-12.3)#55 | 20.4%(-11.8)#742 |
| 56. | Rosharon | 8.6% | 20.8%(-12.2)#56 | 20.4%(-11.8)#746 |
| 57. | Mobeetie | 8.6% | 20.8%(-12.2)#57 | 20.4%(-11.8)#754 |
| 58. | White Deer | 8.6% | 20.8%(-12.2)#58 | 20.4%(-11.8)#767 |
| 59. | Realitos | 8.6% | 20.8%(-12.2)#59 | 20.4%(-11.8)#768 |
| 60. | Wickett | 8.7% | 20.8%(-12.1)#60 | 20.4%(-11.7)#781 |
| 61. | Nina | 8.7% | 20.8%(-12.0)#61 | 20.4%(-11.6)#799 |
| 62. | Cade Lakes | 8.8% | 20.8%(-12.0)#62 | 20.4%(-11.6)#806 |
| 63. | Fifth Street | 8.8% | 20.8%(-12.0)#63 | 20.4%(-11.6)#814 |
| 64. | Alamo Beach | 8.8% | 20.8%(-11.9)#64 | 20.4%(-11.5)#834 |
| 65. | Powderly | 8.9% | 20.8%(-11.9)#65 | 20.4%(-11.5)#851 |
| 66. | Carbon | 8.9% | 20.8%(-11.9)#66 | 20.4%(-11.5)#857 |
| 67. | Thorntonville | 8.9% | 20.8%(-11.9)#67 | 20.4%(-11.4)#861 |
| 68. | Ben Wheeler | 9.0% | 20.8%(-11.8)#68 | 20.4%(-11.4)#894 |
| 69. | Texhoma | 9.0% | 20.8%(-11.8)#69 | 20.4%(-11.3)#910 |
| 70. | Markham | 9.0% | 20.8%(-11.7)#70 | 20.4%(-11.3)#914 |
| 71. | Blackwell | 9.1% | 20.8%(-11.7)#71 | 20.4%(-11.3)#946 |
| 72. | Megargel | 9.2% | 20.8%(-11.6)#72 | 20.4%(-11.2)#957 |
| 73. | Fritch | 9.3% | 20.8%(-11.5)#73 | 20.4%(-11.1)#1,013 |
| 74. | Carlsbad | 9.3% | 20.8%(-11.5)#74 | 20.4%(-11.1)#1,014 |
| 75. | Amherst | 9.3% | 20.8%(-11.5)#75 | 20.4%(-11.1)#1,018 |
| 76. | Holiday Beach | 9.3% | 20.8%(-11.5)#76 | 20.4%(-11.1)#1,035 |
| 77. | Heidelberg | 9.4% | 20.8%(-11.4)#77 | 20.4%(-11.0)#1,062 |
| 78. | Follett | 9.4% | 20.8%(-11.4)#78 | 20.4%(-11.0)#1,088 |
| 79. | Paint Rock | 9.5% | 20.8%(-11.3)#79 | 20.4%(-10.9)#1,122 |
| 80. | La Coma Heights | 9.5% | 20.8%(-11.3)#80 | 20.4%(-10.9)#1,126 |
| 81. | Richland | 9.5% | 20.8%(-11.3)#81 | 20.4%(-10.9)#1,134 |
| 82. | Union Grove | 9.5% | 20.8%(-11.3)#82 | 20.4%(-10.9)#1,147 |
| 83. | Fort Clark Springs | 9.6% | 20.8%(-11.2)#83 | 20.4%(-10.8)#1,159 |
| 84. | Balmorhea | 9.6% | 20.8%(-11.2)#84 | 20.4%(-10.8)#1,179 |
| 85. | Rowena | 9.6% | 20.8%(-11.2)#85 | 20.4%(-10.8)#1,185 |
| 86. | Bigfoot | 9.6% | 20.8%(-11.2)#86 | 20.4%(-10.7)#1,199 |
| 87. | Skellytown | 9.6% | 20.8%(-11.1)#87 | 20.4%(-10.7)#1,206 |
| 88. | Tivoli | 9.7% | 20.8%(-11.1)#88 | 20.4%(-10.7)#1,210 |
| 89. | Gallatin | 9.7% | 20.8%(-11.1)#89 | 20.4%(-10.7)#1,223 |
| 90. | Waelder | 9.7% | 20.8%(-11.1)#90 | 20.4%(-10.6)#1,254 |
| 91. | Roby | 9.7% | 20.8%(-11.1)#91 | 20.4%(-10.6)#1,255 |
| 92. | Wixon Valley | 9.8% | 20.8%(-11.0)#92 | 20.4%(-10.6)#1,268 |
| 93. | Matador | 9.8% | 20.8%(-11.0)#93 | 20.4%(-10.6)#1,285 |
| 94. | Goodlow | 9.9% | 20.8%(-10.9)#94 | 20.4%(-10.5)#1,331 |
| 95. | Lake Brownwood | 9.9% | 20.8%(-10.9)#95 | 20.4%(-10.5)#1,347 |
| 96. | Ratamosa | 9.9% | 20.8%(-10.9)#96 | 20.4%(-10.5)#1,355 |
| 97. | Indian Springs | 9.9% | 20.8%(-10.8)#97 | 20.4%(-10.4)#1,377 |
| 98. | Winfield | 9.9% | 20.8%(-10.8)#98 | 20.4%(-10.4)#1,378 |
| 99. | Rosita | 10.0% | 20.8%(-10.8)#99 | 20.4%(-10.4)#1,407 |
| 100. | Decordova | 10.0% | 20.8%(-10.8)#100 | 20.4%(-10.4)#1,412 |
Common Questions
What are the Top 10 Cities with the Lowest Costs of Housing as Percentage of Income in Texas?
Top 10 Cities with the Lowest Costs of Housing as Percentage of Income in Texas are:
#1
3.7%
#2
4.2%
#3
4.6%
#4
4.7%
#5
4.8%
#6
4.9%
#7
5.1%
#8
5.1%
#9
5.2%
#10
5.2%
What city has the Lowest Costs of Housing as Percentage of Income in Texas?
Zapata Ranch has the Lowest Costs of Housing as Percentage of Income in Texas with 3.7%.
What is the Average Housing Costs as Percentage of Income in the State of Texas?
Average Housing Costs as Percentage of Income in Texas is 20.8%.
What is the Average Housing Costs as Percentage of Income in the United States?
Average Housing Costs as Percentage of Income in the United States is 20.4%.