Cities with the Lowest Costs of Housing as Percentage of Income in North Carolina
RELATED REPORTS & OPTIONS
Lowest Housing Costs / Income
North Carolina
Compare Cities
Map of Cities with the Lowest Costs of Housing as Percentage of Income in North Carolina
15.0%
0.0%
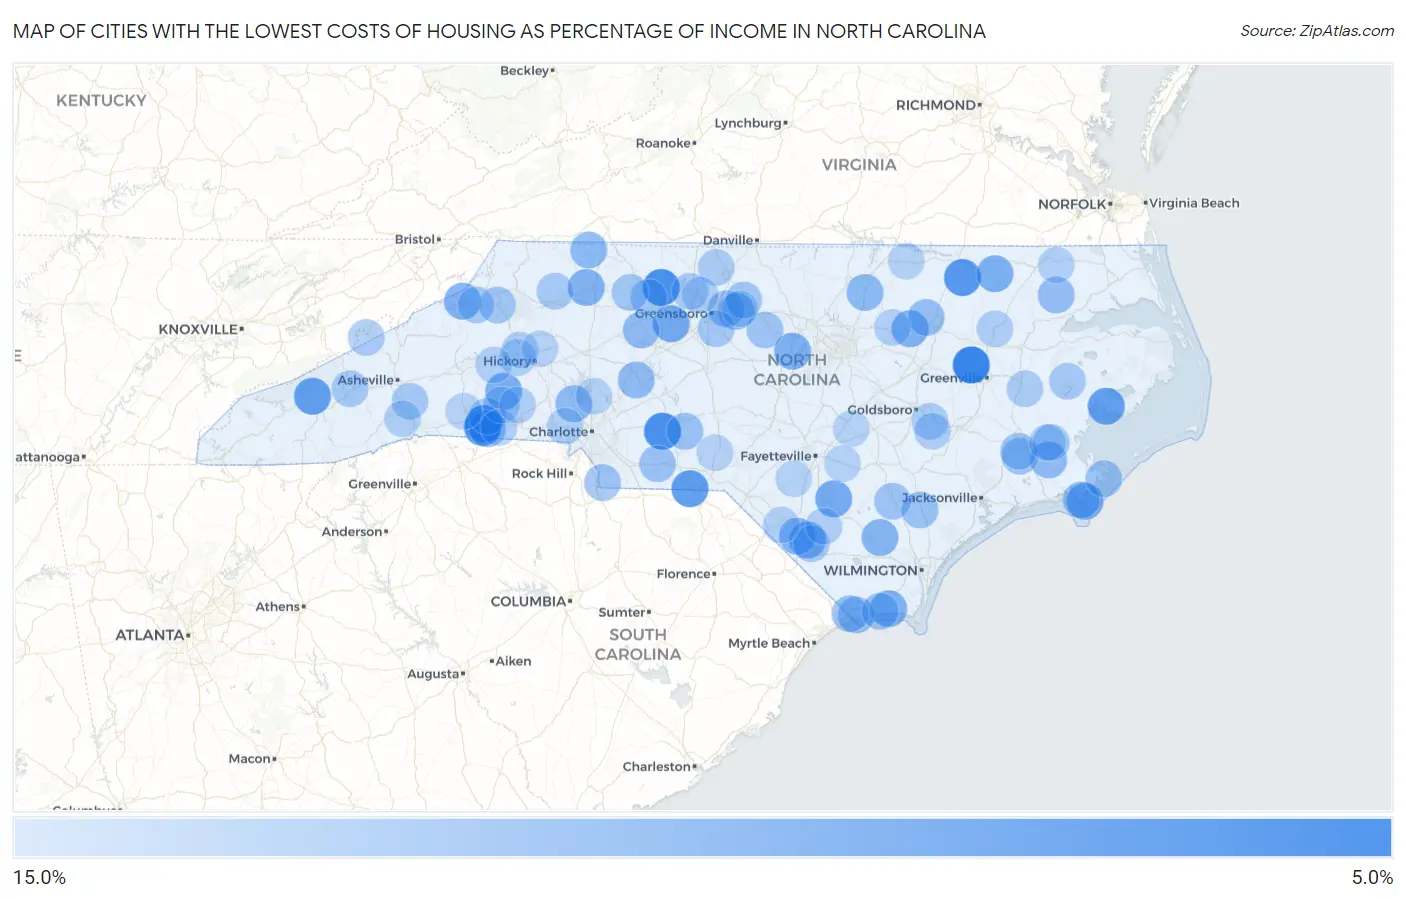
Cities with the Lowest Costs of Housing as Percentage of Income in North Carolina
| City | Housing Costs / Income | vs State | vs National | |
| 1. | Falkland | 5.1% | 19.6%(-14.4)#1 | 20.4%(-15.2)#89 |
| 2. | Jackson Springs | 5.5% | 19.6%(-14.1)#2 | 20.4%(-14.9)#108 |
| 3. | Caroleen | 6.3% | 19.6%(-13.3)#3 | 20.4%(-14.1)#202 |
| 4. | Germanton | 6.4% | 19.6%(-13.2)#4 | 20.4%(-14.0)#225 |
| 5. | Aquadale | 6.5% | 19.6%(-13.1)#5 | 20.4%(-13.9)#240 |
| 6. | Halifax | 7.5% | 19.6%(-12.1)#6 | 20.4%(-12.9)#434 |
| 7. | Henrietta | 7.7% | 19.6%(-11.9)#7 | 20.4%(-12.7)#485 |
| 8. | Deep Run | 7.9% | 19.6%(-11.6)#8 | 20.4%(-12.4)#555 |
| 9. | Mcfarlan | 8.0% | 19.6%(-11.6)#9 | 20.4%(-12.4)#561 |
| 10. | Cherokee | 8.2% | 19.6%(-11.4)#10 | 20.4%(-12.2)#624 |
| 11. | Swan Quarter | 8.4% | 19.6%(-11.2)#11 | 20.4%(-12.0)#697 |
| 12. | Alexis | 9.2% | 19.6%(-10.3)#12 | 20.4%(-11.1)#993 |
| 13. | Wallburg | 9.5% | 19.6%(-10.1)#13 | 20.4%(-10.9)#1,142 |
| 14. | White Oak | 9.7% | 19.6%(-9.88)#14 | 20.4%(-10.7)#1,240 |
| 15. | Marshallberg | 9.7% | 19.6%(-9.85)#15 | 20.4%(-10.6)#1,257 |
| 16. | Casar | 10.1% | 19.6%(-9.43)#16 | 20.4%(-10.2)#1,499 |
| 17. | Lasker | 10.2% | 19.6%(-9.34)#17 | 20.4%(-10.1)#1,550 |
| 18. | Elk Park | 10.4% | 19.6%(-9.15)#18 | 20.4%(-9.95)#1,668 |
| 19. | Fearrington Village | 10.4% | 19.6%(-9.14)#19 | 20.4%(-9.93)#1,683 |
| 20. | Grandfather | 10.5% | 19.6%(-9.12)#20 | 20.4%(-9.92)#1,695 |
| 21. | Momeyer | 10.5% | 19.6%(-9.11)#21 | 20.4%(-9.90)#1,705 |
| 22. | Varnamtown | 10.5% | 19.6%(-9.09)#22 | 20.4%(-9.88)#1,723 |
| 23. | Boardman | 10.5% | 19.6%(-9.06)#23 | 20.4%(-9.85)#1,739 |
| 24. | Pleasant Hill | 10.5% | 19.6%(-9.03)#24 | 20.4%(-9.83)#1,761 |
| 25. | Roberdel | 10.6% | 19.6%(-9.02)#25 | 20.4%(-9.82)#1,768 |
| 26. | Linville | 10.6% | 19.6%(-9.01)#26 | 20.4%(-9.81)#1,776 |
| 27. | Kelly | 10.8% | 19.6%(-8.75)#27 | 20.4%(-9.54)#1,965 |
| 28. | Proctorville | 10.9% | 19.6%(-8.69)#28 | 20.4%(-9.49)#2,010 |
| 29. | Yadkin College | 10.9% | 19.6%(-8.65)#29 | 20.4%(-9.45)#2,039 |
| 30. | Lowgap | 11.3% | 19.6%(-8.28)#30 | 20.4%(-9.07)#2,334 |
| 31. | Kittrell | 11.4% | 19.6%(-8.18)#31 | 20.4%(-8.97)#2,423 |
| 32. | Advance | 11.6% | 19.6%(-7.95)#32 | 20.4%(-8.75)#2,639 |
| 33. | Faith | 11.7% | 19.6%(-7.93)#33 | 20.4%(-8.72)#2,659 |
| 34. | Lowesville | 11.7% | 19.6%(-7.90)#34 | 20.4%(-8.69)#2,691 |
| 35. | Arapahoe | 11.7% | 19.6%(-7.90)#35 | 20.4%(-8.69)#2,692 |
| 36. | Gold Hill | 11.7% | 19.6%(-7.90)#36 | 20.4%(-8.69)#2,696 |
| 37. | Whitsett | 11.8% | 19.6%(-7.81)#37 | 20.4%(-8.60)#2,798 |
| 38. | Colerain | 11.9% | 19.6%(-7.67)#38 | 20.4%(-8.46)#2,943 |
| 39. | Governors Club | 12.0% | 19.6%(-7.59)#39 | 20.4%(-8.39)#3,017 |
| 40. | Sunset Beach | 12.1% | 19.6%(-7.50)#40 | 20.4%(-8.30)#3,104 |
| 41. | Gloucester | 12.1% | 19.6%(-7.48)#41 | 20.4%(-8.27)#3,128 |
| 42. | Cliffside | 12.1% | 19.6%(-7.44)#42 | 20.4%(-8.24)#3,166 |
| 43. | Red Oak | 12.2% | 19.6%(-7.42)#43 | 20.4%(-8.22)#3,194 |
| 44. | Carolina Shores | 12.3% | 19.6%(-7.31)#44 | 20.4%(-8.11)#3,322 |
| 45. | Mcleansville | 12.3% | 19.6%(-7.26)#45 | 20.4%(-8.05)#3,380 |
| 46. | Peachland | 12.4% | 19.6%(-7.17)#46 | 20.4%(-7.96)#3,477 |
| 47. | Watha | 12.4% | 19.6%(-7.14)#47 | 20.4%(-7.94)#3,507 |
| 48. | Mount Gilead | 12.4% | 19.6%(-7.14)#48 | 20.4%(-7.93)#3,515 |
| 49. | Brices Creek | 12.5% | 19.6%(-7.05)#49 | 20.4%(-7.85)#3,625 |
| 50. | Holden Beach | 12.6% | 19.6%(-7.03)#50 | 20.4%(-7.82)#3,656 |
| 51. | Jaars | 12.6% | 19.6%(-6.97)#51 | 20.4%(-7.76)#3,725 |
| 52. | Atlantic | 12.7% | 19.6%(-6.88)#52 | 20.4%(-7.67)#3,828 |
| 53. | Smithtown | 12.7% | 19.6%(-6.84)#53 | 20.4%(-7.64)#3,861 |
| 54. | Harrells | 12.8% | 19.6%(-6.79)#54 | 20.4%(-7.58)#3,935 |
| 55. | Trent Woods | 12.8% | 19.6%(-6.77)#55 | 20.4%(-7.56)#3,962 |
| 56. | Saxapahaw | 12.8% | 19.6%(-6.76)#56 | 20.4%(-7.55)#3,978 |
| 57. | Blowing Rock | 12.9% | 19.6%(-6.73)#57 | 20.4%(-7.53)#4,018 |
| 58. | Bethania | 12.9% | 19.6%(-6.64)#58 | 20.4%(-7.44)#4,110 |
| 59. | East Bend | 13.0% | 19.6%(-6.56)#59 | 20.4%(-7.36)#4,206 |
| 60. | Ossipee | 13.0% | 19.6%(-6.55)#60 | 20.4%(-7.34)#4,226 |
| 61. | Alliance | 13.1% | 19.6%(-6.46)#61 | 20.4%(-7.26)#4,338 |
| 62. | Pleasant Garden | 13.2% | 19.6%(-6.43)#62 | 20.4%(-7.22)#4,381 |
| 63. | Hoopers Creek | 13.2% | 19.6%(-6.37)#63 | 20.4%(-7.16)#4,485 |
| 64. | Evergreen | 13.3% | 19.6%(-6.28)#64 | 20.4%(-7.08)#4,613 |
| 65. | Lake Junaluska | 13.3% | 19.6%(-6.26)#65 | 20.4%(-7.05)#4,638 |
| 66. | Mulberry | 13.4% | 19.6%(-6.22)#66 | 20.4%(-7.02)#4,691 |
| 67. | Sugar Mountain | 13.4% | 19.6%(-6.22)#67 | 20.4%(-7.01)#4,705 |
| 68. | Pantego | 13.4% | 19.6%(-6.14)#68 | 20.4%(-6.93)#4,816 |
| 69. | Ellenboro | 13.5% | 19.6%(-6.13)#69 | 20.4%(-6.92)#4,820 |
| 70. | Stokesdale | 13.5% | 19.6%(-6.06)#70 | 20.4%(-6.86)#4,916 |
| 71. | Hot Springs | 13.5% | 19.6%(-6.05)#71 | 20.4%(-6.85)#4,932 |
| 72. | Walnut Creek | 13.6% | 19.6%(-5.95)#72 | 20.4%(-6.74)#5,101 |
| 73. | Wentworth | 13.7% | 19.6%(-5.89)#73 | 20.4%(-6.69)#5,179 |
| 74. | Washington Park | 13.8% | 19.6%(-5.82)#74 | 20.4%(-6.62)#5,297 |
| 75. | Grantsboro | 13.8% | 19.6%(-5.78)#75 | 20.4%(-6.58)#5,357 |
| 76. | Seven Springs | 13.8% | 19.6%(-5.77)#76 | 20.4%(-6.56)#5,377 |
| 77. | Bladenboro | 13.8% | 19.6%(-5.76)#77 | 20.4%(-6.56)#5,392 |
| 78. | Oak City | 13.9% | 19.6%(-5.66)#78 | 20.4%(-6.46)#5,542 |
| 79. | Polkville | 13.9% | 19.6%(-5.64)#79 | 20.4%(-6.43)#5,579 |
| 80. | Boiling Springs | 14.0% | 19.6%(-5.60)#80 | 20.4%(-6.39)#5,635 |
| 81. | Fallston | 14.0% | 19.6%(-5.57)#81 | 20.4%(-6.37)#5,681 |
| 82. | Laurel Park | 14.0% | 19.6%(-5.55)#82 | 20.4%(-6.35)#5,711 |
| 83. | Connelly Springs | 14.0% | 19.6%(-5.55)#83 | 20.4%(-6.34)#5,725 |
| 84. | Lake Royale | 14.0% | 19.6%(-5.54)#84 | 20.4%(-6.33)#5,740 |
| 85. | Summerfield | 14.1% | 19.6%(-5.52)#85 | 20.4%(-6.32)#5,768 |
| 86. | Emma | 14.1% | 19.6%(-5.52)#86 | 20.4%(-6.31)#5,780 |
| 87. | Mcadenville | 14.1% | 19.6%(-5.49)#87 | 20.4%(-6.28)#5,829 |
| 88. | Mcdonald | 14.2% | 19.6%(-5.42)#88 | 20.4%(-6.21)#5,967 |
| 89. | Sawmills | 14.2% | 19.6%(-5.38)#89 | 20.4%(-6.18)#6,022 |
| 90. | Salem | 14.2% | 19.6%(-5.37)#90 | 20.4%(-6.17)#6,043 |
| 91. | Gatesville | 14.2% | 19.6%(-5.37)#91 | 20.4%(-6.17)#6,050 |
| 92. | Davidson | 14.3% | 19.6%(-5.29)#92 | 20.4%(-6.08)#6,195 |
| 93. | Lumber Bridge | 14.3% | 19.6%(-5.26)#93 | 20.4%(-6.05)#6,230 |
| 94. | Plain View | 14.4% | 19.6%(-5.22)#94 | 20.4%(-6.01)#6,311 |
| 95. | Macon | 14.4% | 19.6%(-5.21)#95 | 20.4%(-6.01)#6,317 |
| 96. | Autryville | 14.4% | 19.6%(-5.21)#96 | 20.4%(-6.00)#6,320 |
| 97. | Gibsonville | 14.4% | 19.6%(-5.19)#97 | 20.4%(-5.98)#6,356 |
| 98. | Bethlehem | 14.4% | 19.6%(-5.17)#98 | 20.4%(-5.96)#6,398 |
| 99. | Ellerbe | 14.4% | 19.6%(-5.15)#99 | 20.4%(-5.95)#6,419 |
| 100. | Rutherfordton | 14.5% | 19.6%(-5.12)#100 | 20.4%(-5.91)#6,473 |
Common Questions
What are the Top 10 Cities with the Lowest Costs of Housing as Percentage of Income in North Carolina?
Top 10 Cities with the Lowest Costs of Housing as Percentage of Income in North Carolina are:
What city has the Lowest Costs of Housing as Percentage of Income in North Carolina?
Falkland has the Lowest Costs of Housing as Percentage of Income in North Carolina with 5.1%.
What is the Average Housing Costs as Percentage of Income in the State of North Carolina?
Average Housing Costs as Percentage of Income in North Carolina is 19.6%.
What is the Average Housing Costs as Percentage of Income in the United States?
Average Housing Costs as Percentage of Income in the United States is 20.4%.