Cities with the Lowest Costs of Housing as Percentage of Income in Oklahoma
RELATED REPORTS & OPTIONS
Lowest Housing Costs / Income
Oklahoma
Compare Cities
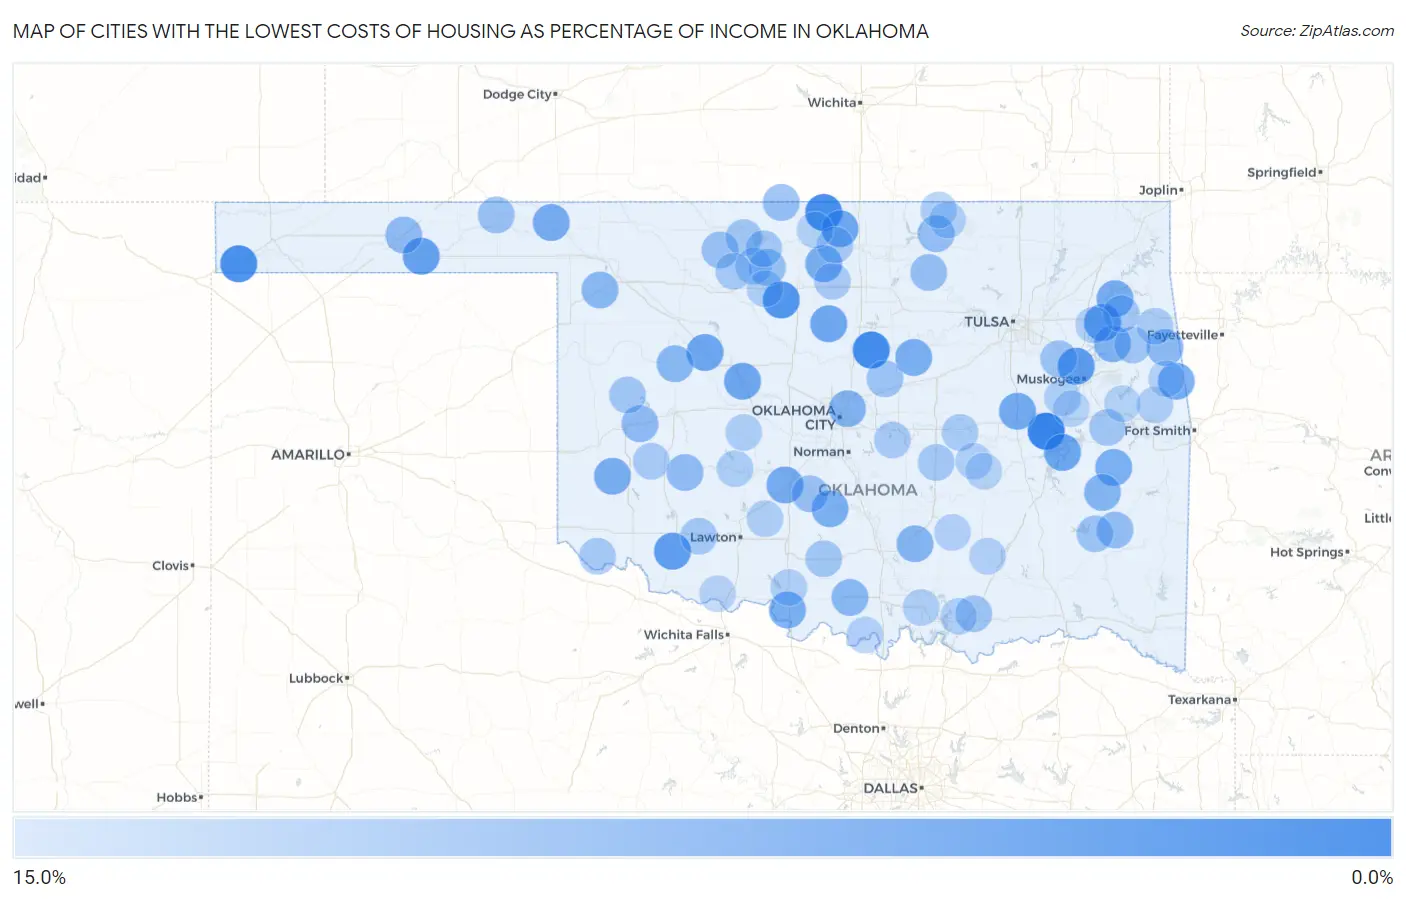
Map of Cities with the Lowest Costs of Housing as Percentage of Income in Oklahoma
15.0%
0.0%
Cities with the Lowest Costs of Housing as Percentage of Income in Oklahoma
| City | Housing Costs / Income | vs State | vs National | |
| 1. | Stidham | 2.2% | 18.1%(-15.8)#1 | 20.4%(-18.2)#1 |
| 2. | Coyle | 3.0% | 18.1%(-15.1)#2 | 20.4%(-17.4)#7 |
| 3. | Renfrow | 3.2% | 18.1%(-14.9)#3 | 20.4%(-17.2)#14 |
| 4. | Felt | 3.3% | 18.1%(-14.8)#4 | 20.4%(-17.1)#17 |
| 5. | Drummond | 3.9% | 18.1%(-14.2)#5 | 20.4%(-16.5)#30 |
| 6. | Tullahassee | 4.6% | 18.1%(-13.4)#6 | 20.4%(-15.7)#54 |
| 7. | Manitou | 4.7% | 18.1%(-13.3)#7 | 20.4%(-15.6)#61 |
| 8. | Hardesty | 5.1% | 18.1%(-13.0)#8 | 20.4%(-15.3)#84 |
| 9. | Ballou | 5.2% | 18.1%(-12.9)#9 | 20.4%(-15.2)#95 |
| 10. | Carlton Landing | 5.5% | 18.1%(-12.6)#10 | 20.4%(-14.9)#112 |
| 11. | Oakwood | 5.5% | 18.1%(-12.5)#11 | 20.4%(-14.8)#115 |
| 12. | Deer Creek | 5.7% | 18.1%(-12.4)#12 | 20.4%(-14.7)#126 |
| 13. | Marshall | 5.7% | 18.1%(-12.4)#13 | 20.4%(-14.7)#130 |
| 14. | Greenfield | 5.7% | 18.1%(-12.3)#14 | 20.4%(-14.6)#132 |
| 15. | Bug Tussle | 5.8% | 18.1%(-12.3)#15 | 20.4%(-14.6)#135 |
| 16. | Schulter | 5.9% | 18.1%(-12.2)#16 | 20.4%(-14.5)#155 |
| 17. | Golden | 6.1% | 18.1%(-12.0)#17 | 20.4%(-14.3)#178 |
| 18. | Norge | 6.2% | 18.1%(-11.9)#18 | 20.4%(-14.2)#186 |
| 19. | Gate | 6.2% | 18.1%(-11.8)#19 | 20.4%(-14.1)#198 |
| 20. | Bell | 6.3% | 18.1%(-11.8)#20 | 20.4%(-14.1)#200 |
| 21. | Willow | 6.3% | 18.1%(-11.8)#21 | 20.4%(-14.1)#211 |
| 22. | Hunter | 6.3% | 18.1%(-11.7)#22 | 20.4%(-14.0)#216 |
| 23. | Durham | 6.4% | 18.1%(-11.7)#23 | 20.4%(-14.0)#218 |
| 24. | Wickliffe | 6.4% | 18.1%(-11.7)#24 | 20.4%(-14.0)#221 |
| 25. | Pontotoc | 6.4% | 18.1%(-11.7)#25 | 20.4%(-14.0)#226 |
| 26. | Sugden | 6.5% | 18.1%(-11.6)#26 | 20.4%(-13.9)#236 |
| 27. | Agra | 6.5% | 18.1%(-11.6)#27 | 20.4%(-13.9)#239 |
| 28. | Lequire | 6.5% | 18.1%(-11.6)#28 | 20.4%(-13.9)#242 |
| 29. | Erin Springs | 6.5% | 18.1%(-11.6)#29 | 20.4%(-13.9)#246 |
| 30. | Sand Point | 6.5% | 18.1%(-11.6)#30 | 20.4%(-13.9)#248 |
| 31. | Lost City | 6.8% | 18.1%(-11.3)#31 | 20.4%(-13.6)#287 |
| 32. | Adams | 6.8% | 18.1%(-11.3)#32 | 20.4%(-13.6)#291 |
| 33. | Lake Aluma | 7.0% | 18.1%(-11.1)#33 | 20.4%(-13.4)#333 |
| 34. | Cave Spring | 7.0% | 18.1%(-11.1)#34 | 20.4%(-13.4)#335 |
| 35. | Panola | 7.1% | 18.1%(-11.0)#35 | 20.4%(-13.3)#349 |
| 36. | Hickory | 7.1% | 18.1%(-11.0)#36 | 20.4%(-13.3)#352 |
| 37. | Emet | 7.2% | 18.1%(-10.9)#37 | 20.4%(-13.2)#376 |
| 38. | Fargo | 7.4% | 18.1%(-10.7)#38 | 20.4%(-13.0)#405 |
| 39. | Putnam | 7.4% | 18.1%(-10.7)#39 | 20.4%(-13.0)#409 |
| 40. | Wilson | 7.4% | 18.1%(-10.7)#40 | 20.4%(-13.0)#414 |
| 41. | Christie | 7.5% | 18.1%(-10.6)#41 | 20.4%(-12.9)#429 |
| 42. | Canute | 7.7% | 18.1%(-10.3)#42 | 20.4%(-12.6)#497 |
| 43. | Gotebo | 7.8% | 18.1%(-10.3)#43 | 20.4%(-12.6)#514 |
| 44. | Optima | 7.8% | 18.1%(-10.2)#44 | 20.4%(-12.5)#527 |
| 45. | Dixon | 8.0% | 18.1%(-10.1)#45 | 20.4%(-12.4)#576 |
| 46. | Albion | 8.0% | 18.1%(-10.1)#46 | 20.4%(-12.4)#577 |
| 47. | Shidler | 8.1% | 18.1%(-9.94)#47 | 20.4%(-12.2)#607 |
| 48. | Manchester | 8.2% | 18.1%(-9.88)#48 | 20.4%(-12.2)#620 |
| 49. | Goltry | 8.2% | 18.1%(-9.87)#49 | 20.4%(-12.2)#623 |
| 50. | Ralston | 8.2% | 18.1%(-9.83)#50 | 20.4%(-12.1)#633 |
| 51. | Forgan | 8.3% | 18.1%(-9.76)#51 | 20.4%(-12.1)#657 |
| 52. | Alex | 8.4% | 18.1%(-9.68)#52 | 20.4%(-12.0)#684 |
| 53. | Dacoma | 8.4% | 18.1%(-9.67)#53 | 20.4%(-12.0)#689 |
| 54. | Tuskahoma | 8.6% | 18.1%(-9.51)#54 | 20.4%(-11.8)#750 |
| 55. | Fallis | 8.7% | 18.1%(-9.41)#55 | 20.4%(-11.7)#780 |
| 56. | Redbird | 8.7% | 18.1%(-9.40)#56 | 20.4%(-11.7)#782 |
| 57. | Armstrong | 8.7% | 18.1%(-9.36)#57 | 20.4%(-11.7)#789 |
| 58. | Steely Hollow | 8.9% | 18.1%(-9.19)#58 | 20.4%(-11.5)#843 |
| 59. | Fox | 8.9% | 18.1%(-9.18)#59 | 20.4%(-11.5)#846 |
| 60. | Rose | 8.9% | 18.1%(-9.16)#60 | 20.4%(-11.5)#853 |
| 61. | Velma | 8.9% | 18.1%(-9.13)#61 | 20.4%(-11.4)#863 |
| 62. | Hammon | 9.0% | 18.1%(-9.11)#62 | 20.4%(-11.4)#881 |
| 63. | Simms | 9.0% | 18.1%(-9.10)#63 | 20.4%(-11.4)#883 |
| 64. | Cherokee | 9.0% | 18.1%(-9.08)#64 | 20.4%(-11.4)#890 |
| 65. | Cookson | 9.1% | 18.1%(-9.01)#65 | 20.4%(-11.3)#920 |
| 66. | Helena | 9.1% | 18.1%(-8.96)#66 | 20.4%(-11.3)#944 |
| 67. | Jet | 9.1% | 18.1%(-8.93)#67 | 20.4%(-11.2)#954 |
| 68. | Bowlegs | 9.2% | 18.1%(-8.89)#68 | 20.4%(-11.2)#970 |
| 69. | Indiahoma | 9.2% | 18.1%(-8.88)#69 | 20.4%(-11.2)#976 |
| 70. | Eldorado | 9.2% | 18.1%(-8.85)#70 | 20.4%(-11.2)#983 |
| 71. | Aline | 9.3% | 18.1%(-8.78)#71 | 20.4%(-11.1)#1,020 |
| 72. | Bethel Acres | 9.4% | 18.1%(-8.71)#72 | 20.4%(-11.0)#1,056 |
| 73. | Sentinel | 9.4% | 18.1%(-8.62)#73 | 20.4%(-10.9)#1,113 |
| 74. | Garber | 9.5% | 18.1%(-8.61)#74 | 20.4%(-10.9)#1,117 |
| 75. | Chewey | 9.5% | 18.1%(-8.60)#75 | 20.4%(-10.9)#1,121 |
| 76. | Cromwell | 9.5% | 18.1%(-8.57)#76 | 20.4%(-10.9)#1,131 |
| 77. | Lamont | 9.6% | 18.1%(-8.49)#77 | 20.4%(-10.8)#1,173 |
| 78. | Sterling | 9.6% | 18.1%(-8.45)#78 | 20.4%(-10.8)#1,195 |
| 79. | Fort Cobb | 9.7% | 18.1%(-8.37)#79 | 20.4%(-10.7)#1,241 |
| 80. | Lookeba | 9.7% | 18.1%(-8.36)#80 | 20.4%(-10.7)#1,243 |
| 81. | Meno | 9.7% | 18.1%(-8.35)#81 | 20.4%(-10.7)#1,250 |
| 82. | Foraker | 9.8% | 18.1%(-8.30)#82 | 20.4%(-10.6)#1,269 |
| 83. | Grainola | 9.8% | 18.1%(-8.29)#83 | 20.4%(-10.6)#1,277 |
| 84. | Pin Oak Acres | 9.8% | 18.1%(-8.29)#84 | 20.4%(-10.6)#1,280 |
| 85. | Addington | 9.8% | 18.1%(-8.28)#85 | 20.4%(-10.6)#1,292 |
| 86. | Oakland | 9.8% | 18.1%(-8.27)#86 | 20.4%(-10.6)#1,303 |
| 87. | Brushy | 9.8% | 18.1%(-8.26)#87 | 20.4%(-10.6)#1,309 |
| 88. | Wainwright | 9.8% | 18.1%(-8.25)#88 | 20.4%(-10.6)#1,315 |
| 89. | Yeager | 9.8% | 18.1%(-8.23)#89 | 20.4%(-10.5)#1,328 |
| 90. | Tonkawa Tribal Housing | 9.9% | 18.1%(-8.21)#90 | 20.4%(-10.5)#1,334 |
| 91. | Lehigh | 9.9% | 18.1%(-8.19)#91 | 20.4%(-10.5)#1,342 |
| 92. | Burneyville | 9.9% | 18.1%(-8.15)#92 | 20.4%(-10.5)#1,364 |
| 93. | Silo | 10.0% | 18.1%(-8.11)#93 | 20.4%(-10.4)#1,388 |
| 94. | Stonewall | 10.0% | 18.1%(-8.09)#94 | 20.4%(-10.4)#1,399 |
| 95. | Redbird Smith | 10.1% | 18.1%(-7.96)#95 | 20.4%(-10.3)#1,473 |
| 96. | Medford | 10.1% | 18.1%(-7.96)#96 | 20.4%(-10.3)#1,474 |
| 97. | Rentiesville | 10.1% | 18.1%(-7.94)#97 | 20.4%(-10.2)#1,481 |
| 98. | Devol | 10.2% | 18.1%(-7.91)#98 | 20.4%(-10.2)#1,502 |
| 99. | Horntown | 10.2% | 18.1%(-7.89)#99 | 20.4%(-10.2)#1,509 |
| 100. | Cherry Tree | 10.2% | 18.1%(-7.88)#100 | 20.4%(-10.2)#1,522 |
Common Questions
What are the Top 10 Cities with the Lowest Costs of Housing as Percentage of Income in Oklahoma?
Top 10 Cities with the Lowest Costs of Housing as Percentage of Income in Oklahoma are:
#1
2.2%
#2
3.0%
#3
3.2%
#4
3.3%
#5
3.9%
#6
4.6%
#7
4.7%
#8
5.1%
#9
5.2%
#10
5.5%
What city has the Lowest Costs of Housing as Percentage of Income in Oklahoma?
Stidham has the Lowest Costs of Housing as Percentage of Income in Oklahoma with 2.2%.
What is the Average Housing Costs as Percentage of Income in the State of Oklahoma?
Average Housing Costs as Percentage of Income in Oklahoma is 18.1%.
What is the Average Housing Costs as Percentage of Income in the United States?
Average Housing Costs as Percentage of Income in the United States is 20.4%.