Cities with the Lowest Costs of Housing as Percentage of Income in Pennsylvania
RELATED REPORTS & OPTIONS
Lowest Housing Costs / Income
Pennsylvania
Compare Cities
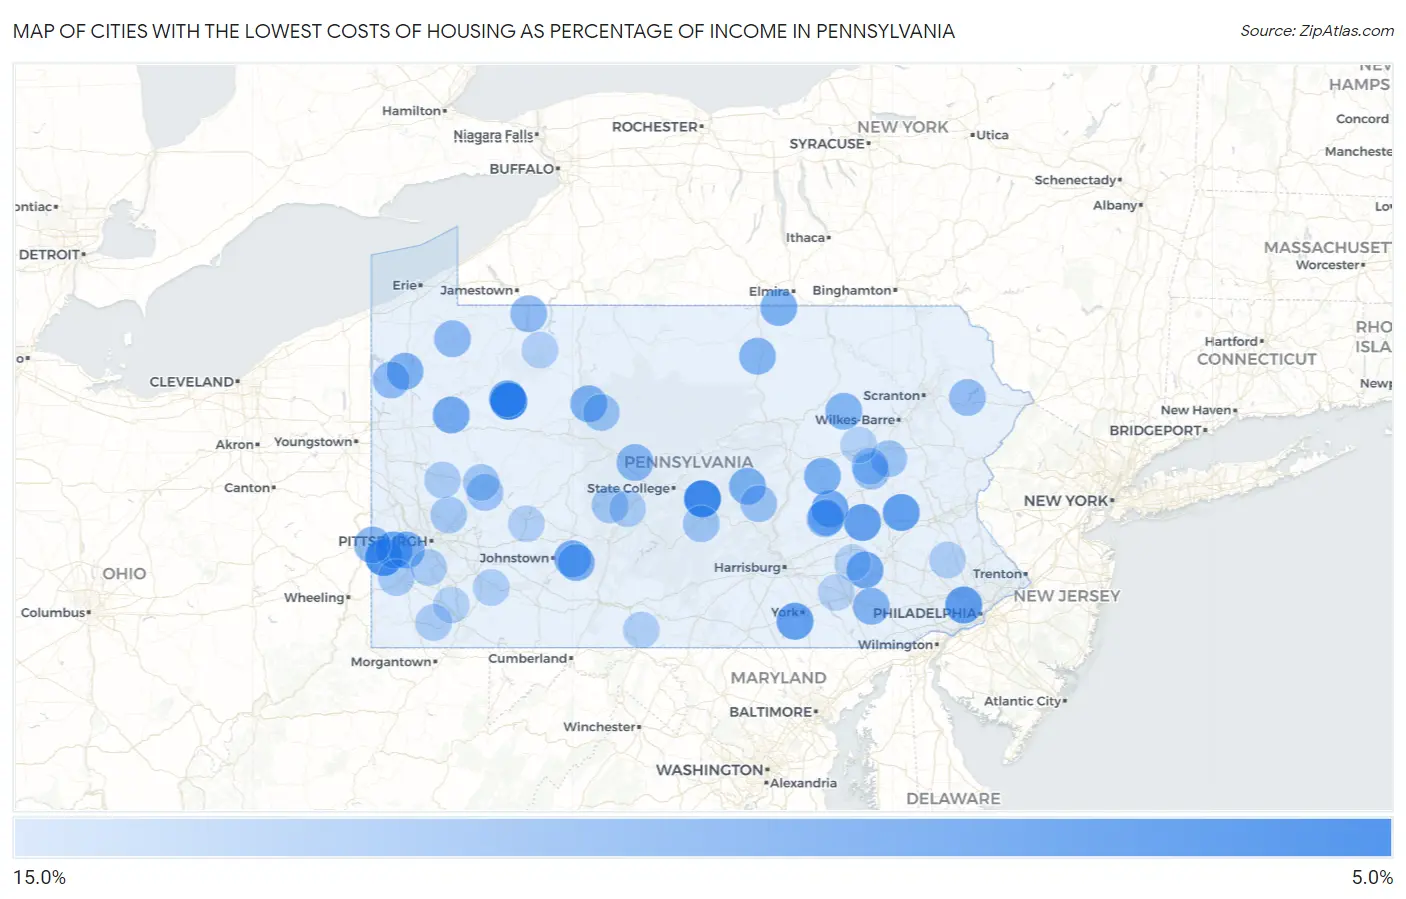
Map of Cities with the Lowest Costs of Housing as Percentage of Income in Pennsylvania
15.0%
0.0%
Cities with the Lowest Costs of Housing as Percentage of Income in Pennsylvania
| City | Housing Costs / Income | vs State | vs National | |
| 1. | Leeper | 5.9% | 18.6%(-12.7)#1 | 20.4%(-14.5)#153 |
| 2. | Potlicker Flats | 6.2% | 18.6%(-12.4)#2 | 20.4%(-14.2)#197 |
| 3. | Cross Creek | 6.9% | 18.6%(-11.7)#3 | 20.4%(-13.5)#311 |
| 4. | Royer | 7.2% | 18.6%(-11.4)#4 | 20.4%(-13.1)#382 |
| 5. | Brooks Mill | 7.6% | 18.6%(-11.0)#5 | 20.4%(-12.8)#452 |
| 6. | Haverford College | 7.7% | 18.6%(-11.0)#6 | 20.4%(-12.7)#477 |
| 7. | Blue Knob | 7.7% | 18.6%(-11.0)#7 | 20.4%(-12.7)#483 |
| 8. | Birmingham Borough | 7.7% | 18.6%(-10.9)#8 | 20.4%(-12.7)#490 |
| 9. | Kempton | 7.8% | 18.6%(-10.9)#9 | 20.4%(-12.6)#510 |
| 10. | Sickles Corner | 7.8% | 18.6%(-10.8)#10 | 20.4%(-12.6)#511 |
| 11. | New Salem | 7.9% | 18.6%(-10.8)#11 | 20.4%(-12.5)#540 |
| 12. | Summit Station | 8.0% | 18.6%(-10.7)#12 | 20.4%(-12.4)#559 |
| 13. | Holters Crossing | 8.0% | 18.6%(-10.6)#13 | 20.4%(-12.4)#574 |
| 14. | Bulger | 8.2% | 18.6%(-10.5)#14 | 20.4%(-12.2)#613 |
| 15. | Morea | 8.2% | 18.6%(-10.4)#15 | 20.4%(-12.1)#631 |
| 16. | Worthville Borough | 8.3% | 18.6%(-10.3)#16 | 20.4%(-12.0)#665 |
| 17. | Schoeneck | 8.4% | 18.6%(-10.2)#17 | 20.4%(-12.0)#694 |
| 18. | Hegins | 8.5% | 18.6%(-10.2)#18 | 20.4%(-11.9)#710 |
| 19. | Turbotville Borough | 8.6% | 18.6%(-10.0)#19 | 20.4%(-11.8)#759 |
| 20. | Sidman | 8.6% | 18.6%(-10.0)#20 | 20.4%(-11.8)#762 |
| 21. | Kennerdell | 8.6% | 18.6%(-10.0)#21 | 20.4%(-11.8)#764 |
| 22. | Chest Springs Borough | 8.8% | 18.6%(-9.88)#22 | 20.4%(-11.6)#802 |
| 23. | Glasgow Borough | 8.8% | 18.6%(-9.83)#23 | 20.4%(-11.6)#821 |
| 24. | Tylersburg | 8.9% | 18.6%(-9.73)#24 | 20.4%(-11.5)#849 |
| 25. | Millerton | 9.0% | 18.6%(-9.67)#25 | 20.4%(-11.4)#878 |
| 26. | Elysburg | 9.0% | 18.6%(-9.66)#26 | 20.4%(-11.4)#884 |
| 27. | Kersey | 9.0% | 18.6%(-9.65)#27 | 20.4%(-11.4)#886 |
| 28. | Sturgeon | 9.0% | 18.6%(-9.62)#28 | 20.4%(-11.4)#899 |
| 29. | Troxelville | 9.0% | 18.6%(-9.60)#29 | 20.4%(-11.3)#906 |
| 30. | Geneva | 9.1% | 18.6%(-9.53)#30 | 20.4%(-11.3)#936 |
| 31. | Dunlo | 9.1% | 18.6%(-9.53)#31 | 20.4%(-11.3)#940 |
| 32. | Paradise | 9.2% | 18.6%(-9.39)#32 | 20.4%(-11.1)#992 |
| 33. | New Baltimore Borough | 9.3% | 18.6%(-9.35)#33 | 20.4%(-11.1)#1,015 |
| 34. | Mckee | 9.3% | 18.6%(-9.33)#34 | 20.4%(-11.1)#1,025 |
| 35. | Arnot | 9.4% | 18.6%(-9.24)#35 | 20.4%(-11.0)#1,076 |
| 36. | Jamison City | 9.4% | 18.6%(-9.23)#36 | 20.4%(-11.0)#1,079 |
| 37. | Juniata Gap | 9.4% | 18.6%(-9.19)#37 | 20.4%(-10.9)#1,105 |
| 38. | Paris | 9.4% | 18.6%(-9.18)#38 | 20.4%(-10.9)#1,111 |
| 39. | Allport | 9.5% | 18.6%(-9.16)#39 | 20.4%(-10.9)#1,124 |
| 40. | Claysville Borough | 9.5% | 18.6%(-9.10)#40 | 20.4%(-10.8)#1,151 |
| 41. | Orwin | 9.5% | 18.6%(-9.09)#41 | 20.4%(-10.8)#1,157 |
| 42. | Rices Landing Borough | 9.7% | 18.6%(-8.91)#42 | 20.4%(-10.7)#1,251 |
| 43. | Riceville | 9.8% | 18.6%(-8.88)#43 | 20.4%(-10.6)#1,265 |
| 44. | Arona Borough | 9.8% | 18.6%(-8.85)#44 | 20.4%(-10.6)#1,276 |
| 45. | Russell | 9.8% | 18.6%(-8.85)#45 | 20.4%(-10.6)#1,281 |
| 46. | Daisytown Borough | 9.8% | 18.6%(-8.83)#46 | 20.4%(-10.6)#1,299 |
| 47. | Atlantic | 9.8% | 18.6%(-8.79)#47 | 20.4%(-10.5)#1,327 |
| 48. | Wallenpaupack Lake Estates | 10.1% | 18.6%(-8.56)#48 | 20.4%(-10.3)#1,453 |
| 49. | Shelltown | 10.1% | 18.6%(-8.49)#49 | 20.4%(-10.2)#1,493 |
| 50. | Gilberton Borough | 10.1% | 18.6%(-8.49)#50 | 20.4%(-10.2)#1,494 |
| 51. | Muir | 10.2% | 18.6%(-8.45)#51 | 20.4%(-10.2)#1,516 |
| 52. | New Boston | 10.2% | 18.6%(-8.41)#52 | 20.4%(-10.2)#1,538 |
| 53. | Byrnedale | 10.3% | 18.6%(-8.34)#53 | 20.4%(-10.1)#1,577 |
| 54. | Glen Hope Borough | 10.3% | 18.6%(-8.33)#54 | 20.4%(-10.1)#1,581 |
| 55. | Oneida | 10.3% | 18.6%(-8.29)#55 | 20.4%(-10.0)#1,604 |
| 56. | Richfield | 10.4% | 18.6%(-8.27)#56 | 20.4%(-10.0)#1,620 |
| 57. | Harleigh | 10.4% | 18.6%(-8.20)#57 | 20.4%(-9.95)#1,667 |
| 58. | Venango Borough | 10.4% | 18.6%(-8.20)#58 | 20.4%(-9.94)#1,671 |
| 59. | Lenape Heights | 10.5% | 18.6%(-8.18)#59 | 20.4%(-9.92)#1,694 |
| 60. | Granville | 10.5% | 18.6%(-8.15)#60 | 20.4%(-9.89)#1,713 |
| 61. | Oswayo Borough | 10.5% | 18.6%(-8.14)#61 | 20.4%(-9.88)#1,722 |
| 62. | Weston | 10.5% | 18.6%(-8.13)#62 | 20.4%(-9.87)#1,729 |
| 63. | Skelp | 10.5% | 18.6%(-8.11)#63 | 20.4%(-9.86)#1,735 |
| 64. | Casanova | 10.5% | 18.6%(-8.11)#64 | 20.4%(-9.86)#1,737 |
| 65. | Shellytown | 10.6% | 18.6%(-8.05)#65 | 20.4%(-9.79)#1,792 |
| 66. | Utica Borough | 10.7% | 18.6%(-7.97)#66 | 20.4%(-9.71)#1,849 |
| 67. | Blandburg | 10.7% | 18.6%(-7.96)#67 | 20.4%(-9.70)#1,854 |
| 68. | New Morgan Borough | 10.7% | 18.6%(-7.94)#68 | 20.4%(-9.68)#1,865 |
| 69. | West Hills | 10.7% | 18.6%(-7.91)#69 | 20.4%(-9.66)#1,881 |
| 70. | Timblin Borough | 10.7% | 18.6%(-7.90)#70 | 20.4%(-9.65)#1,888 |
| 71. | Russellton | 10.8% | 18.6%(-7.88)#71 | 20.4%(-9.62)#1,911 |
| 72. | Sutersville Borough | 10.8% | 18.6%(-7.86)#72 | 20.4%(-9.61)#1,922 |
| 73. | Ashville Borough | 10.8% | 18.6%(-7.82)#73 | 20.4%(-9.56)#1,949 |
| 74. | Haysville Borough | 10.8% | 18.6%(-7.80)#74 | 20.4%(-9.55)#1,960 |
| 75. | Wolfdale | 10.9% | 18.6%(-7.76)#75 | 20.4%(-9.50)#1,998 |
| 76. | Marianna Borough | 11.0% | 18.6%(-7.66)#76 | 20.4%(-9.40)#2,073 |
| 77. | Meadowood | 11.0% | 18.6%(-7.59)#77 | 20.4%(-9.34)#2,124 |
| 78. | Grazierville | 11.1% | 18.6%(-7.58)#78 | 20.4%(-9.32)#2,132 |
| 79. | Gastonville | 11.1% | 18.6%(-7.54)#79 | 20.4%(-9.28)#2,167 |
| 80. | Fairdale | 11.1% | 18.6%(-7.54)#80 | 20.4%(-9.28)#2,168 |
| 81. | Woxall | 11.2% | 18.6%(-7.42)#81 | 20.4%(-9.17)#2,254 |
| 82. | Stillwater Borough | 11.2% | 18.6%(-7.40)#82 | 20.4%(-9.15)#2,269 |
| 83. | Bear Rocks | 11.2% | 18.6%(-7.40)#83 | 20.4%(-9.15)#2,271 |
| 84. | Polk Borough | 11.2% | 18.6%(-7.39)#84 | 20.4%(-9.14)#2,280 |
| 85. | Needmore | 11.3% | 18.6%(-7.38)#85 | 20.4%(-9.12)#2,289 |
| 86. | Prompton Borough | 11.3% | 18.6%(-7.37)#86 | 20.4%(-9.12)#2,294 |
| 87. | Addison Borough | 11.3% | 18.6%(-7.35)#87 | 20.4%(-9.10)#2,319 |
| 88. | Lucerne Mines | 11.4% | 18.6%(-7.26)#88 | 20.4%(-9.01)#2,391 |
| 89. | Sheffield | 11.4% | 18.6%(-7.24)#89 | 20.4%(-8.98)#2,414 |
| 90. | Casselman Borough | 11.4% | 18.6%(-7.23)#90 | 20.4%(-8.98)#2,421 |
| 91. | Schaefferstown | 11.4% | 18.6%(-7.21)#91 | 20.4%(-8.96)#2,437 |
| 92. | Rowes Run | 11.4% | 18.6%(-7.21)#92 | 20.4%(-8.95)#2,447 |
| 93. | Jackson Center Borough | 11.4% | 18.6%(-7.20)#93 | 20.4%(-8.95)#2,450 |
| 94. | Foundryville | 11.4% | 18.6%(-7.18)#94 | 20.4%(-8.93)#2,463 |
| 95. | Robeson Extension | 11.5% | 18.6%(-7.17)#95 | 20.4%(-8.92)#2,471 |
| 96. | Cassandra Borough | 11.5% | 18.6%(-7.13)#96 | 20.4%(-8.88)#2,512 |
| 97. | Salunga | 11.5% | 18.6%(-7.12)#97 | 20.4%(-8.86)#2,526 |
| 98. | Fredonia Borough | 11.5% | 18.6%(-7.11)#98 | 20.4%(-8.86)#2,529 |
| 99. | Vandling Borough | 11.5% | 18.6%(-7.11)#99 | 20.4%(-8.86)#2,531 |
| 100. | Troutville Borough | 11.5% | 18.6%(-7.09)#100 | 20.4%(-8.84)#2,546 |
Common Questions
What are the Top 10 Cities with the Lowest Costs of Housing as Percentage of Income in Pennsylvania?
Top 10 Cities with the Lowest Costs of Housing as Percentage of Income in Pennsylvania are:
#1
5.9%
#2
6.2%
#3
6.9%
#4
7.7%
#5
7.8%
#6
7.9%
#7
8.0%
#8
8.2%
#9
8.4%
#10
8.5%
What city has the Lowest Costs of Housing as Percentage of Income in Pennsylvania?
Leeper has the Lowest Costs of Housing as Percentage of Income in Pennsylvania with 5.9%.
What is the Average Housing Costs as Percentage of Income in the State of Pennsylvania?
Average Housing Costs as Percentage of Income in Pennsylvania is 18.6%.
What is the Average Housing Costs as Percentage of Income in the United States?
Average Housing Costs as Percentage of Income in the United States is 20.4%.