Cities with the Lowest Costs of Housing as Percentage of Income in Illinois
RELATED REPORTS & OPTIONS
Lowest Housing Costs / Income
Illinois
Compare Cities
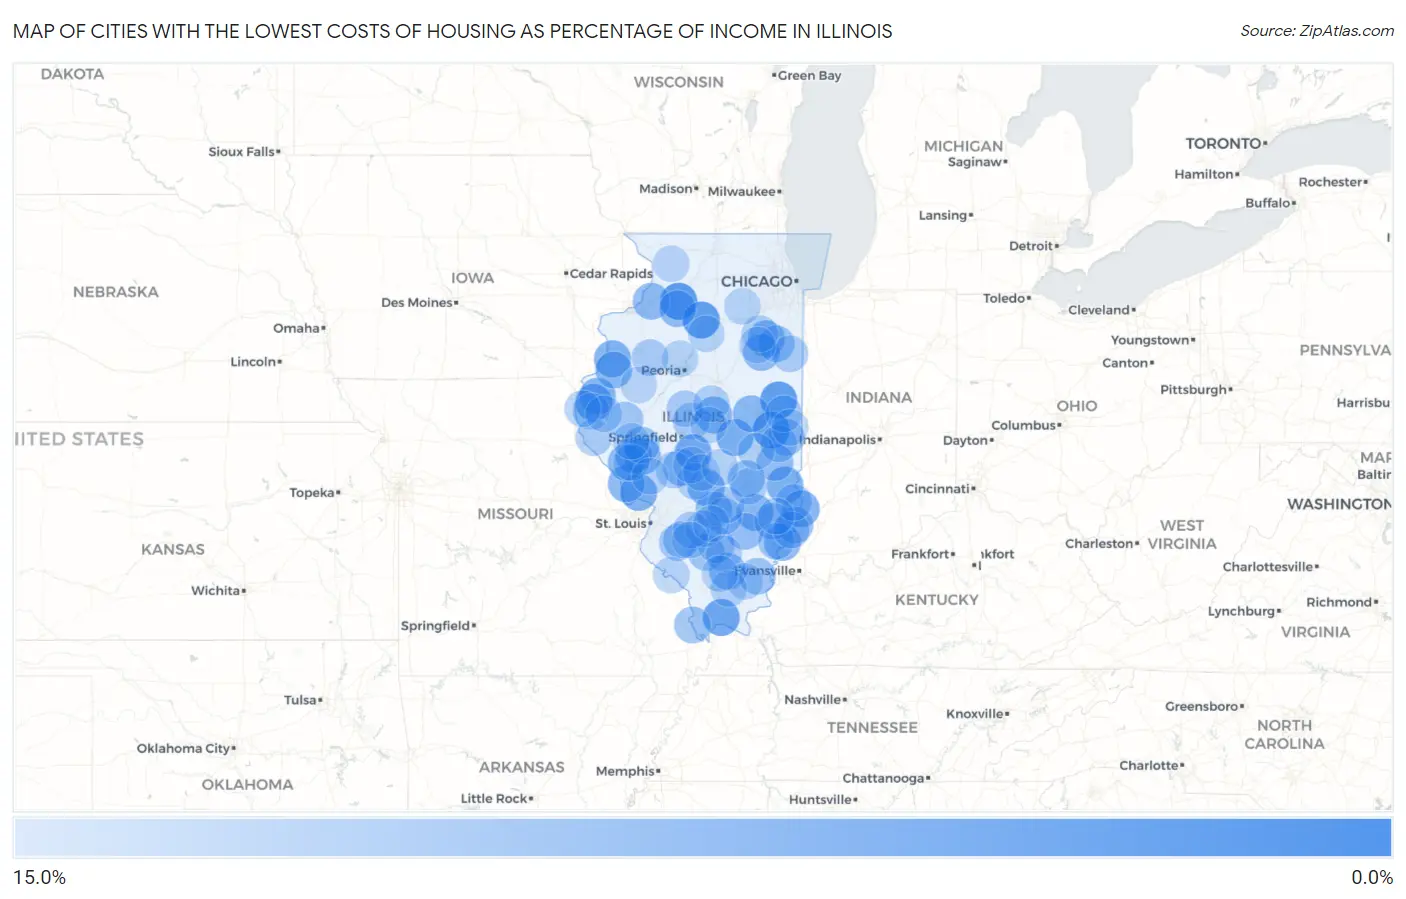
Map of Cities with the Lowest Costs of Housing as Percentage of Income in Illinois
15.0%
0.0%
Cities with the Lowest Costs of Housing as Percentage of Income in Illinois
| City | Housing Costs / Income | vs State | vs National | |
| 1. | Dundas | 3.3% | 19.6%(-16.3)#1 | 20.4%(-17.0)#19 |
| 2. | Deer Grove | 5.8% | 19.6%(-13.8)#2 | 20.4%(-14.6)#144 |
| 3. | Penfield | 6.0% | 19.6%(-13.7)#3 | 20.4%(-14.4)#163 |
| 4. | Hollowayville | 6.0% | 19.6%(-13.7)#4 | 20.4%(-14.4)#164 |
| 5. | Longview | 6.3% | 19.6%(-13.4)#5 | 20.4%(-14.1)#209 |
| 6. | Belknap | 6.8% | 19.6%(-12.9)#6 | 20.4%(-13.6)#286 |
| 7. | West Point | 7.5% | 19.6%(-12.1)#7 | 20.4%(-12.8)#446 |
| 8. | Otterville | 7.6% | 19.6%(-12.1)#8 | 20.4%(-12.8)#451 |
| 9. | Laplace | 7.6% | 19.6%(-12.1)#9 | 20.4%(-12.8)#456 |
| 10. | Annapolis | 7.7% | 19.6%(-11.9)#10 | 20.4%(-12.6)#498 |
| 11. | Russellville | 7.9% | 19.6%(-11.8)#11 | 20.4%(-12.5)#534 |
| 12. | Biggsville | 7.9% | 19.6%(-11.8)#12 | 20.4%(-12.5)#542 |
| 13. | Bingham | 8.0% | 19.6%(-11.6)#13 | 20.4%(-12.4)#572 |
| 14. | Hardin | 8.3% | 19.6%(-11.3)#14 | 20.4%(-12.1)#660 |
| 15. | Kenney | 8.4% | 19.6%(-11.3)#15 | 20.4%(-12.0)#671 |
| 16. | Keensburg | 8.4% | 19.6%(-11.3)#16 | 20.4%(-12.0)#681 |
| 17. | Manchester | 8.4% | 19.6%(-11.2)#17 | 20.4%(-12.0)#693 |
| 18. | Bentley | 8.4% | 19.6%(-11.2)#18 | 20.4%(-11.9)#699 |
| 19. | Custer Park | 8.5% | 19.6%(-11.2)#19 | 20.4%(-11.9)#708 |
| 20. | Sailor Springs | 8.5% | 19.6%(-11.1)#20 | 20.4%(-11.9)#733 |
| 21. | Glasgow | 8.5% | 19.6%(-11.1)#21 | 20.4%(-11.9)#735 |
| 22. | Raritan | 8.5% | 19.6%(-11.1)#22 | 20.4%(-11.8)#743 |
| 23. | Seymour | 8.6% | 19.6%(-11.0)#23 | 20.4%(-11.8)#770 |
| 24. | Union Hill | 8.7% | 19.6%(-10.9)#24 | 20.4%(-11.7)#785 |
| 25. | Hanaford | 8.8% | 19.6%(-10.8)#25 | 20.4%(-11.5)#831 |
| 26. | Hillsdale | 8.8% | 19.6%(-10.8)#26 | 20.4%(-11.5)#833 |
| 27. | Kempton | 8.9% | 19.6%(-10.8)#27 | 20.4%(-11.5)#842 |
| 28. | Galt | 8.9% | 19.6%(-10.7)#28 | 20.4%(-11.5)#855 |
| 29. | New Bedford | 9.0% | 19.6%(-10.7)#29 | 20.4%(-11.4)#876 |
| 30. | Alvan | 9.0% | 19.6%(-10.6)#30 | 20.4%(-11.3)#908 |
| 31. | Sigel | 9.1% | 19.6%(-10.6)#31 | 20.4%(-11.3)#921 |
| 32. | Pearl | 9.2% | 19.6%(-10.5)#32 | 20.4%(-11.2)#971 |
| 33. | Johnsonville | 9.3% | 19.6%(-10.4)#33 | 20.4%(-11.1)#1,009 |
| 34. | Westfield | 9.3% | 19.6%(-10.4)#34 | 20.4%(-11.1)#1,016 |
| 35. | Waggoner | 9.4% | 19.6%(-10.3)#35 | 20.4%(-11.0)#1,054 |
| 36. | Vernon | 9.4% | 19.6%(-10.2)#36 | 20.4%(-10.9)#1,101 |
| 37. | St Francisville | 9.5% | 19.6%(-10.2)#37 | 20.4%(-10.9)#1,119 |
| 38. | Tovey | 9.6% | 19.6%(-10.1)#38 | 20.4%(-10.8)#1,175 |
| 39. | Thebes | 9.7% | 19.6%(-9.98)#39 | 20.4%(-10.7)#1,218 |
| 40. | Calhoun | 9.7% | 19.6%(-9.97)#40 | 20.4%(-10.7)#1,225 |
| 41. | Lynnville | 9.7% | 19.6%(-9.93)#41 | 20.4%(-10.7)#1,248 |
| 42. | Irwin | 9.8% | 19.6%(-9.88)#42 | 20.4%(-10.6)#1,267 |
| 43. | Metcalf | 9.8% | 19.6%(-9.87)#43 | 20.4%(-10.6)#1,272 |
| 44. | Brocton | 9.9% | 19.6%(-9.73)#44 | 20.4%(-10.5)#1,360 |
| 45. | Du Bois | 9.9% | 19.6%(-9.73)#45 | 20.4%(-10.5)#1,365 |
| 46. | Smithville | 10.0% | 19.6%(-9.68)#46 | 20.4%(-10.4)#1,393 |
| 47. | Omaha | 10.0% | 19.6%(-9.66)#47 | 20.4%(-10.4)#1,401 |
| 48. | Westlake | 10.0% | 19.6%(-9.62)#48 | 20.4%(-10.3)#1,428 |
| 49. | Browns | 10.1% | 19.6%(-9.59)#49 | 20.4%(-10.3)#1,439 |
| 50. | Allendale | 10.1% | 19.6%(-9.54)#50 | 20.4%(-10.3)#1,470 |
| 51. | St Libory | 10.1% | 19.6%(-9.54)#51 | 20.4%(-10.3)#1,472 |
| 52. | Venedy | 10.1% | 19.6%(-9.53)#52 | 20.4%(-10.3)#1,477 |
| 53. | Ripley | 10.3% | 19.6%(-9.39)#53 | 20.4%(-10.1)#1,557 |
| 54. | Woodlawn | 10.3% | 19.6%(-9.38)#54 | 20.4%(-10.1)#1,568 |
| 55. | Elkhart | 10.3% | 19.6%(-9.31)#55 | 20.4%(-10.0)#1,599 |
| 56. | Muncie | 10.4% | 19.6%(-9.26)#56 | 20.4%(-9.99)#1,642 |
| 57. | Alma | 10.4% | 19.6%(-9.22)#57 | 20.4%(-9.96)#1,663 |
| 58. | Flat Rock | 10.4% | 19.6%(-9.20)#58 | 20.4%(-9.93)#1,686 |
| 59. | New Holland | 10.6% | 19.6%(-9.07)#59 | 20.4%(-9.80)#1,782 |
| 60. | St Peter | 10.6% | 19.6%(-9.06)#60 | 20.4%(-9.79)#1,785 |
| 61. | Hoffman | 10.6% | 19.6%(-9.05)#61 | 20.4%(-9.78)#1,800 |
| 62. | Gilson | 10.6% | 19.6%(-9.02)#62 | 20.4%(-9.75)#1,818 |
| 63. | Bartelso | 10.6% | 19.6%(-9.00)#63 | 20.4%(-9.73)#1,834 |
| 64. | Plum Valley | 10.7% | 19.6%(-8.98)#64 | 20.4%(-9.71)#1,850 |
| 65. | Standard City | 10.7% | 19.6%(-8.95)#65 | 20.4%(-9.68)#1,861 |
| 66. | Loraine | 10.7% | 19.6%(-8.94)#66 | 20.4%(-9.67)#1,874 |
| 67. | Literberry | 10.7% | 19.6%(-8.93)#67 | 20.4%(-9.66)#1,877 |
| 68. | Sandoval | 10.7% | 19.6%(-8.90)#68 | 20.4%(-9.63)#1,899 |
| 69. | Plainville | 10.8% | 19.6%(-8.84)#69 | 20.4%(-9.57)#1,942 |
| 70. | Martinton | 10.8% | 19.6%(-8.83)#70 | 20.4%(-9.56)#1,948 |
| 71. | East Brooklyn | 10.9% | 19.6%(-8.79)#71 | 20.4%(-9.52)#1,982 |
| 72. | Claremont | 10.9% | 19.6%(-8.73)#72 | 20.4%(-9.46)#2,027 |
| 73. | Kincaid | 10.9% | 19.6%(-8.72)#73 | 20.4%(-9.45)#2,037 |
| 74. | Golden | 10.9% | 19.6%(-8.71)#74 | 20.4%(-9.44)#2,042 |
| 75. | Irving | 10.9% | 19.6%(-8.70)#75 | 20.4%(-9.43)#2,046 |
| 76. | Teutopolis | 11.0% | 19.6%(-8.67)#76 | 20.4%(-9.41)#2,071 |
| 77. | Waynesville | 11.0% | 19.6%(-8.67)#77 | 20.4%(-9.40)#2,079 |
| 78. | Lima | 11.0% | 19.6%(-8.65)#78 | 20.4%(-9.38)#2,095 |
| 79. | Bonnie | 11.1% | 19.6%(-8.59)#79 | 20.4%(-9.32)#2,131 |
| 80. | Raleigh | 11.1% | 19.6%(-8.55)#80 | 20.4%(-9.28)#2,166 |
| 81. | Campus | 11.1% | 19.6%(-8.52)#81 | 20.4%(-9.26)#2,182 |
| 82. | Crab Orchard | 11.1% | 19.6%(-8.51)#82 | 20.4%(-9.24)#2,197 |
| 83. | Morrisonville | 11.2% | 19.6%(-8.48)#83 | 20.4%(-9.21)#2,214 |
| 84. | Wenonah | 11.2% | 19.6%(-8.47)#84 | 20.4%(-9.20)#2,226 |
| 85. | Newark | 11.2% | 19.6%(-8.41)#85 | 20.4%(-9.14)#2,274 |
| 86. | Humboldt | 11.2% | 19.6%(-8.41)#86 | 20.4%(-9.14)#2,275 |
| 87. | Dunlap | 11.3% | 19.6%(-8.37)#87 | 20.4%(-9.10)#2,311 |
| 88. | Alexander | 11.3% | 19.6%(-8.37)#88 | 20.4%(-9.10)#2,313 |
| 89. | Tower Hill | 11.3% | 19.6%(-8.37)#89 | 20.4%(-9.10)#2,316 |
| 90. | Mcnabb | 11.3% | 19.6%(-8.35)#90 | 20.4%(-9.08)#2,328 |
| 91. | Hillview | 11.3% | 19.6%(-8.33)#91 | 20.4%(-9.06)#2,341 |
| 92. | Bluffs | 11.3% | 19.6%(-8.32)#92 | 20.4%(-9.05)#2,350 |
| 93. | Chester | 11.3% | 19.6%(-8.31)#93 | 20.4%(-9.04)#2,359 |
| 94. | Orient | 11.4% | 19.6%(-8.29)#94 | 20.4%(-9.02)#2,382 |
| 95. | Addieville | 11.4% | 19.6%(-8.28)#95 | 20.4%(-9.01)#2,395 |
| 96. | Indianola | 11.4% | 19.6%(-8.27)#96 | 20.4%(-9.00)#2,398 |
| 97. | Lanark | 11.4% | 19.6%(-8.24)#97 | 20.4%(-8.97)#2,426 |
| 98. | Marietta | 11.4% | 19.6%(-8.24)#98 | 20.4%(-8.97)#2,429 |
| 99. | Rockbridge | 11.4% | 19.6%(-8.22)#99 | 20.4%(-8.95)#2,441 |
| 100. | Latham | 11.4% | 19.6%(-8.22)#100 | 20.4%(-8.95)#2,444 |
Common Questions
What are the Top 10 Cities with the Lowest Costs of Housing as Percentage of Income in Illinois?
Top 10 Cities with the Lowest Costs of Housing as Percentage of Income in Illinois are:
#1
5.8%
#2
6.0%
#3
6.0%
#4
6.3%
#5
6.8%
#6
7.5%
#7
7.6%
#8
7.6%
#9
7.7%
#10
7.9%
What city has the Lowest Costs of Housing as Percentage of Income in Illinois?
Deer Grove has the Lowest Costs of Housing as Percentage of Income in Illinois with 5.8%.
What is the Average Housing Costs as Percentage of Income in the State of Illinois?
Average Housing Costs as Percentage of Income in Illinois is 19.6%.
What is the Average Housing Costs as Percentage of Income in the United States?
Average Housing Costs as Percentage of Income in the United States is 20.4%.