Cities with the Lowest Costs of Housing as Percentage of Income in Iowa
RELATED REPORTS & OPTIONS
Lowest Housing Costs / Income
Iowa
Compare Cities
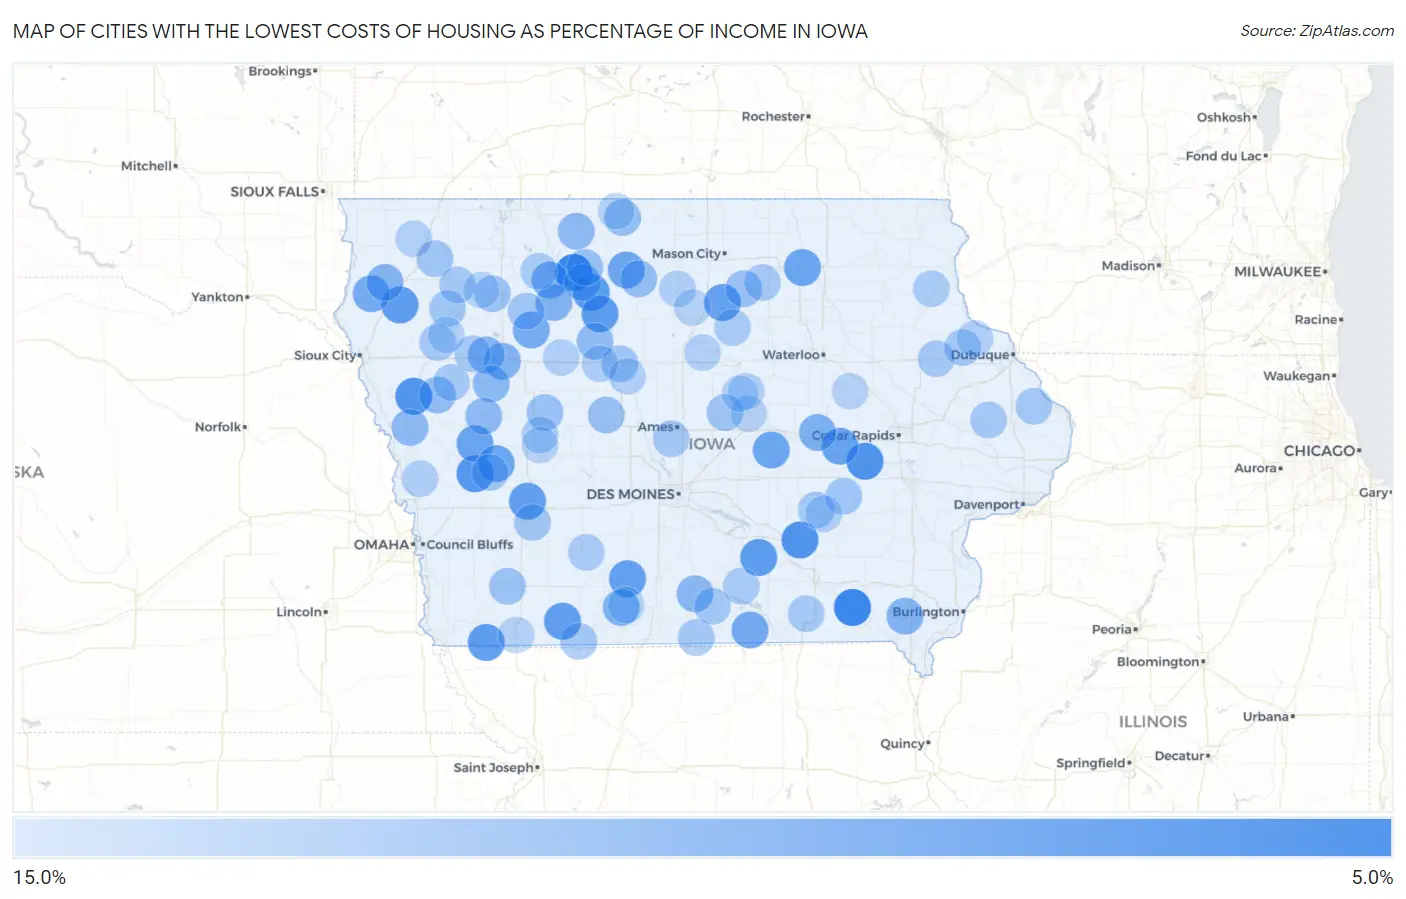
Map of Cities with the Lowest Costs of Housing as Percentage of Income in Iowa
15.0%
0.0%
Cities with the Lowest Costs of Housing as Percentage of Income in Iowa
| City | Housing Costs / Income | vs State | vs National | |
| 1. | Rodman | 5.4% | 16.7%(-11.3)#1 | 20.4%(-15.0)#103 |
| 2. | Douds | 5.5% | 16.7%(-11.2)#2 | 20.4%(-14.9)#114 |
| 3. | Keomah Village | 6.4% | 16.7%(-10.3)#3 | 20.4%(-14.0)#224 |
| 4. | West Amana | 6.4% | 16.7%(-10.3)#4 | 20.4%(-14.0)#228 |
| 5. | Smithland | 6.5% | 16.7%(-10.2)#5 | 20.4%(-13.9)#245 |
| 6. | Westphalia | 6.7% | 16.7%(-10.0)#6 | 20.4%(-13.7)#276 |
| 7. | Ottosen | 6.9% | 16.7%(-9.80)#7 | 20.4%(-13.5)#319 |
| 8. | Northboro | 7.1% | 16.7%(-9.62)#8 | 20.4%(-13.3)#354 |
| 9. | Hamilton | 7.1% | 16.7%(-9.61)#9 | 20.4%(-13.3)#359 |
| 10. | Oyens | 7.1% | 16.7%(-9.60)#10 | 20.4%(-13.3)#362 |
| 11. | Rutland | 7.1% | 16.7%(-9.59)#11 | 20.4%(-13.3)#364 |
| 12. | Conway | 7.2% | 16.7%(-9.47)#12 | 20.4%(-13.1)#386 |
| 13. | Brayton | 7.3% | 16.7%(-9.39)#13 | 20.4%(-13.1)#399 |
| 14. | Chapin | 7.4% | 16.7%(-9.36)#14 | 20.4%(-13.0)#404 |
| 15. | Thayer | 7.4% | 16.7%(-9.30)#15 | 20.4%(-13.0)#415 |
| 16. | Luzerne | 7.6% | 16.7%(-9.12)#16 | 20.4%(-12.8)#462 |
| 17. | Buck Grove | 7.7% | 16.7%(-9.04)#17 | 20.4%(-12.7)#484 |
| 18. | Gilman | 7.8% | 16.7%(-8.96)#18 | 20.4%(-12.6)#503 |
| 19. | Irwin | 7.8% | 16.7%(-8.89)#19 | 20.4%(-12.5)#524 |
| 20. | Bassett | 7.8% | 16.7%(-8.89)#20 | 20.4%(-12.5)#525 |
| 21. | St Benedict | 7.9% | 16.7%(-8.83)#21 | 20.4%(-12.5)#545 |
| 22. | Downey | 7.9% | 16.7%(-8.81)#22 | 20.4%(-12.5)#550 |
| 23. | Lowell | 8.0% | 16.7%(-8.74)#23 | 20.4%(-12.4)#564 |
| 24. | Numa | 8.0% | 16.7%(-8.68)#24 | 20.4%(-12.3)#580 |
| 25. | Craig | 8.2% | 16.7%(-8.53)#25 | 20.4%(-12.2)#618 |
| 26. | Varina | 8.2% | 16.7%(-8.49)#26 | 20.4%(-12.1)#627 |
| 27. | Curlew | 8.4% | 16.7%(-8.32)#27 | 20.4%(-12.0)#685 |
| 28. | Ellston | 8.5% | 16.7%(-8.20)#28 | 20.4%(-11.9)#734 |
| 29. | Vining | 8.6% | 16.7%(-8.07)#29 | 20.4%(-11.7)#776 |
| 30. | Early | 8.8% | 16.7%(-7.91)#30 | 20.4%(-11.6)#819 |
| 31. | Houghton | 8.8% | 16.7%(-7.91)#31 | 20.4%(-11.6)#822 |
| 32. | Havelock | 8.8% | 16.7%(-7.87)#32 | 20.4%(-11.5)#836 |
| 33. | Maurice | 8.9% | 16.7%(-7.78)#33 | 20.4%(-11.4)#866 |
| 34. | Schaller | 9.0% | 16.7%(-7.71)#34 | 20.4%(-11.4)#896 |
| 35. | West Bend | 9.0% | 16.7%(-7.69)#35 | 20.4%(-11.4)#903 |
| 36. | Derby | 9.1% | 16.7%(-7.61)#36 | 20.4%(-11.3)#939 |
| 37. | Odebolt | 9.2% | 16.7%(-7.52)#37 | 20.4%(-11.2)#974 |
| 38. | Turin | 9.3% | 16.7%(-7.45)#38 | 20.4%(-11.1)#1,005 |
| 39. | Deloit | 9.3% | 16.7%(-7.40)#39 | 20.4%(-11.1)#1,034 |
| 40. | Ringsted | 9.4% | 16.7%(-7.29)#40 | 20.4%(-10.9)#1,100 |
| 41. | Clare | 9.5% | 16.7%(-7.20)#41 | 20.4%(-10.9)#1,143 |
| 42. | Corwith | 9.6% | 16.7%(-7.14)#42 | 20.4%(-10.8)#1,170 |
| 43. | Danbury | 9.6% | 16.7%(-7.12)#43 | 20.4%(-10.8)#1,181 |
| 44. | Lakota | 9.7% | 16.7%(-7.03)#44 | 20.4%(-10.7)#1,228 |
| 45. | Dougherty | 9.8% | 16.7%(-6.90)#45 | 20.4%(-10.6)#1,307 |
| 46. | Dana | 9.8% | 16.7%(-6.90)#46 | 20.4%(-10.6)#1,312 |
| 47. | Whittemore | 9.9% | 16.7%(-6.81)#47 | 20.4%(-10.5)#1,358 |
| 48. | Lidderdale | 9.9% | 16.7%(-6.80)#48 | 20.4%(-10.5)#1,362 |
| 49. | Stanton | 9.9% | 16.7%(-6.77)#49 | 20.4%(-10.4)#1,383 |
| 50. | St Anthony | 10.1% | 16.7%(-6.66)#50 | 20.4%(-10.3)#1,440 |
| 51. | Linn Grove | 10.1% | 16.7%(-6.64)#51 | 20.4%(-10.3)#1,456 |
| 52. | Coalville | 10.1% | 16.7%(-6.58)#52 | 20.4%(-10.2)#1,487 |
| 53. | Millersburg | 10.1% | 16.7%(-6.57)#53 | 20.4%(-10.2)#1,491 |
| 54. | Albert City | 10.2% | 16.7%(-6.53)#54 | 20.4%(-10.2)#1,513 |
| 55. | Archer | 10.2% | 16.7%(-6.51)#55 | 20.4%(-10.2)#1,530 |
| 56. | Kirkman | 10.2% | 16.7%(-6.49)#56 | 20.4%(-10.2)#1,537 |
| 57. | Wiota | 10.3% | 16.7%(-6.46)#57 | 20.4%(-10.1)#1,555 |
| 58. | Meriden | 10.3% | 16.7%(-6.43)#58 | 20.4%(-10.1)#1,576 |
| 59. | Blockton | 10.3% | 16.7%(-6.39)#59 | 20.4%(-10.1)#1,594 |
| 60. | Springbrook | 10.3% | 16.7%(-6.38)#60 | 20.4%(-10.0)#1,600 |
| 61. | Clio | 10.3% | 16.7%(-6.38)#61 | 20.4%(-10.0)#1,607 |
| 62. | Kelley | 10.3% | 16.7%(-6.37)#62 | 20.4%(-10.0)#1,610 |
| 63. | Delaware | 10.4% | 16.7%(-6.34)#63 | 20.4%(-10.0)#1,633 |
| 64. | Millerton | 10.4% | 16.7%(-6.33)#64 | 20.4%(-9.99)#1,644 |
| 65. | Battle Creek | 10.4% | 16.7%(-6.31)#65 | 20.4%(-9.97)#1,649 |
| 66. | Calumet | 10.4% | 16.7%(-6.31)#66 | 20.4%(-9.97)#1,655 |
| 67. | New Vienna | 10.4% | 16.7%(-6.30)#67 | 20.4%(-9.96)#1,659 |
| 68. | Gibson | 10.4% | 16.7%(-6.28)#68 | 20.4%(-9.94)#1,672 |
| 69. | Monmouth | 10.4% | 16.7%(-6.28)#69 | 20.4%(-9.94)#1,674 |
| 70. | Marble Rock | 10.4% | 16.7%(-6.27)#70 | 20.4%(-9.93)#1,684 |
| 71. | Washta | 10.4% | 16.7%(-6.27)#71 | 20.4%(-9.93)#1,689 |
| 72. | Drakesville | 10.5% | 16.7%(-6.24)#72 | 20.4%(-9.90)#1,708 |
| 73. | Galva | 10.5% | 16.7%(-6.19)#73 | 20.4%(-9.85)#1,742 |
| 74. | Oak Hills | 10.6% | 16.7%(-6.12)#74 | 20.4%(-9.78)#1,799 |
| 75. | Orient | 10.6% | 16.7%(-6.11)#75 | 20.4%(-9.78)#1,803 |
| 76. | Melrose | 10.6% | 16.7%(-6.09)#76 | 20.4%(-9.75)#1,821 |
| 77. | Ayrshire | 10.6% | 16.7%(-6.09)#77 | 20.4%(-9.75)#1,825 |
| 78. | St Olaf | 10.6% | 16.7%(-6.08)#78 | 20.4%(-9.74)#1,828 |
| 79. | Willey | 10.7% | 16.7%(-6.05)#79 | 20.4%(-9.71)#1,851 |
| 80. | Geneva | 10.7% | 16.7%(-6.03)#80 | 20.4%(-9.69)#1,858 |
| 81. | Moorland | 10.7% | 16.7%(-6.00)#81 | 20.4%(-9.66)#1,876 |
| 82. | Goodell | 10.8% | 16.7%(-5.92)#82 | 20.4%(-9.58)#1,933 |
| 83. | Magnolia | 10.8% | 16.7%(-5.87)#83 | 20.4%(-9.53)#1,979 |
| 84. | Alden | 10.9% | 16.7%(-5.83)#84 | 20.4%(-9.49)#2,005 |
| 85. | Thornburg | 10.9% | 16.7%(-5.81)#85 | 20.4%(-9.47)#2,016 |
| 86. | Lehigh | 10.9% | 16.7%(-5.81)#86 | 20.4%(-9.47)#2,019 |
| 87. | Matlock | 10.9% | 16.7%(-5.80)#87 | 20.4%(-9.46)#2,031 |
| 88. | Whitten | 10.9% | 16.7%(-5.77)#88 | 20.4%(-9.43)#2,050 |
| 89. | Twin Lakes | 10.9% | 16.7%(-5.77)#89 | 20.4%(-9.43)#2,053 |
| 90. | Holy Cross | 11.0% | 16.7%(-5.76)#90 | 20.4%(-9.42)#2,055 |
| 91. | Quimby | 11.0% | 16.7%(-5.74)#91 | 20.4%(-9.40)#2,078 |
| 92. | Sun Valley Lake | 11.0% | 16.7%(-5.70)#92 | 20.4%(-9.36)#2,113 |
| 93. | Albion | 11.1% | 16.7%(-5.64)#93 | 20.4%(-9.30)#2,147 |
| 94. | Ledyard | 11.1% | 16.7%(-5.64)#94 | 20.4%(-9.30)#2,151 |
| 95. | Alexander | 11.1% | 16.7%(-5.64)#95 | 20.4%(-9.30)#2,154 |
| 96. | Peterson | 11.1% | 16.7%(-5.63)#96 | 20.4%(-9.29)#2,155 |
| 97. | Mount Auburn | 11.1% | 16.7%(-5.63)#97 | 20.4%(-9.29)#2,156 |
| 98. | Shambaugh | 11.1% | 16.7%(-5.63)#98 | 20.4%(-9.29)#2,159 |
| 99. | Dedham | 11.1% | 16.7%(-5.62)#99 | 20.4%(-9.28)#2,170 |
| 100. | Union | 11.1% | 16.7%(-5.60)#100 | 20.4%(-9.26)#2,181 |
Common Questions
What are the Top 10 Cities with the Lowest Costs of Housing as Percentage of Income in Iowa?
Top 10 Cities with the Lowest Costs of Housing as Percentage of Income in Iowa are:
#1
5.4%
#2
5.5%
#3
6.4%
#4
6.4%
#5
6.5%
#6
6.7%
#7
6.9%
#8
7.1%
#9
7.1%
#10
7.1%
What city has the Lowest Costs of Housing as Percentage of Income in Iowa?
Rodman has the Lowest Costs of Housing as Percentage of Income in Iowa with 5.4%.
What is the Average Housing Costs as Percentage of Income in the State of Iowa?
Average Housing Costs as Percentage of Income in Iowa is 16.7%.
What is the Average Housing Costs as Percentage of Income in the United States?
Average Housing Costs as Percentage of Income in the United States is 20.4%.