Cities with the Lowest Costs of Housing as Percentage of Income in Missouri
RELATED REPORTS & OPTIONS
Lowest Housing Costs / Income
Missouri
Compare Cities
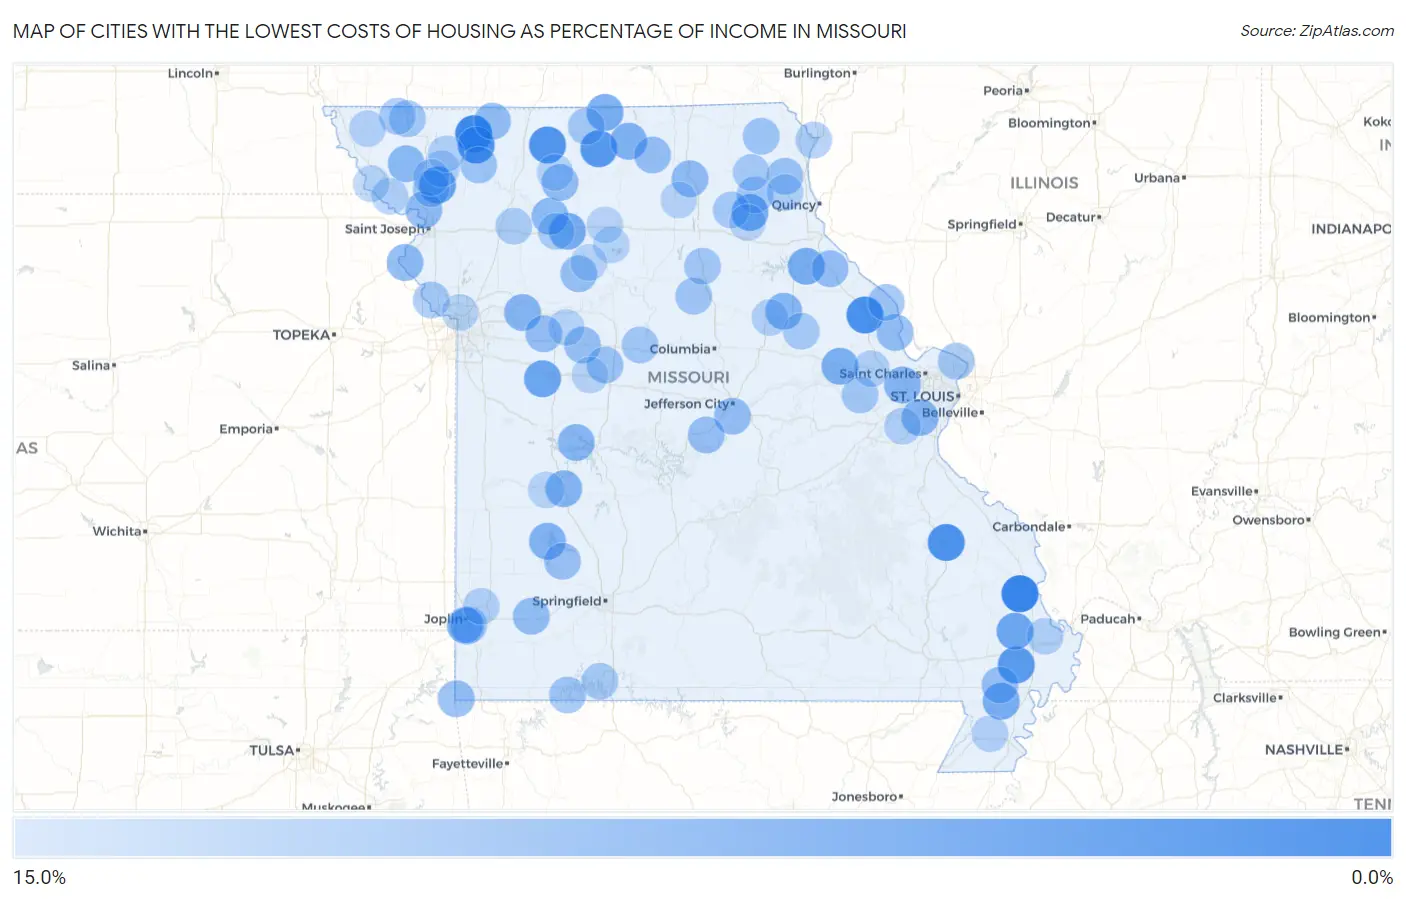
Map of Cities with the Lowest Costs of Housing as Percentage of Income in Missouri
15.0%
0.0%
Cities with the Lowest Costs of Housing as Percentage of Income in Missouri
| City | Housing Costs / Income | vs State | vs National | |
| 1. | Dutchtown | 4.7% | 18.1%(-13.3)#1 | 20.4%(-15.6)#62 |
| 2. | Worth | 5.1% | 18.1%(-12.9)#2 | 20.4%(-15.2)#87 |
| 3. | Whiteside | 5.7% | 18.1%(-12.4)#3 | 20.4%(-14.7)#128 |
| 4. | Mine La Motte | 5.9% | 18.1%(-12.2)#4 | 20.4%(-14.5)#150 |
| 5. | Gentry | 6.0% | 18.1%(-12.0)#5 | 20.4%(-14.3)#168 |
| 6. | Mount Moriah | 6.1% | 18.1%(-12.0)#6 | 20.4%(-14.3)#177 |
| 7. | Harris | 6.4% | 18.1%(-11.6)#7 | 20.4%(-13.9)#233 |
| 8. | Canalou | 6.6% | 18.1%(-11.4)#8 | 20.4%(-13.7)#267 |
| 9. | Rea | 7.0% | 18.1%(-11.1)#9 | 20.4%(-13.4)#336 |
| 10. | Vanduser | 7.6% | 18.1%(-10.5)#10 | 20.4%(-12.8)#464 |
| 11. | Centerview | 7.6% | 18.1%(-10.4)#11 | 20.4%(-12.7)#473 |
| 12. | Middle Grove | 7.9% | 18.1%(-10.2)#12 | 20.4%(-12.5)#549 |
| 13. | Bethel | 8.0% | 18.1%(-10.1)#13 | 20.4%(-12.4)#560 |
| 14. | Utica | 8.2% | 18.1%(-9.91)#14 | 20.4%(-12.2)#614 |
| 15. | Powersville | 8.2% | 18.1%(-9.84)#15 | 20.4%(-12.1)#629 |
| 16. | Tallapoosa | 8.3% | 18.1%(-9.82)#16 | 20.4%(-12.1)#638 |
| 17. | Center | 8.4% | 18.1%(-9.72)#17 | 20.4%(-12.0)#672 |
| 18. | Pendleton | 8.4% | 18.1%(-9.67)#18 | 20.4%(-12.0)#691 |
| 19. | Avalon | 8.6% | 18.1%(-9.51)#19 | 20.4%(-11.8)#751 |
| 20. | Pollock | 8.6% | 18.1%(-9.45)#20 | 20.4%(-11.8)#771 |
| 21. | Deering | 8.6% | 18.1%(-9.44)#21 | 20.4%(-11.7)#773 |
| 22. | Umber View Heights | 8.8% | 18.1%(-9.25)#22 | 20.4%(-11.5)#827 |
| 23. | Rush Hill | 9.0% | 18.1%(-9.08)#23 | 20.4%(-11.4)#893 |
| 24. | Camden | 9.0% | 18.1%(-9.06)#24 | 20.4%(-11.4)#898 |
| 25. | Vista | 9.0% | 18.1%(-9.04)#25 | 20.4%(-11.3)#912 |
| 26. | Tightwad | 9.1% | 18.1%(-8.97)#26 | 20.4%(-11.3)#942 |
| 27. | Parkdale | 9.1% | 18.1%(-8.95)#27 | 20.4%(-11.3)#947 |
| 28. | Weldon Spring Heights | 9.2% | 18.1%(-8.91)#28 | 20.4%(-11.2)#960 |
| 29. | Graham | 9.2% | 18.1%(-8.85)#29 | 20.4%(-11.2)#985 |
| 30. | Lock Springs | 9.4% | 18.1%(-8.69)#30 | 20.4%(-11.0)#1,070 |
| 31. | Lewis And Clark Village | 9.4% | 18.1%(-8.66)#31 | 20.4%(-11.0)#1,091 |
| 32. | Indian Lake | 9.5% | 18.1%(-8.60)#32 | 20.4%(-10.9)#1,127 |
| 33. | Amazonia | 9.5% | 18.1%(-8.56)#33 | 20.4%(-10.9)#1,146 |
| 34. | Millard | 9.6% | 18.1%(-8.52)#34 | 20.4%(-10.8)#1,163 |
| 35. | Edinburg | 9.7% | 18.1%(-8.42)#35 | 20.4%(-10.7)#1,209 |
| 36. | Foley | 9.7% | 18.1%(-8.41)#36 | 20.4%(-10.7)#1,219 |
| 37. | Allendale | 9.7% | 18.1%(-8.40)#37 | 20.4%(-10.7)#1,226 |
| 38. | Southwest City | 9.7% | 18.1%(-8.38)#38 | 20.4%(-10.7)#1,238 |
| 39. | Stotts City | 9.7% | 18.1%(-8.33)#39 | 20.4%(-10.6)#1,260 |
| 40. | Frankford | 9.8% | 18.1%(-8.29)#40 | 20.4%(-10.6)#1,287 |
| 41. | Greencastle | 9.8% | 18.1%(-8.29)#41 | 20.4%(-10.6)#1,288 |
| 42. | Wardsville | 9.8% | 18.1%(-8.26)#42 | 20.4%(-10.6)#1,317 |
| 43. | Mayview | 9.9% | 18.1%(-8.22)#43 | 20.4%(-10.5)#1,336 |
| 44. | Leawood | 9.9% | 18.1%(-8.17)#44 | 20.4%(-10.5)#1,354 |
| 45. | Parma | 9.9% | 18.1%(-8.16)#45 | 20.4%(-10.5)#1,366 |
| 46. | Eugene | 10.0% | 18.1%(-8.13)#46 | 20.4%(-10.4)#1,384 |
| 47. | Emma | 10.0% | 18.1%(-8.11)#47 | 20.4%(-10.4)#1,392 |
| 48. | Bogard | 10.0% | 18.1%(-8.09)#48 | 20.4%(-10.4)#1,402 |
| 49. | Dadeville | 10.0% | 18.1%(-8.06)#49 | 20.4%(-10.4)#1,423 |
| 50. | Monticello | 10.2% | 18.1%(-7.88)#50 | 20.4%(-10.2)#1,526 |
| 51. | Hughesville | 10.2% | 18.1%(-7.88)#51 | 20.4%(-10.2)#1,528 |
| 52. | Rosendale | 10.2% | 18.1%(-7.84)#52 | 20.4%(-10.1)#1,551 |
| 53. | Darlington | 10.3% | 18.1%(-7.77)#53 | 20.4%(-10.1)#1,589 |
| 54. | Annada | 10.3% | 18.1%(-7.76)#54 | 20.4%(-10.1)#1,591 |
| 55. | Wyaconda | 10.3% | 18.1%(-7.75)#55 | 20.4%(-10.0)#1,597 |
| 56. | Higbee | 10.4% | 18.1%(-7.66)#56 | 20.4%(-9.96)#1,662 |
| 57. | Arrow Point | 10.5% | 18.1%(-7.62)#57 | 20.4%(-9.92)#1,693 |
| 58. | Clearmont | 10.5% | 18.1%(-7.57)#58 | 20.4%(-9.87)#1,732 |
| 59. | Blackwater | 10.5% | 18.1%(-7.55)#59 | 20.4%(-9.85)#1,741 |
| 60. | Cairo | 10.5% | 18.1%(-7.55)#60 | 20.4%(-9.85)#1,747 |
| 61. | Newark | 10.6% | 18.1%(-7.50)#61 | 20.4%(-9.80)#1,778 |
| 62. | Cliff Village | 10.6% | 18.1%(-7.50)#62 | 20.4%(-9.80)#1,781 |
| 63. | West Alton | 10.6% | 18.1%(-7.49)#63 | 20.4%(-9.79)#1,787 |
| 64. | Marthasville | 10.6% | 18.1%(-7.44)#64 | 20.4%(-9.73)#1,833 |
| 65. | Ravanna | 10.6% | 18.1%(-7.43)#65 | 20.4%(-9.73)#1,841 |
| 66. | Farley | 10.7% | 18.1%(-7.36)#66 | 20.4%(-9.66)#1,882 |
| 67. | Knox City | 10.7% | 18.1%(-7.34)#67 | 20.4%(-9.64)#1,893 |
| 68. | Elmo | 10.7% | 18.1%(-7.33)#68 | 20.4%(-9.63)#1,897 |
| 69. | Leonard | 10.8% | 18.1%(-7.26)#69 | 20.4%(-9.56)#1,951 |
| 70. | Indian Point | 10.9% | 18.1%(-7.22)#70 | 20.4%(-9.52)#1,984 |
| 71. | Wellsville | 10.9% | 18.1%(-7.22)#71 | 20.4%(-9.52)#1,985 |
| 72. | Shoal Creek Drive | 10.9% | 18.1%(-7.18)#72 | 20.4%(-9.47)#2,015 |
| 73. | Alexandria | 11.1% | 18.1%(-7.02)#73 | 20.4%(-9.32)#2,136 |
| 74. | Mooresville | 11.1% | 18.1%(-7.00)#74 | 20.4%(-9.30)#2,150 |
| 75. | Kidder | 11.1% | 18.1%(-6.95)#75 | 20.4%(-9.25)#2,187 |
| 76. | Foristell | 11.2% | 18.1%(-6.87)#76 | 20.4%(-9.17)#2,252 |
| 77. | Diehlstadt | 11.3% | 18.1%(-6.83)#77 | 20.4%(-9.13)#2,287 |
| 78. | Ewing | 11.3% | 18.1%(-6.82)#78 | 20.4%(-9.12)#2,293 |
| 79. | Latham | 11.3% | 18.1%(-6.81)#79 | 20.4%(-9.11)#2,301 |
| 80. | Labarque Creek | 11.3% | 18.1%(-6.78)#80 | 20.4%(-9.08)#2,330 |
| 81. | Brooklyn Heights | 11.3% | 18.1%(-6.75)#81 | 20.4%(-9.05)#2,347 |
| 82. | Forest City | 11.3% | 18.1%(-6.75)#82 | 20.4%(-9.05)#2,351 |
| 83. | Vandiver | 11.3% | 18.1%(-6.75)#83 | 20.4%(-9.04)#2,358 |
| 84. | Guilford | 11.4% | 18.1%(-6.70)#84 | 20.4%(-9.00)#2,401 |
| 85. | Tarkio | 11.4% | 18.1%(-6.66)#85 | 20.4%(-8.96)#2,432 |
| 86. | Bragg City | 11.4% | 18.1%(-6.64)#86 | 20.4%(-8.94)#2,457 |
| 87. | Conception Junction | 11.5% | 18.1%(-6.61)#87 | 20.4%(-8.91)#2,484 |
| 88. | Corder | 11.6% | 18.1%(-6.52)#88 | 20.4%(-8.82)#2,573 |
| 89. | Brimson | 11.6% | 18.1%(-6.50)#89 | 20.4%(-8.80)#2,584 |
| 90. | Sumner | 11.6% | 18.1%(-6.49)#90 | 20.4%(-8.79)#2,592 |
| 91. | Goose Creek Lake | 11.6% | 18.1%(-6.48)#91 | 20.4%(-8.78)#2,604 |
| 92. | Big Lake | 11.6% | 18.1%(-6.48)#92 | 20.4%(-8.78)#2,608 |
| 93. | Oakwood | 11.6% | 18.1%(-6.47)#93 | 20.4%(-8.77)#2,614 |
| 94. | La Monte | 11.6% | 18.1%(-6.45)#94 | 20.4%(-8.75)#2,636 |
| 95. | Elmer | 11.6% | 18.1%(-6.44)#95 | 20.4%(-8.73)#2,648 |
| 96. | Bolckow | 11.6% | 18.1%(-6.43)#96 | 20.4%(-8.73)#2,650 |
| 97. | Meadville | 11.7% | 18.1%(-6.42)#97 | 20.4%(-8.72)#2,658 |
| 98. | Shelbyville | 11.7% | 18.1%(-6.40)#98 | 20.4%(-8.70)#2,679 |
| 99. | Roscoe | 11.7% | 18.1%(-6.40)#99 | 20.4%(-8.70)#2,688 |
| 100. | Tina | 11.7% | 18.1%(-6.39)#100 | 20.4%(-8.69)#2,694 |
Common Questions
What are the Top 10 Cities with the Lowest Costs of Housing as Percentage of Income in Missouri?
Top 10 Cities with the Lowest Costs of Housing as Percentage of Income in Missouri are:
#1
4.7%
#2
5.1%
#3
5.7%
#4
5.9%
#5
6.0%
#6
6.1%
#7
6.4%
#8
6.6%
#9
7.0%
#10
7.6%
What city has the Lowest Costs of Housing as Percentage of Income in Missouri?
Dutchtown has the Lowest Costs of Housing as Percentage of Income in Missouri with 4.7%.
What is the Average Housing Costs as Percentage of Income in the State of Missouri?
Average Housing Costs as Percentage of Income in Missouri is 18.1%.
What is the Average Housing Costs as Percentage of Income in the United States?
Average Housing Costs as Percentage of Income in the United States is 20.4%.