Cities with the Lowest Costs of Housing as Percentage of Income in Connecticut
RELATED REPORTS & OPTIONS
Lowest Housing Costs / Income
Connecticut
Compare Cities
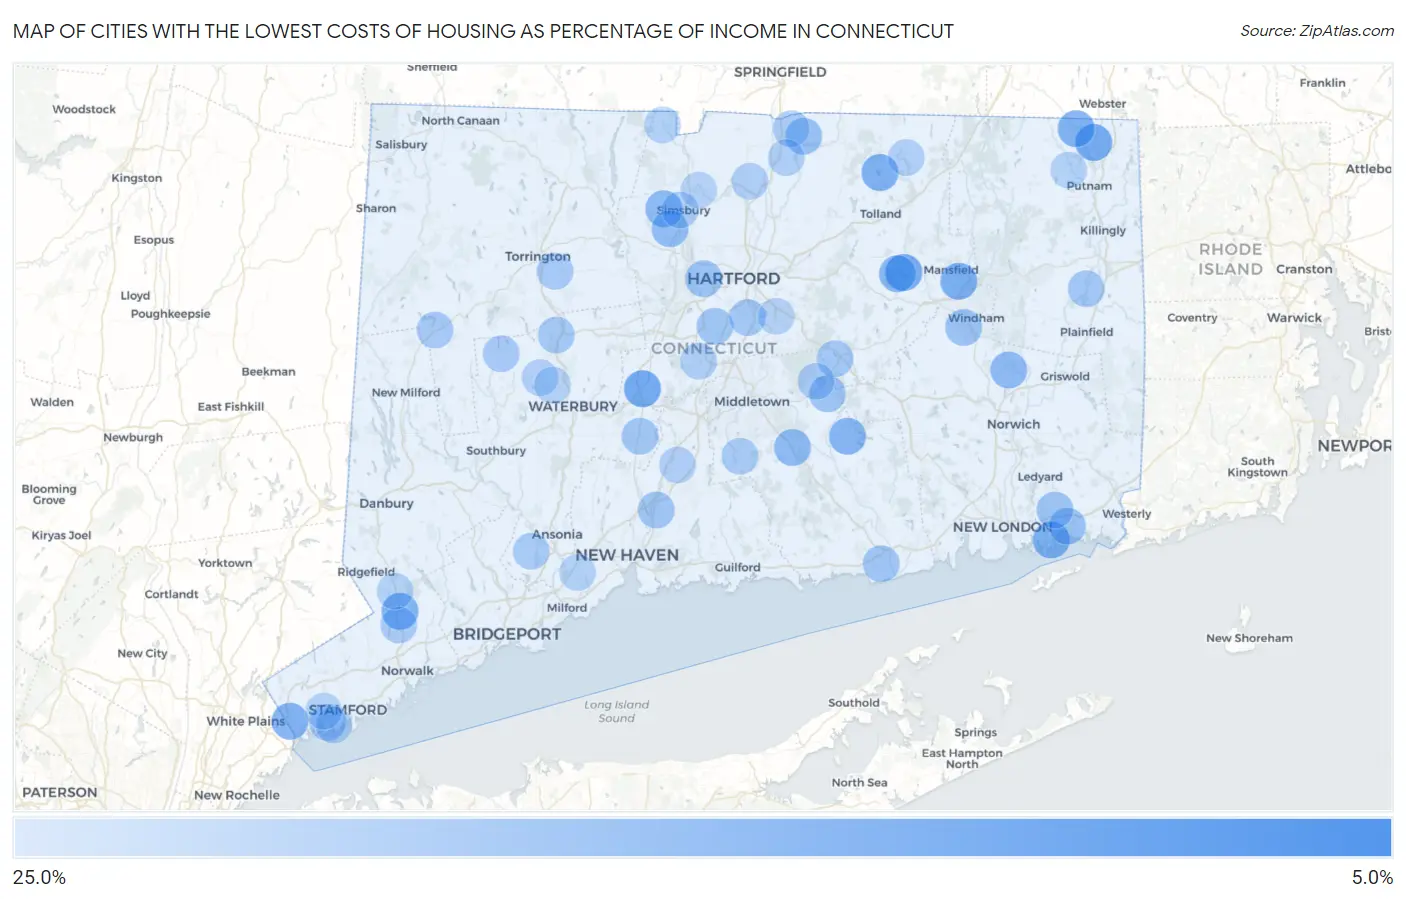
Map of Cities with the Lowest Costs of Housing as Percentage of Income in Connecticut
25.0%
0.0%
Cities with the Lowest Costs of Housing as Percentage of Income in Connecticut
| City | Housing Costs / Income | vs State | vs National | |
| 1. | Witches Woods | 6.8% | 21.8%(-15.0)#1 | 20.4%(-13.6)#285 |
| 2. | Cornwall | 7.4% | 21.8%(-14.4)#2 | 20.4%(-13.0)#407 |
| 3. | Botsford | 11.5% | 21.8%(-10.3)#3 | 20.4%(-8.91)#2,487 |
| 4. | Lakeside Woods | 12.2% | 21.8%(-9.58)#4 | 20.4%(-8.16)#3,268 |
| 5. | Brookfield Center | 12.5% | 21.8%(-9.29)#5 | 20.4%(-7.87)#3,599 |
| 6. | Bridgewater | 12.5% | 21.8%(-9.26)#6 | 20.4%(-7.83)#3,637 |
| 7. | Plantsville | 13.5% | 21.8%(-8.33)#7 | 20.4%(-6.91)#4,842 |
| 8. | Old Hill | 13.6% | 21.8%(-8.24)#8 | 20.4%(-6.81)#4,988 |
| 9. | North Grosvenor Dale | 13.7% | 21.8%(-8.11)#9 | 20.4%(-6.68)#5,186 |
| 10. | South Coventry | 13.8% | 21.8%(-8.01)#10 | 20.4%(-6.58)#5,340 |
| 11. | Mansfield Center | 14.5% | 21.8%(-7.35)#11 | 20.4%(-5.92)#6,451 |
| 12. | Hawleyville | 14.5% | 21.8%(-7.28)#12 | 20.4%(-5.86)#6,561 |
| 13. | Noank | 14.6% | 21.8%(-7.20)#13 | 20.4%(-5.78)#6,691 |
| 14. | Crystal Lake | 14.6% | 21.8%(-7.17)#14 | 20.4%(-5.74)#6,751 |
| 15. | Quinebaug | 14.7% | 21.8%(-7.07)#15 | 20.4%(-5.65)#6,910 |
| 16. | Cannondale | 14.9% | 21.8%(-6.95)#16 | 20.4%(-5.52)#7,132 |
| 17. | Glenville | 14.9% | 21.8%(-6.94)#17 | 20.4%(-5.51)#7,160 |
| 18. | Candlewood Orchards | 15.5% | 21.8%(-6.29)#18 | 20.4%(-4.86)#8,394 |
| 19. | Moodus | 15.5% | 21.8%(-6.28)#19 | 20.4%(-4.86)#8,408 |
| 20. | Coventry Lake | 15.8% | 21.8%(-6.04)#20 | 20.4%(-4.61)#8,891 |
| 21. | West Simsbury | 15.9% | 21.8%(-5.87)#21 | 20.4%(-4.44)#9,246 |
| 22. | Murray | 16.3% | 21.8%(-5.46)#22 | 20.4%(-4.04)#10,136 |
| 23. | Higganum | 16.4% | 21.8%(-5.43)#23 | 20.4%(-4.01)#10,204 |
| 24. | Baltic | 16.4% | 21.8%(-5.40)#24 | 20.4%(-3.98)#10,278 |
| 25. | Ball Pond | 16.7% | 21.8%(-5.13)#25 | 20.4%(-3.71)#10,888 |
| 26. | Weatogue | 17.0% | 21.8%(-4.78)#26 | 20.4%(-3.36)#11,660 |
| 27. | Riverton | 17.1% | 21.8%(-4.73)#27 | 20.4%(-3.31)#11,772 |
| 28. | Candlewood Shores | 17.1% | 21.8%(-4.66)#28 | 20.4%(-3.24)#11,921 |
| 29. | Lakes West | 17.3% | 21.8%(-4.52)#29 | 20.4%(-3.09)#12,242 |
| 30. | Candlewood Lake Club | 17.3% | 21.8%(-4.49)#30 | 20.4%(-3.07)#12,293 |
| 31. | Hazardville | 17.3% | 21.8%(-4.49)#31 | 20.4%(-3.06)#12,307 |
| 32. | West Mountain | 17.3% | 21.8%(-4.46)#32 | 20.4%(-3.03)#12,365 |
| 33. | Noroton Heights | 17.4% | 21.8%(-4.40)#33 | 20.4%(-2.98)#12,489 |
| 34. | Lakes East | 17.4% | 21.8%(-4.36)#34 | 20.4%(-2.93)#12,607 |
| 35. | Mystic | 17.5% | 21.8%(-4.30)#35 | 20.4%(-2.88)#12,721 |
| 36. | Litchfield Borough | 17.6% | 21.8%(-4.18)#36 | 20.4%(-2.75)#12,989 |
| 37. | Darien Downtown | 17.8% | 21.8%(-4.05)#37 | 20.4%(-2.62)#13,272 |
| 38. | West Hartford | 17.8% | 21.8%(-3.98)#38 | 20.4%(-2.55)#13,432 |
| 39. | Daniels Farm | 17.9% | 21.8%(-3.93)#39 | 20.4%(-2.50)#13,541 |
| 40. | South Windham | 18.0% | 21.8%(-3.83)#40 | 20.4%(-2.41)#13,751 |
| 41. | Saugatuck | 18.0% | 21.8%(-3.83)#41 | 20.4%(-2.41)#13,758 |
| 42. | East Hampton | 18.0% | 21.8%(-3.82)#42 | 20.4%(-2.39)#13,790 |
| 43. | Old Mystic | 18.0% | 21.8%(-3.76)#43 | 20.4%(-2.33)#13,933 |
| 44. | Inglenook | 18.2% | 21.8%(-3.63)#44 | 20.4%(-2.21)#14,200 |
| 45. | Candlewood Isle | 18.2% | 21.8%(-3.56)#45 | 20.4%(-2.14)#14,355 |
| 46. | Noroton | 18.3% | 21.8%(-3.53)#46 | 20.4%(-2.10)#14,443 |
| 47. | Old Saybrook Center | 18.3% | 21.8%(-3.50)#47 | 20.4%(-2.07)#14,514 |
| 48. | North Haven | 18.3% | 21.8%(-3.48)#48 | 20.4%(-2.06)#14,556 |
| 49. | Cheshire Village | 18.4% | 21.8%(-3.39)#49 | 20.4%(-1.96)#14,765 |
| 50. | Mill Plain | 18.5% | 21.8%(-3.26)#50 | 20.4%(-1.83)#15,071 |
| 51. | Plattsville | 18.5% | 21.8%(-3.26)#51 | 20.4%(-1.83)#15,072 |
| 52. | Newington | 18.5% | 21.8%(-3.26)#52 | 20.4%(-1.83)#15,075 |
| 53. | Bogus Hill | 18.6% | 21.8%(-3.24)#53 | 20.4%(-1.81)#15,115 |
| 54. | Terramuggus | 18.7% | 21.8%(-3.14)#54 | 20.4%(-1.71)#15,341 |
| 55. | Northford | 18.7% | 21.8%(-3.08)#55 | 20.4%(-1.66)#15,473 |
| 56. | Wethersfield | 18.7% | 21.8%(-3.06)#56 | 20.4%(-1.63)#15,520 |
| 57. | Wauregan | 18.8% | 21.8%(-3.02)#57 | 20.4%(-1.59)#15,607 |
| 58. | Mechanicsville | 18.8% | 21.8%(-3.00)#58 | 20.4%(-1.58)#15,640 |
| 59. | Thomaston | 18.9% | 21.8%(-2.90)#59 | 20.4%(-1.48)#15,836 |
| 60. | Staples | 18.9% | 21.8%(-2.85)#60 | 20.4%(-1.43)#15,939 |
| 61. | Sandy Hook | 19.0% | 21.8%(-2.80)#61 | 20.4%(-1.38)#16,040 |
| 62. | Northwest Harwinton | 19.1% | 21.8%(-2.70)#62 | 20.4%(-1.27)#16,247 |
| 63. | Lake Pocotopaug | 19.2% | 21.8%(-2.61)#63 | 20.4%(-1.19)#16,415 |
| 64. | Bethlehem Village | 19.2% | 21.8%(-2.60)#64 | 20.4%(-1.18)#16,430 |
| 65. | Riverside | 19.2% | 21.8%(-2.60)#65 | 20.4%(-1.17)#16,470 |
| 66. | Greens Farms | 19.2% | 21.8%(-2.60)#66 | 20.4%(-1.17)#16,490 |
| 67. | Tokeneke | 19.2% | 21.8%(-2.60)#67 | 20.4%(-1.17)#16,497 |
| 68. | Poplar Plains | 19.2% | 21.8%(-2.60)#68 | 20.4%(-1.17)#16,508 |
| 69. | Weston | 19.2% | 21.8%(-2.60)#69 | 20.4%(-1.17)#16,522 |
| 70. | Indian Field | 19.2% | 21.8%(-2.60)#70 | 20.4%(-1.17)#16,529 |
| 71. | Sail Harbor | 19.2% | 21.8%(-2.60)#71 | 20.4%(-1.17)#16,534 |
| 72. | New Preston | 19.2% | 21.8%(-2.57)#72 | 20.4%(-1.14)#16,584 |
| 73. | East | 19.3% | 21.8%(-2.47)#73 | 20.4%(-1.04)#16,792 |
| 74. | Sherwood Manor | 19.3% | 21.8%(-2.46)#74 | 20.4%(-1.04)#16,798 |
| 75. | Stepney | 19.4% | 21.8%(-2.45)#75 | 20.4%(-1.02)#16,826 |
| 76. | Shelton | 19.4% | 21.8%(-2.44)#76 | 20.4%(-1.01)#16,841 |
| 77. | Durham | 19.4% | 21.8%(-2.39)#77 | 20.4%(-0.966)#16,937 |
| 78. | Route 7 Gateway | 19.5% | 21.8%(-2.33)#78 | 20.4%(-0.903)#17,065 |
| 79. | Wilton Center | 19.5% | 21.8%(-2.30)#79 | 20.4%(-0.878)#17,116 |
| 80. | Naugatuck Borough | 19.6% | 21.8%(-2.25)#80 | 20.4%(-0.824)#17,237 |
| 81. | Lake Bungee | 19.6% | 21.8%(-2.20)#81 | 20.4%(-0.777)#17,358 |
| 82. | Westport | 19.7% | 21.8%(-2.14)#82 | 20.4%(-0.710)#17,484 |
| 83. | Simsbury Center | 19.8% | 21.8%(-2.03)#83 | 20.4%(-0.607)#17,684 |
| 84. | Windsor Locks | 19.9% | 21.8%(-1.93)#84 | 20.4%(-0.504)#17,893 |
| 85. | Kensington | 19.9% | 21.8%(-1.90)#85 | 20.4%(-0.473)#17,950 |
| 86. | Southwood Acres | 20.0% | 21.8%(-1.84)#86 | 20.4%(-0.411)#18,063 |
| 87. | Old Greenwich | 20.0% | 21.8%(-1.83)#87 | 20.4%(-0.405)#18,070 |
| 88. | Wallingford Center | 20.0% | 21.8%(-1.75)#88 | 20.4%(-0.327)#18,209 |
| 89. | Watertown | 20.2% | 21.8%(-1.64)#89 | 20.4%(-0.213)#18,409 |
| 90. | Stafford Springs | 20.2% | 21.8%(-1.59)#90 | 20.4%(-0.163)#18,510 |
| 91. | Orange | 20.2% | 21.8%(-1.56)#91 | 20.4%(-0.129)#18,569 |
| 92. | West Cornwall | 20.3% | 21.8%(-1.48)#92 | 20.4%(-0.053)#18,734 |
| 93. | Georgetown | 20.4% | 21.8%(-1.43)#93 | 20.4%(+0.001)#18,815 |
| 94. | Cos Cob | 20.4% | 21.8%(-1.42)#94 | 20.4%(+0.004)#18,823 |
| 95. | North Granby | 20.4% | 21.8%(-1.41)#95 | 20.4%(+0.016)#18,839 |
| 96. | South Woodstock | 20.4% | 21.8%(-1.39)#96 | 20.4%(+0.041)#18,898 |
| 97. | Glastonbury Center | 20.5% | 21.8%(-1.33)#97 | 20.4%(+0.099)#18,992 |
| 98. | Tariffville | 20.5% | 21.8%(-1.32)#98 | 20.4%(+0.106)#19,000 |
| 99. | Oakville | 20.5% | 21.8%(-1.30)#99 | 20.4%(+0.127)#19,035 |
| 100. | Mamanasco Lake | 20.6% | 21.8%(-1.21)#100 | 20.4%(+0.214)#19,187 |
1
2Common Questions
What are the Top 10 Cities with the Lowest Costs of Housing as Percentage of Income in Connecticut?
Top 10 Cities with the Lowest Costs of Housing as Percentage of Income in Connecticut are:
#1
13.5%
#2
13.7%
#3
13.8%
#4
14.5%
#5
14.6%
#6
14.6%
#7
14.7%
#8
14.9%
#9
14.9%
#10
15.5%
What city has the Lowest Costs of Housing as Percentage of Income in Connecticut?
Plantsville has the Lowest Costs of Housing as Percentage of Income in Connecticut with 13.5%.
What is the Average Housing Costs as Percentage of Income in the State of Connecticut?
Average Housing Costs as Percentage of Income in Connecticut is 21.8%.
What is the Average Housing Costs as Percentage of Income in the United States?
Average Housing Costs as Percentage of Income in the United States is 20.4%.