Cities with the Lowest Costs of Housing as Percentage of Income in Alabama
RELATED REPORTS & OPTIONS
Lowest Housing Costs / Income
Alabama
Compare Cities
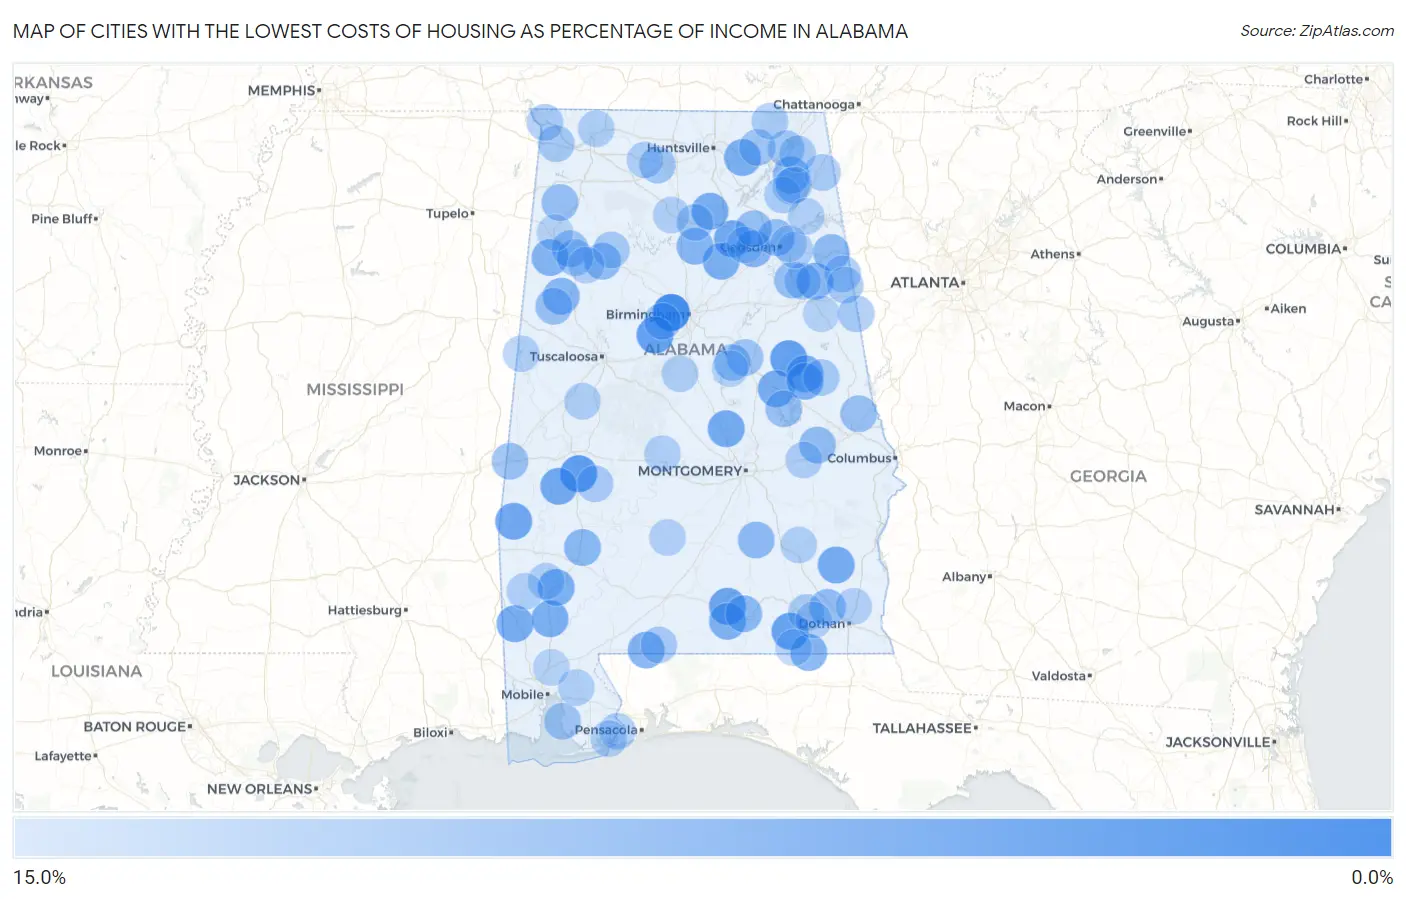
Map of Cities with the Lowest Costs of Housing as Percentage of Income in Alabama
15.0%
0.0%
Cities with the Lowest Costs of Housing as Percentage of Income in Alabama
| City | Housing Costs / Income | vs State | vs National | |
| 1. | Hanover | 3.4% | 17.9%(-14.5)#1 | 20.4%(-17.0)#21 |
| 2. | Edgewater | 4.3% | 17.9%(-13.6)#2 | 20.4%(-16.1)#40 |
| 3. | Providence | 6.4% | 17.9%(-11.4)#3 | 20.4%(-13.9)#232 |
| 4. | Millerville | 6.7% | 17.9%(-11.2)#4 | 20.4%(-13.7)#273 |
| 5. | North Johns | 6.7% | 17.9%(-11.2)#5 | 20.4%(-13.6)#280 |
| 6. | Coffee Springs | 7.1% | 17.9%(-10.8)#6 | 20.4%(-13.3)#350 |
| 7. | Heath | 7.6% | 17.9%(-10.3)#7 | 20.4%(-12.8)#447 |
| 8. | Needham | 7.7% | 17.9%(-10.2)#8 | 20.4%(-12.7)#493 |
| 9. | Myrtlewood | 7.8% | 17.9%(-10.1)#9 | 20.4%(-12.5)#522 |
| 10. | Susan Moore | 7.9% | 17.9%(-10.0)#10 | 20.4%(-12.5)#547 |
| 11. | Marbury | 8.1% | 17.9%(-9.81)#11 | 20.4%(-12.3)#597 |
| 12. | Blue Springs | 8.2% | 17.9%(-9.66)#12 | 20.4%(-12.1)#634 |
| 13. | Kellyton | 8.3% | 17.9%(-9.62)#13 | 20.4%(-12.1)#647 |
| 14. | Goldville | 8.3% | 17.9%(-9.60)#14 | 20.4%(-12.1)#652 |
| 15. | Baileyton | 8.3% | 17.9%(-9.58)#15 | 20.4%(-12.1)#658 |
| 16. | Deer Park | 8.4% | 17.9%(-9.49)#16 | 20.4%(-12.0)#692 |
| 17. | Mcintosh | 8.5% | 17.9%(-9.40)#17 | 20.4%(-11.9)#729 |
| 18. | Allgood | 8.5% | 17.9%(-9.39)#18 | 20.4%(-11.9)#730 |
| 19. | Paint Rock | 8.6% | 17.9%(-9.34)#19 | 20.4%(-11.8)#748 |
| 20. | New Site | 8.6% | 17.9%(-9.29)#20 | 20.4%(-11.8)#765 |
| 21. | Leroy | 8.7% | 17.9%(-9.20)#21 | 20.4%(-11.7)#786 |
| 22. | Libertyville | 8.8% | 17.9%(-9.11)#22 | 20.4%(-11.6)#816 |
| 23. | Pollard | 8.9% | 17.9%(-8.95)#23 | 20.4%(-11.4)#873 |
| 24. | White Plains | 9.1% | 17.9%(-8.75)#24 | 20.4%(-11.2)#956 |
| 25. | Beaverton | 9.2% | 17.9%(-8.71)#25 | 20.4%(-11.2)#975 |
| 26. | Black | 9.2% | 17.9%(-8.70)#26 | 20.4%(-11.2)#979 |
| 27. | Garden City | 9.4% | 17.9%(-8.49)#27 | 20.4%(-11.0)#1,090 |
| 28. | Gallant | 9.4% | 17.9%(-8.45)#28 | 20.4%(-10.9)#1,108 |
| 29. | Belk | 9.5% | 17.9%(-8.40)#29 | 20.4%(-10.9)#1,132 |
| 30. | Fulton | 9.6% | 17.9%(-8.33)#30 | 20.4%(-10.8)#1,165 |
| 31. | Babbie | 9.8% | 17.9%(-8.11)#31 | 20.4%(-10.6)#1,284 |
| 32. | Powell | 9.9% | 17.9%(-8.04)#32 | 20.4%(-10.5)#1,333 |
| 33. | Petrey | 9.9% | 17.9%(-7.97)#33 | 20.4%(-10.5)#1,368 |
| 34. | Spring Garden | 9.9% | 17.9%(-7.97)#34 | 20.4%(-10.4)#1,370 |
| 35. | Kansas | 10.1% | 17.9%(-7.76)#35 | 20.4%(-10.2)#1,489 |
| 36. | Newton | 10.2% | 17.9%(-7.65)#36 | 20.4%(-10.1)#1,554 |
| 37. | Notasulga | 10.3% | 17.9%(-7.64)#37 | 20.4%(-10.1)#1,558 |
| 38. | Reece City | 10.5% | 17.9%(-7.42)#38 | 20.4%(-9.90)#1,710 |
| 39. | New Union | 10.5% | 17.9%(-7.38)#39 | 20.4%(-9.86)#1,736 |
| 40. | Hodges | 10.5% | 17.9%(-7.36)#40 | 20.4%(-9.84)#1,753 |
| 41. | Alexandria | 10.6% | 17.9%(-7.25)#41 | 20.4%(-9.73)#1,836 |
| 42. | Concord | 10.7% | 17.9%(-7.24)#42 | 20.4%(-9.72)#1,846 |
| 43. | Cusseta | 10.7% | 17.9%(-7.17)#43 | 20.4%(-9.65)#1,887 |
| 44. | Kennedy | 10.8% | 17.9%(-7.12)#44 | 20.4%(-9.60)#1,924 |
| 45. | Cuba | 10.8% | 17.9%(-7.08)#45 | 20.4%(-9.56)#1,953 |
| 46. | Twin | 11.0% | 17.9%(-6.93)#46 | 20.4%(-9.41)#2,066 |
| 47. | Our Town | 11.0% | 17.9%(-6.93)#47 | 20.4%(-9.41)#2,068 |
| 48. | Oak Grove | 11.0% | 17.9%(-6.88)#48 | 20.4%(-9.36)#2,112 |
| 49. | Fayetteville | 11.1% | 17.9%(-6.82)#49 | 20.4%(-9.30)#2,146 |
| 50. | Point Clear | 11.3% | 17.9%(-6.61)#50 | 20.4%(-9.09)#2,322 |
| 51. | Winfield | 11.3% | 17.9%(-6.55)#51 | 20.4%(-9.03)#2,375 |
| 52. | Fyffe | 11.4% | 17.9%(-6.53)#52 | 20.4%(-9.01)#2,386 |
| 53. | Hollywood | 11.4% | 17.9%(-6.52)#53 | 20.4%(-9.00)#2,399 |
| 54. | Trinity | 11.4% | 17.9%(-6.49)#54 | 20.4%(-8.97)#2,427 |
| 55. | Pleasant Groves | 11.5% | 17.9%(-6.43)#55 | 20.4%(-8.91)#2,486 |
| 56. | Berlin | 11.5% | 17.9%(-6.42)#56 | 20.4%(-8.89)#2,500 |
| 57. | Edwardsville | 11.7% | 17.9%(-6.20)#57 | 20.4%(-8.68)#2,702 |
| 58. | Fruithurst | 11.7% | 17.9%(-6.19)#58 | 20.4%(-8.67)#2,709 |
| 59. | Cherokee | 11.8% | 17.9%(-6.10)#59 | 20.4%(-8.58)#2,819 |
| 60. | Nauvoo | 11.8% | 17.9%(-6.09)#60 | 20.4%(-8.57)#2,823 |
| 61. | Daviston | 11.8% | 17.9%(-6.07)#61 | 20.4%(-8.55)#2,851 |
| 62. | Ranburne | 11.8% | 17.9%(-6.07)#62 | 20.4%(-8.55)#2,856 |
| 63. | Weaver | 11.9% | 17.9%(-6.01)#63 | 20.4%(-8.49)#2,923 |
| 64. | Thomaston | 12.0% | 17.9%(-5.93)#64 | 20.4%(-8.41)#2,997 |
| 65. | Valley Head | 12.0% | 17.9%(-5.91)#65 | 20.4%(-8.39)#3,015 |
| 66. | Waterloo | 12.0% | 17.9%(-5.88)#66 | 20.4%(-8.36)#3,047 |
| 67. | Riverview | 12.0% | 17.9%(-5.85)#67 | 20.4%(-8.33)#3,075 |
| 68. | Lillian | 12.1% | 17.9%(-5.76)#68 | 20.4%(-8.24)#3,170 |
| 69. | Hytop | 12.2% | 17.9%(-5.73)#69 | 20.4%(-8.21)#3,205 |
| 70. | Level Plains | 12.2% | 17.9%(-5.67)#70 | 20.4%(-8.14)#3,279 |
| 71. | Lakeview | 12.3% | 17.9%(-5.64)#71 | 20.4%(-8.12)#3,305 |
| 72. | Pisgah | 12.3% | 17.9%(-5.63)#72 | 20.4%(-8.11)#3,312 |
| 73. | Hokes Bluff | 12.3% | 17.9%(-5.60)#73 | 20.4%(-8.08)#3,346 |
| 74. | Wilton | 12.3% | 17.9%(-5.59)#74 | 20.4%(-8.07)#3,359 |
| 75. | St Stephens | 12.3% | 17.9%(-5.55)#75 | 20.4%(-8.03)#3,409 |
| 76. | Franklin | 12.4% | 17.9%(-5.53)#76 | 20.4%(-8.01)#3,429 |
| 77. | Akron | 12.4% | 17.9%(-5.52)#77 | 20.4%(-8.00)#3,432 |
| 78. | St Florian | 12.4% | 17.9%(-5.51)#78 | 20.4%(-7.99)#3,443 |
| 79. | Shiloh | 12.4% | 17.9%(-5.51)#79 | 20.4%(-7.99)#3,450 |
| 80. | Valley Grande | 12.4% | 17.9%(-5.46)#80 | 20.4%(-7.94)#3,509 |
| 81. | Stapleton | 12.5% | 17.9%(-5.44)#81 | 20.4%(-7.92)#3,534 |
| 82. | Chatom | 12.5% | 17.9%(-5.41)#82 | 20.4%(-7.89)#3,572 |
| 83. | Pickensville | 12.5% | 17.9%(-5.41)#83 | 20.4%(-7.89)#3,579 |
| 84. | Hillsboro | 12.5% | 17.9%(-5.39)#84 | 20.4%(-7.87)#3,601 |
| 85. | Clayhatchee | 12.5% | 17.9%(-5.36)#85 | 20.4%(-7.84)#3,634 |
| 86. | Tidmore Bend | 12.5% | 17.9%(-5.35)#86 | 20.4%(-7.83)#3,645 |
| 87. | Mount Olive Cdp Jefferson County | 12.6% | 17.9%(-5.34)#87 | 20.4%(-7.82)#3,653 |
| 88. | West Point | 12.6% | 17.9%(-5.33)#88 | 20.4%(-7.81)#3,668 |
| 89. | Perdido Beach | 12.6% | 17.9%(-5.33)#89 | 20.4%(-7.81)#3,672 |
| 90. | Banks | 12.6% | 17.9%(-5.31)#90 | 20.4%(-7.79)#3,688 |
| 91. | Glen Allen | 12.7% | 17.9%(-5.22)#91 | 20.4%(-7.70)#3,801 |
| 92. | Pine Apple | 12.7% | 17.9%(-5.22)#92 | 20.4%(-7.70)#3,806 |
| 93. | Headland | 12.7% | 17.9%(-5.19)#93 | 20.4%(-7.66)#3,839 |
| 94. | Sand Rock | 12.7% | 17.9%(-5.15)#94 | 20.4%(-7.63)#3,876 |
| 95. | Hollis Crossroads | 12.8% | 17.9%(-5.12)#95 | 20.4%(-7.60)#3,914 |
| 96. | Altoona | 12.8% | 17.9%(-5.11)#96 | 20.4%(-7.59)#3,929 |
| 97. | Talladega Springs | 12.9% | 17.9%(-4.99)#97 | 20.4%(-7.47)#4,074 |
| 98. | Geneva | 13.0% | 17.9%(-4.95)#98 | 20.4%(-7.43)#4,129 |
| 99. | Creola | 13.0% | 17.9%(-4.91)#99 | 20.4%(-7.39)#4,170 |
| 100. | Hamilton | 13.0% | 17.9%(-4.90)#100 | 20.4%(-7.38)#4,183 |
Common Questions
What are the Top 10 Cities with the Lowest Costs of Housing as Percentage of Income in Alabama?
Top 10 Cities with the Lowest Costs of Housing as Percentage of Income in Alabama are:
#1
4.3%
#2
6.4%
#3
6.7%
#4
6.7%
#5
7.1%
#6
7.6%
#7
7.7%
#8
7.8%
#9
7.9%
#10
8.1%
What city has the Lowest Costs of Housing as Percentage of Income in Alabama?
Edgewater has the Lowest Costs of Housing as Percentage of Income in Alabama with 4.3%.
What is the Average Housing Costs as Percentage of Income in the State of Alabama?
Average Housing Costs as Percentage of Income in Alabama is 17.9%.
What is the Average Housing Costs as Percentage of Income in the United States?
Average Housing Costs as Percentage of Income in the United States is 20.4%.