States with the Lowest Costs of Housing as Percentage of Income
RELATED REPORTS & OPTIONS
Lowest Housing Costs / Income
United States
Compare States
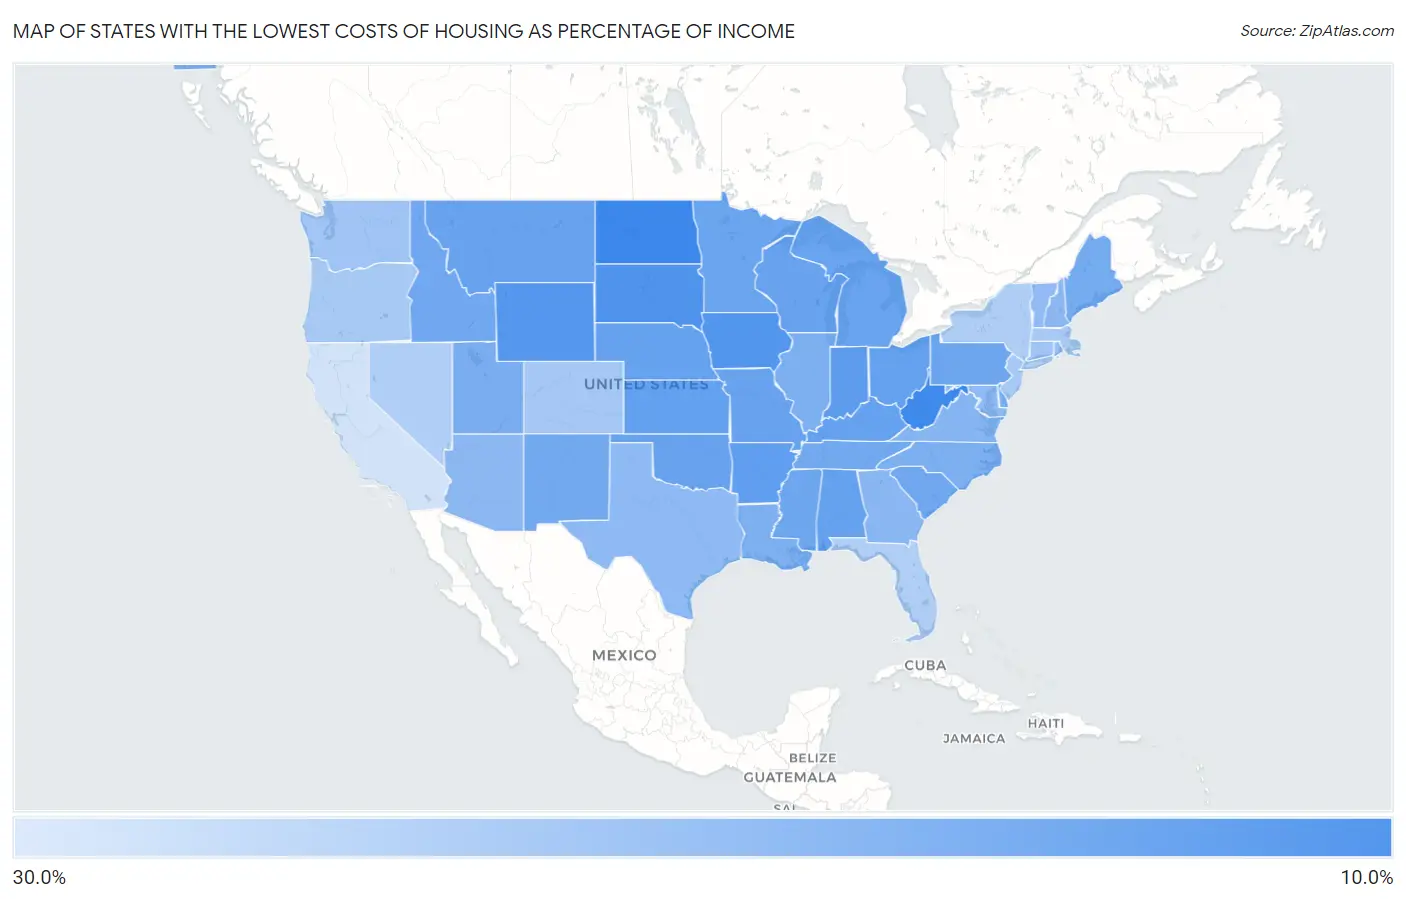
Map of States with the Lowest Costs of Housing as Percentage of Income
30.0%
10.0%
States with the Lowest Costs of Housing as Percentage of Income in the United States
| State | Housing Costs / Income | vs State Median | vs National | |
| 1. | North Dakota | 15.2% | 19.2% (-3.99) | 20.4%(-5.14) |
| 2. | West Virginia | 15.3% | 19.2% (-3.88) | 20.4%(-5.03) |
| 3. | South Dakota | 16.4% | 19.2% (-2.78) | 20.4%(-3.93) |
| 4. | Iowa | 16.7% | 19.2% (-2.51) | 20.4%(-3.66) |
| 5. | Wyoming | 17.0% | 19.2% (-2.28) | 20.4%(-3.43) |
| 6. | Indiana | 17.5% | 19.2% (-1.74) | 20.4%(-2.89) |
| 7. | Arkansas | 17.7% | 19.2% (-1.55) | 20.4%(-2.70) |
| 8. | Kansas | 17.8% | 19.2% (-1.40) | 20.4%(-2.55) |
| 9. | Alabama | 17.9% | 19.2% (-1.33) | 20.4%(-2.48) |
| 10. | Ohio | 17.9% | 19.2% (-1.31) | 20.4%(-2.46) |
| 11. | Nebraska | 17.9% | 19.2% (-1.31) | 20.4%(-2.46) |
| 12. | Kentucky | 18.0% | 19.2% (-1.26) | 20.4%(-2.41) |
| 13. | Oklahoma | 18.1% | 19.2% (-1.16) | 20.4%(-2.31) |
| 14. | Missouri | 18.1% | 19.2% (-1.15) | 20.4%(-2.30) |
| 15. | Wisconsin | 18.1% | 19.2% (-1.13) | 20.4%(-2.27) |
| 16. | Montana | 18.2% | 19.2% (-1.05) | 20.4%(-2.20) |
| 17. | Michigan | 18.2% | 19.2% (-0.992) | 20.4%(-2.14) |
| 18. | Minnesota | 18.4% | 19.2% (-0.796) | 20.4%(-1.94) |
| 19. | Mississippi | 18.5% | 19.2% (-0.679) | 20.4%(-1.83) |
| 20. | Pennsylvania | 18.6% | 19.2% (-0.597) | 20.4%(-1.74) |
| 21. | Idaho | 18.7% | 19.2% (-0.513) | 20.4%(-1.66) |
| 22. | South Carolina | 18.8% | 19.2% (-0.441) | 20.4%(-1.59) |
| 23. | Tennessee | 18.8% | 19.2% (-0.394) | 20.4%(-1.54) |
| 24. | New Mexico | 18.8% | 19.2% (-0.386) | 20.4%(-1.53) |
| 25. | Maine | 19.0% | 19.2% (-0.203) | 20.4%(-1.35) |
| 26. | Utah | 19.4% | 19.2% (+0.203) | 20.4%(-0.945) |
| 27. | Louisiana | 19.5% | 19.2% (+0.271) | 20.4%(-0.877) |
| 28. | North Carolina | 19.6% | 19.2% (+0.354) | 20.4%(-0.794) |
| 29. | Illinois | 19.6% | 19.2% (+0.418) | 20.4%(-0.731) |
| 30. | Delaware | 19.7% | 19.2% (+0.439) | 20.4%(-0.710) |
| 31. | Alaska | 20.0% | 19.2% (+0.821) | 20.4%(-0.327) |
| 32. | Virginia | 20.2% | 19.2% (+0.950) | 20.4%(-0.199) |
| 33. | Georgia | 20.4% | 19.2% (+1.19) | 20.4%(+0.041) |
| 34. | New Hampshire | 20.6% | 19.2% (+1.39) | 20.4%(+0.244) |
| 35. | Arizona | 20.7% | 19.2% (+1.46) | 20.4%(+0.308) |
| 36. | Texas | 20.8% | 19.2% (+1.56) | 20.4%(+0.409) |
| 37. | Maryland | 20.8% | 19.2% (+1.59) | 20.4%(+0.441) |
| 38. | Vermont | 20.9% | 19.2% (+1.70) | 20.4%(+0.556) |
| 39. | Rhode Island | 21.4% | 19.2% (+2.17) | 20.4%(+1.02) |
| 40. | Connecticut | 21.8% | 19.2% (+2.57) | 20.4%(+1.43) |
| 41. | Washington | 22.0% | 19.2% (+2.75) | 20.4%(+1.60) |
| 42. | Colorado | 22.3% | 19.2% (+3.06) | 20.4%(+1.91) |
| 43. | New Jersey | 22.5% | 19.2% (+3.23) | 20.4%(+2.09) |
| 44. | Oregon | 22.5% | 19.2% (+3.29) | 20.4%(+2.14) |
| 45. | Massachusetts | 22.5% | 19.2% (+3.30) | 20.4%(+2.16) |
| 46. | New York | 23.0% | 19.2% (+3.73) | 20.4%(+2.58) |
| 47. | Nevada | 23.2% | 19.2% (+3.99) | 20.4%(+2.84) |
| 48. | Florida | 23.2% | 19.2% (+3.99) | 20.4%(+2.84) |
| 49. | Hawaii | 23.8% | 19.2% (+4.60) | 20.4%(+3.46) |
| 50. | California | 25.4% | 19.2% (+6.19) | 20.4%(+5.05) |
1
Common Questions
What are the Top 10 States with the Lowest Costs of Housing as Percentage of Income in the United States?
Top 10 States with the Lowest Costs of Housing as Percentage of Income in the United States are:
#1
15.2%
#2
15.3%
#3
16.4%
#4
16.7%
#5
17.0%
#6
17.5%
#7
17.7%
#8
17.8%
#9
17.9%
#10
17.9%
What state has the Lowest Costs of Housing as Percentage of Income in the United States?
North Dakota has the Lowest Costs of Housing as Percentage of Income in the United States with 15.2%.
What is the Average Housing Costs as Percentage of Income in the United States?
Average Housing Costs as Percentage of Income in the United States is 20.4%.