Cities with the Lowest Costs of Housing as Percentage of Income in Virginia
RELATED REPORTS & OPTIONS
Lowest Housing Costs / Income
Virginia
Compare Cities
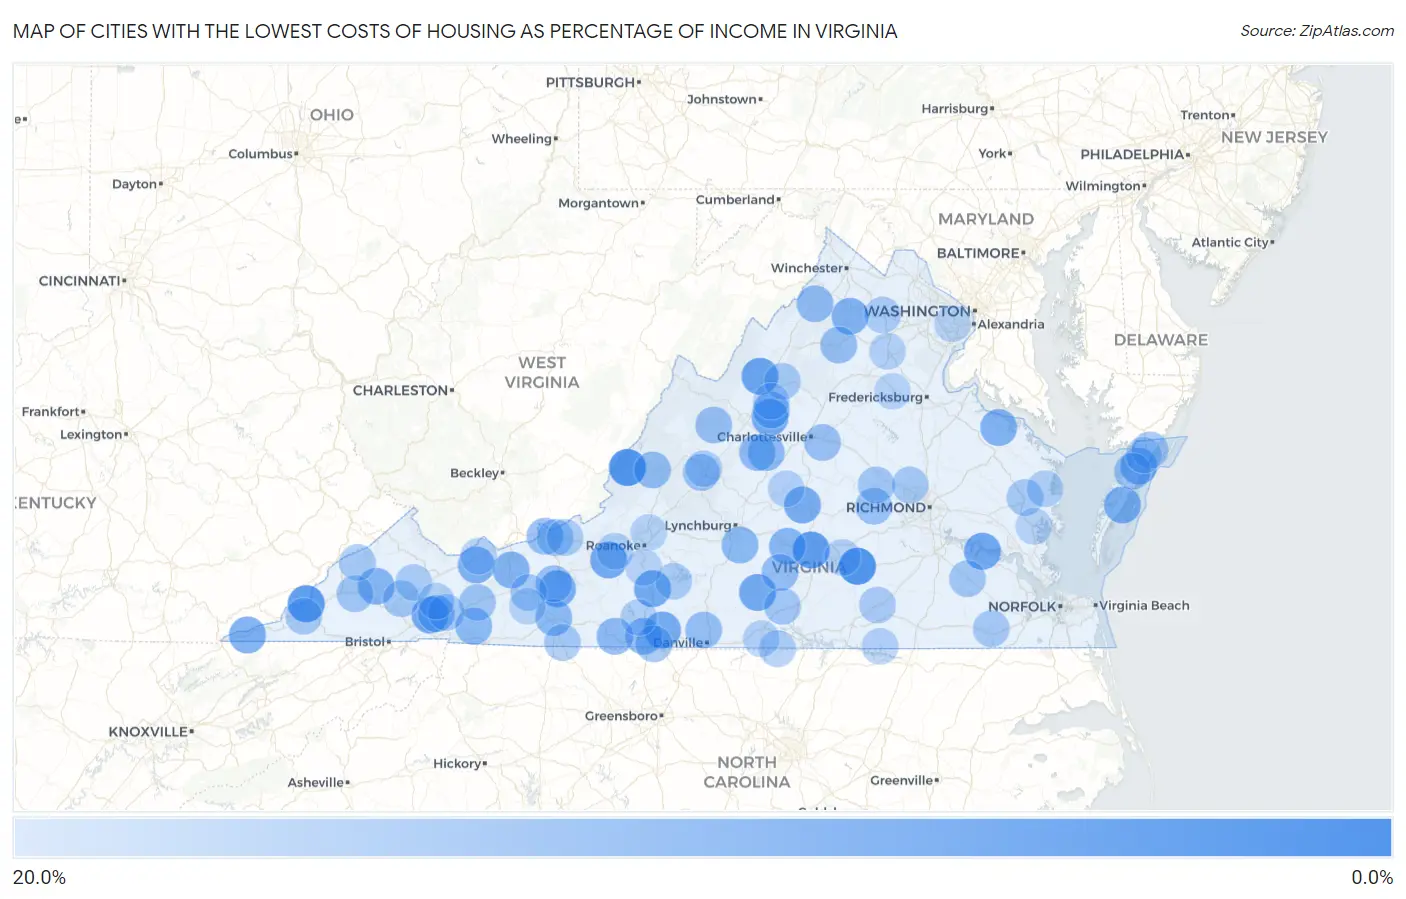
Map of Cities with the Lowest Costs of Housing as Percentage of Income in Virginia
20.0%
0.0%
Cities with the Lowest Costs of Housing as Percentage of Income in Virginia
| City | Housing Costs / Income | vs State | vs National | |
| 1. | Breaks | 3.3% | 20.2%(-16.8)#1 | 20.4%(-17.0)#20 |
| 2. | Eggleston | 4.9% | 20.2%(-15.3)#2 | 20.4%(-15.5)#72 |
| 3. | Stickleyville | 5.2% | 20.2%(-15.0)#3 | 20.4%(-15.2)#93 |
| 4. | Keswick | 5.5% | 20.2%(-14.6)#4 | 20.4%(-14.8)#116 |
| 5. | Nottoway Court House | 5.9% | 20.2%(-14.3)#5 | 20.4%(-14.5)#152 |
| 6. | Callaghan | 6.0% | 20.2%(-14.1)#6 | 20.4%(-14.3)#166 |
| 7. | Keokee | 6.8% | 20.2%(-13.4)#7 | 20.4%(-13.6)#292 |
| 8. | Hampden Sydney | 7.1% | 20.2%(-13.1)#8 | 20.4%(-13.3)#360 |
| 9. | Belmont Estates | 8.2% | 20.2%(-11.9)#9 | 20.4%(-12.1)#635 |
| 10. | Claremont | 8.7% | 20.2%(-11.4)#10 | 20.4%(-11.6)#801 |
| 11. | Shawsville | 9.0% | 20.2%(-11.2)#11 | 20.4%(-11.4)#892 |
| 12. | Henry Fork | 9.0% | 20.2%(-11.2)#12 | 20.4%(-11.3)#904 |
| 13. | Nathalie | 9.1% | 20.2%(-11.1)#13 | 20.4%(-11.3)#919 |
| 14. | Crimora | 9.2% | 20.2%(-11.0)#14 | 20.4%(-11.2)#978 |
| 15. | Emory | 9.2% | 20.2%(-10.9)#15 | 20.4%(-11.1)#995 |
| 16. | Chatmoss | 9.4% | 20.2%(-10.8)#16 | 20.4%(-11.0)#1,057 |
| 17. | Hiwassee | 9.4% | 20.2%(-10.8)#17 | 20.4%(-11.0)#1,059 |
| 18. | Buckingham Courthouse | 9.7% | 20.2%(-10.5)#18 | 20.4%(-10.7)#1,207 |
| 19. | Quinby | 9.8% | 20.2%(-10.4)#19 | 20.4%(-10.6)#1,291 |
| 20. | Ewing | 9.8% | 20.2%(-10.4)#20 | 20.4%(-10.6)#1,320 |
| 21. | Rose Hill Cdp Lee County | 10.2% | 20.2%(-10.0)#21 | 20.4%(-10.2)#1,506 |
| 22. | Chester Gap | 10.4% | 20.2%(-9.74)#22 | 20.4%(-9.94)#1,676 |
| 23. | Montross | 10.4% | 20.2%(-9.73)#23 | 20.4%(-9.93)#1,687 |
| 24. | Gratton | 10.4% | 20.2%(-9.73)#24 | 20.4%(-9.93)#1,690 |
| 25. | Nelsonia | 10.5% | 20.2%(-9.70)#25 | 20.4%(-9.90)#1,709 |
| 26. | Bastian | 10.5% | 20.2%(-9.65)#26 | 20.4%(-9.85)#1,740 |
| 27. | Bland | 10.8% | 20.2%(-9.36)#27 | 20.4%(-9.56)#1,954 |
| 28. | Dante | 10.9% | 20.2%(-9.25)#28 | 20.4%(-9.45)#2,035 |
| 29. | Pamplin City | 11.1% | 20.2%(-9.11)#29 | 20.4%(-9.31)#2,139 |
| 30. | Rustburg | 11.4% | 20.2%(-8.80)#30 | 20.4%(-9.00)#2,403 |
| 31. | Nellysford | 11.4% | 20.2%(-8.80)#31 | 20.4%(-9.00)#2,404 |
| 32. | Glade Spring | 11.4% | 20.2%(-8.79)#32 | 20.4%(-8.99)#2,406 |
| 33. | Harriston | 11.4% | 20.2%(-8.74)#33 | 20.4%(-8.94)#2,456 |
| 34. | Hillsville | 11.5% | 20.2%(-8.72)#34 | 20.4%(-8.92)#2,473 |
| 35. | Troutdale | 11.5% | 20.2%(-8.68)#35 | 20.4%(-8.88)#2,510 |
| 36. | Horse Pasture | 11.6% | 20.2%(-8.61)#36 | 20.4%(-8.81)#2,583 |
| 37. | Patrick Springs | 11.6% | 20.2%(-8.55)#37 | 20.4%(-8.75)#2,629 |
| 38. | Toms Brook | 11.8% | 20.2%(-8.37)#38 | 20.4%(-8.57)#2,834 |
| 39. | Wintergreen | 11.8% | 20.2%(-8.34)#39 | 20.4%(-8.54)#2,861 |
| 40. | Allison Gap | 12.0% | 20.2%(-8.14)#40 | 20.4%(-8.34)#3,061 |
| 41. | Disputanta | 12.0% | 20.2%(-8.14)#41 | 20.4%(-8.34)#3,063 |
| 42. | Low Moor | 12.1% | 20.2%(-8.06)#42 | 20.4%(-8.26)#3,139 |
| 43. | Phenix | 12.3% | 20.2%(-7.88)#43 | 20.4%(-8.08)#3,351 |
| 44. | Woodlawn Cdp Carroll County | 12.3% | 20.2%(-7.88)#44 | 20.4%(-8.08)#3,355 |
| 45. | Narrows | 12.3% | 20.2%(-7.87)#45 | 20.4%(-8.07)#3,360 |
| 46. | Sperryville | 12.5% | 20.2%(-7.68)#46 | 20.4%(-7.88)#3,586 |
| 47. | Augusta Springs | 12.5% | 20.2%(-7.66)#47 | 20.4%(-7.86)#3,608 |
| 48. | Mount Hermon | 12.6% | 20.2%(-7.62)#48 | 20.4%(-7.82)#3,654 |
| 49. | Draper | 12.6% | 20.2%(-7.59)#49 | 20.4%(-7.79)#3,690 |
| 50. | Lexington | 12.7% | 20.2%(-7.52)#50 | 20.4%(-7.72)#3,783 |
| 51. | Rivanna | 12.7% | 20.2%(-7.49)#51 | 20.4%(-7.69)#3,816 |
| 52. | Powhatan | 12.9% | 20.2%(-7.25)#52 | 20.4%(-7.45)#4,093 |
| 53. | Ridgeway | 13.0% | 20.2%(-7.20)#53 | 20.4%(-7.40)#4,156 |
| 54. | Wattsville | 13.1% | 20.2%(-7.06)#54 | 20.4%(-7.26)#4,345 |
| 55. | Stewartsville | 13.2% | 20.2%(-7.02)#55 | 20.4%(-7.22)#4,380 |
| 56. | Atkins | 13.2% | 20.2%(-6.99)#56 | 20.4%(-7.19)#4,437 |
| 57. | Riverview | 13.2% | 20.2%(-6.95)#57 | 20.4%(-7.15)#4,512 |
| 58. | Glen Wilton | 13.3% | 20.2%(-6.89)#58 | 20.4%(-7.09)#4,592 |
| 59. | Parksley | 13.3% | 20.2%(-6.85)#59 | 20.4%(-7.05)#4,641 |
| 60. | Pearisburg | 13.4% | 20.2%(-6.77)#60 | 20.4%(-6.97)#4,753 |
| 61. | Clover | 13.6% | 20.2%(-6.62)#61 | 20.4%(-6.82)#4,975 |
| 62. | Lebanon | 13.6% | 20.2%(-6.55)#62 | 20.4%(-6.75)#5,088 |
| 63. | Waverly | 13.6% | 20.2%(-6.53)#63 | 20.4%(-6.73)#5,121 |
| 64. | Goochland | 13.7% | 20.2%(-6.46)#64 | 20.4%(-6.66)#5,224 |
| 65. | Wyndham | 13.8% | 20.2%(-6.37)#65 | 20.4%(-6.57)#5,366 |
| 66. | Camptown | 13.8% | 20.2%(-6.36)#66 | 20.4%(-6.56)#5,383 |
| 67. | Cana | 13.9% | 20.2%(-6.30)#67 | 20.4%(-6.50)#5,475 |
| 68. | Massanutten | 13.9% | 20.2%(-6.30)#68 | 20.4%(-6.50)#5,481 |
| 69. | Fort Chiswell | 13.9% | 20.2%(-6.27)#69 | 20.4%(-6.46)#5,531 |
| 70. | Union Mill | 14.0% | 20.2%(-6.20)#70 | 20.4%(-6.40)#5,622 |
| 71. | Dryden | 14.0% | 20.2%(-6.18)#71 | 20.4%(-6.38)#5,655 |
| 72. | Clintwood | 14.0% | 20.2%(-6.18)#72 | 20.4%(-6.38)#5,658 |
| 73. | Saluda | 14.2% | 20.2%(-6.01)#73 | 20.4%(-6.21)#5,968 |
| 74. | Chilhowie | 14.2% | 20.2%(-5.99)#74 | 20.4%(-6.19)#6,004 |
| 75. | Boissevain | 14.2% | 20.2%(-5.98)#75 | 20.4%(-6.18)#6,021 |
| 76. | Alberta | 14.3% | 20.2%(-5.89)#76 | 20.4%(-6.09)#6,175 |
| 77. | Honaker | 14.4% | 20.2%(-5.75)#77 | 20.4%(-5.95)#6,416 |
| 78. | Marshall | 14.4% | 20.2%(-5.74)#78 | 20.4%(-5.93)#6,425 |
| 79. | Virgilina | 14.5% | 20.2%(-5.72)#79 | 20.4%(-5.91)#6,471 |
| 80. | Pembroke | 14.5% | 20.2%(-5.65)#80 | 20.4%(-5.85)#6,577 |
| 81. | Union Hall | 14.6% | 20.2%(-5.59)#81 | 20.4%(-5.79)#6,674 |
| 82. | East Lexington | 14.6% | 20.2%(-5.55)#82 | 20.4%(-5.75)#6,733 |
| 83. | Lafayette | 14.7% | 20.2%(-5.48)#83 | 20.4%(-5.68)#6,853 |
| 84. | Irvington | 14.8% | 20.2%(-5.39)#84 | 20.4%(-5.59)#7,010 |
| 85. | Bassett | 14.8% | 20.2%(-5.35)#85 | 20.4%(-5.55)#7,079 |
| 86. | Saltville | 14.8% | 20.2%(-5.34)#86 | 20.4%(-5.54)#7,097 |
| 87. | Yogaville | 15.0% | 20.2%(-5.17)#87 | 20.4%(-5.37)#7,407 |
| 88. | Springville | 15.0% | 20.2%(-5.17)#88 | 20.4%(-5.36)#7,423 |
| 89. | Burkeville | 15.0% | 20.2%(-5.15)#89 | 20.4%(-5.35)#7,464 |
| 90. | Grottoes | 15.1% | 20.2%(-5.12)#90 | 20.4%(-5.32)#7,503 |
| 91. | Opal | 15.1% | 20.2%(-5.04)#91 | 20.4%(-5.24)#7,632 |
| 92. | Gasburg | 15.1% | 20.2%(-5.04)#92 | 20.4%(-5.24)#7,639 |
| 93. | Cluster Springs | 15.1% | 20.2%(-5.04)#93 | 20.4%(-5.24)#7,640 |
| 94. | Cloverdale | 15.3% | 20.2%(-4.86)#94 | 20.4%(-5.05)#7,999 |
| 95. | Ivanhoe | 15.4% | 20.2%(-4.78)#95 | 20.4%(-4.98)#8,134 |
| 96. | Kings Park | 15.4% | 20.2%(-4.76)#96 | 20.4%(-4.96)#8,167 |
| 97. | Lake Of The Woods | 15.4% | 20.2%(-4.76)#97 | 20.4%(-4.96)#8,176 |
| 98. | Boones Mill | 15.4% | 20.2%(-4.74)#98 | 20.4%(-4.94)#8,206 |
| 99. | Gloucester Courthouse | 15.4% | 20.2%(-4.73)#99 | 20.4%(-4.93)#8,238 |
| 100. | Temperanceville | 15.5% | 20.2%(-4.67)#100 | 20.4%(-4.87)#8,378 |
Common Questions
What are the Top 10 Cities with the Lowest Costs of Housing as Percentage of Income in Virginia?
Top 10 Cities with the Lowest Costs of Housing as Percentage of Income in Virginia are:
#1
5.9%
#2
6.0%
#3
6.8%
#4
7.1%
#5
8.2%
#6
8.7%
#7
9.0%
#8
9.0%
#9
9.1%
#10
9.2%
What city has the Lowest Costs of Housing as Percentage of Income in Virginia?
Nottoway Court House has the Lowest Costs of Housing as Percentage of Income in Virginia with 5.9%.
What is the Average Housing Costs as Percentage of Income in the State of Virginia?
Average Housing Costs as Percentage of Income in Virginia is 20.2%.
What is the Average Housing Costs as Percentage of Income in the United States?
Average Housing Costs as Percentage of Income in the United States is 20.4%.