Cities with the Lowest Costs of Housing as Percentage of Income in Massachusetts
RELATED REPORTS & OPTIONS
Lowest Housing Costs / Income
Massachusetts
Compare Cities
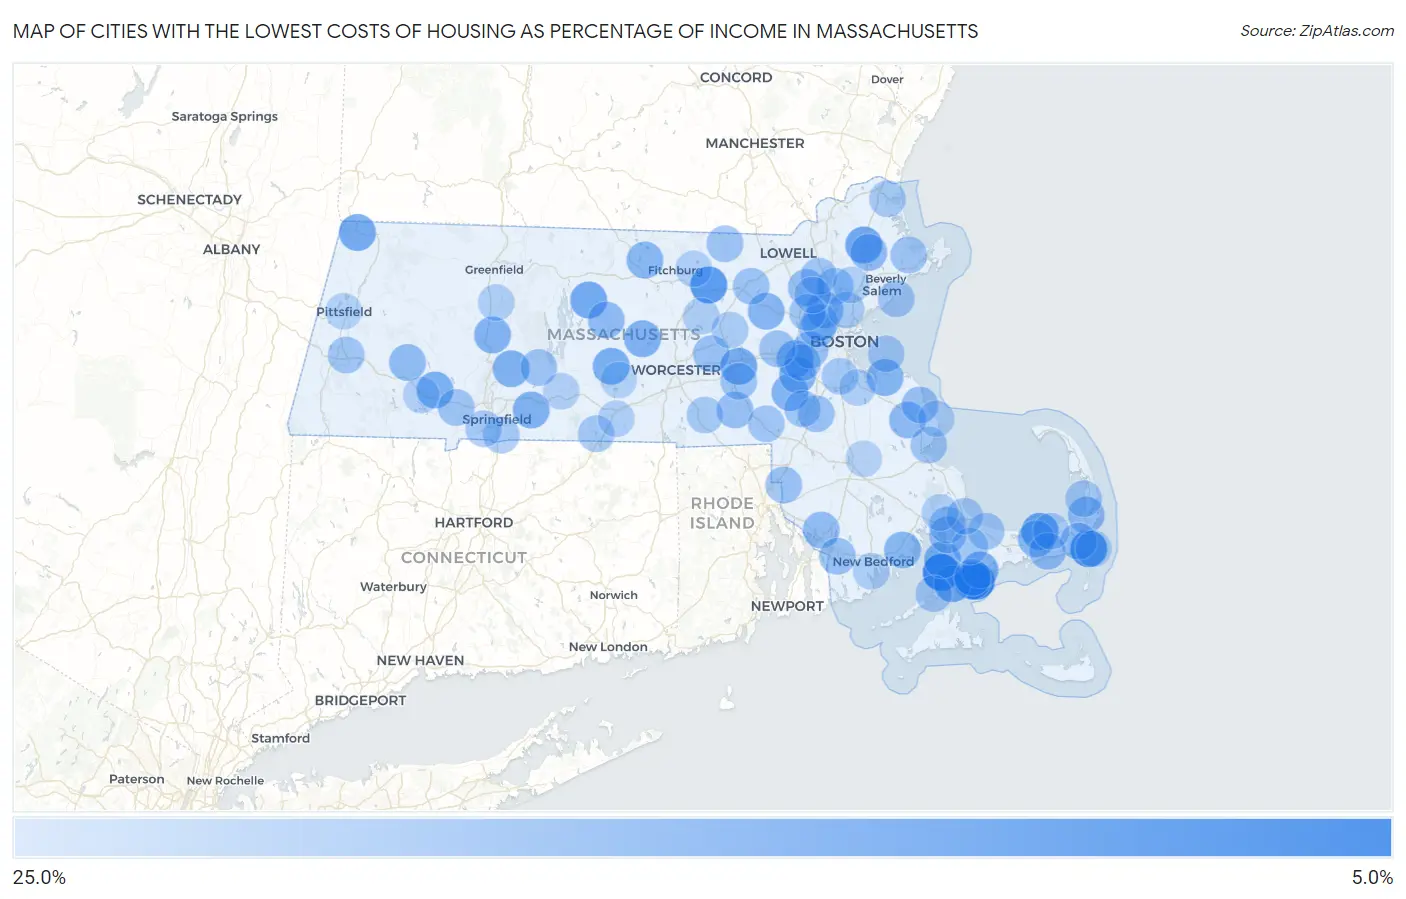
Map of Cities with the Lowest Costs of Housing as Percentage of Income in Massachusetts
25.0%
0.0%
Cities with the Lowest Costs of Housing as Percentage of Income in Massachusetts
| City | Housing Costs / Income | vs State | vs National | |
| 1. | New Seabury | 10.4% | 22.5%(-12.1)#1 | 20.4%(-9.99)#1,641 |
| 2. | West Falmouth | 10.6% | 22.5%(-11.9)#2 | 20.4%(-9.75)#1,826 |
| 3. | Green Harbor | 10.9% | 22.5%(-11.6)#3 | 20.4%(-9.46)#2,029 |
| 4. | West Chatham | 12.6% | 22.5%(-9.93)#4 | 20.4%(-7.78)#3,708 |
| 5. | Shirley | 13.5% | 22.5%(-9.04)#5 | 20.4%(-6.88)#4,887 |
| 6. | Dennis | 14.7% | 22.5%(-7.85)#6 | 20.4%(-5.69)#6,821 |
| 7. | Monomoscoy Island | 15.2% | 22.5%(-7.36)#7 | 20.4%(-5.20)#7,716 |
| 8. | Boxford | 15.2% | 22.5%(-7.34)#8 | 20.4%(-5.18)#7,753 |
| 9. | Teaticket | 15.5% | 22.5%(-7.07)#9 | 20.4%(-4.92)#8,260 |
| 10. | Petersham | 15.5% | 22.5%(-7.03)#10 | 20.4%(-4.87)#8,371 |
| 11. | Williamstown | 15.7% | 22.5%(-6.80)#11 | 20.4%(-4.65)#8,817 |
| 12. | Cedar Crest | 15.7% | 22.5%(-6.79)#12 | 20.4%(-4.63)#8,843 |
| 13. | Cordaville | 15.8% | 22.5%(-6.72)#13 | 20.4%(-4.56)#8,984 |
| 14. | North Brookfield | 16.2% | 22.5%(-6.38)#14 | 20.4%(-4.22)#9,731 |
| 15. | Russell | 16.2% | 22.5%(-6.33)#15 | 20.4%(-4.17)#9,842 |
| 16. | North Falmouth | 16.3% | 22.5%(-6.22)#16 | 20.4%(-4.07)#10,075 |
| 17. | Mashpee Neck | 16.4% | 22.5%(-6.10)#17 | 20.4%(-3.94)#10,354 |
| 18. | Granby | 16.6% | 22.5%(-5.95)#18 | 20.4%(-3.79)#10,670 |
| 19. | Rutland | 16.6% | 22.5%(-5.93)#19 | 20.4%(-3.77)#10,729 |
| 20. | Wilbraham | 16.6% | 22.5%(-5.90)#20 | 20.4%(-3.74)#10,812 |
| 21. | Hatfield | 16.8% | 22.5%(-5.72)#21 | 20.4%(-3.56)#11,177 |
| 22. | Medfield | 16.9% | 22.5%(-5.67)#22 | 20.4%(-3.51)#11,294 |
| 23. | Hingham | 16.9% | 22.5%(-5.60)#23 | 20.4%(-3.44)#11,456 |
| 24. | Wellesley | 17.0% | 22.5%(-5.58)#24 | 20.4%(-3.42)#11,507 |
| 25. | Dover | 17.1% | 22.5%(-5.42)#25 | 20.4%(-3.26)#11,858 |
| 26. | West Concord | 17.2% | 22.5%(-5.31)#26 | 20.4%(-3.16)#12,091 |
| 27. | Mattapoisett Center | 17.3% | 22.5%(-5.28)#27 | 20.4%(-3.12)#12,160 |
| 28. | Yarmouth Port | 17.3% | 22.5%(-5.27)#28 | 20.4%(-3.11)#12,188 |
| 29. | South Ashburnham | 17.3% | 22.5%(-5.21)#29 | 20.4%(-3.05)#12,319 |
| 30. | West Warren | 17.4% | 22.5%(-5.17)#30 | 20.4%(-3.02)#12,398 |
| 31. | North Pembroke | 17.7% | 22.5%(-4.86)#31 | 20.4%(-2.71)#13,086 |
| 32. | North Attleborough | 17.8% | 22.5%(-4.73)#32 | 20.4%(-2.57)#13,399 |
| 33. | Topsfield | 17.9% | 22.5%(-4.67)#33 | 20.4%(-2.51)#13,513 |
| 34. | Orleans | 17.9% | 22.5%(-4.65)#34 | 20.4%(-2.50)#13,546 |
| 35. | Barre | 17.9% | 22.5%(-4.65)#35 | 20.4%(-2.49)#13,566 |
| 36. | Seabrook | 17.9% | 22.5%(-4.61)#36 | 20.4%(-2.46)#13,626 |
| 37. | Chester | 18.0% | 22.5%(-4.57)#37 | 20.4%(-2.41)#13,737 |
| 38. | East Harwich | 18.0% | 22.5%(-4.52)#38 | 20.4%(-2.36)#13,868 |
| 39. | Winchester | 18.1% | 22.5%(-4.44)#39 | 20.4%(-2.29)#14,019 |
| 40. | West Dennis | 18.2% | 22.5%(-4.33)#40 | 20.4%(-2.18)#14,269 |
| 41. | Somerset | 18.3% | 22.5%(-4.27)#41 | 20.4%(-2.11)#14,429 |
| 42. | Pinehurst | 18.5% | 22.5%(-4.04)#42 | 20.4%(-1.89)#14,948 |
| 43. | Hopedale | 18.5% | 22.5%(-4.03)#43 | 20.4%(-1.87)#14,970 |
| 44. | Monument Beach | 18.5% | 22.5%(-3.98)#44 | 20.4%(-1.83)#15,084 |
| 45. | Newton | 18.6% | 22.5%(-3.88)#45 | 20.4%(-1.73)#15,312 |
| 46. | Marshfield Hills | 18.7% | 22.5%(-3.86)#46 | 20.4%(-1.71)#15,349 |
| 47. | Sharon | 18.7% | 22.5%(-3.85)#47 | 20.4%(-1.69)#15,387 |
| 48. | North Seekonk | 18.7% | 22.5%(-3.85)#48 | 20.4%(-1.69)#15,392 |
| 49. | Belmont | 18.7% | 22.5%(-3.83)#49 | 20.4%(-1.68)#15,425 |
| 50. | North Westport | 18.7% | 22.5%(-3.79)#50 | 20.4%(-1.63)#15,517 |
| 51. | Northborough | 18.8% | 22.5%(-3.77)#51 | 20.4%(-1.61)#15,569 |
| 52. | Needham | 18.8% | 22.5%(-3.75)#52 | 20.4%(-1.59)#15,614 |
| 53. | Littleton Common | 18.9% | 22.5%(-3.62)#53 | 20.4%(-1.47)#15,860 |
| 54. | Hopkinton | 19.0% | 22.5%(-3.58)#54 | 20.4%(-1.42)#15,952 |
| 55. | Reading | 19.0% | 22.5%(-3.57)#55 | 20.4%(-1.41)#15,969 |
| 56. | Belchertown | 19.0% | 22.5%(-3.48)#56 | 20.4%(-1.33)#16,125 |
| 57. | Westfield | 19.1% | 22.5%(-3.45)#57 | 20.4%(-1.30)#16,195 |
| 58. | Pepperell | 19.1% | 22.5%(-3.44)#58 | 20.4%(-1.29)#16,212 |
| 59. | Arlington | 19.1% | 22.5%(-3.44)#59 | 20.4%(-1.28)#16,220 |
| 60. | Essex | 19.1% | 22.5%(-3.41)#60 | 20.4%(-1.26)#16,268 |
| 61. | Cochituate | 19.1% | 22.5%(-3.39)#61 | 20.4%(-1.23)#16,321 |
| 62. | Buzzards Bay | 19.2% | 22.5%(-3.37)#62 | 20.4%(-1.21)#16,364 |
| 63. | Lee | 19.2% | 22.5%(-3.31)#63 | 20.4%(-1.15)#16,574 |
| 64. | Franklin Town | 19.2% | 22.5%(-3.29)#64 | 20.4%(-1.13)#16,607 |
| 65. | Marblehead | 19.3% | 22.5%(-3.28)#65 | 20.4%(-1.12)#16,627 |
| 66. | Walpole | 19.3% | 22.5%(-3.22)#66 | 20.4%(-1.06)#16,753 |
| 67. | Wilmington | 19.4% | 22.5%(-3.15)#67 | 20.4%(-0.997)#16,875 |
| 68. | Lexington | 19.5% | 22.5%(-3.05)#68 | 20.4%(-0.892)#17,086 |
| 69. | South Duxbury | 19.5% | 22.5%(-3.00)#69 | 20.4%(-0.848)#17,177 |
| 70. | East Sandwich | 19.5% | 22.5%(-2.98)#70 | 20.4%(-0.827)#17,231 |
| 71. | Milton | 19.6% | 22.5%(-2.94)#71 | 20.4%(-0.785)#17,341 |
| 72. | Hull | 19.6% | 22.5%(-2.93)#72 | 20.4%(-0.776)#17,361 |
| 73. | Forestdale | 19.6% | 22.5%(-2.89)#73 | 20.4%(-0.731)#17,439 |
| 74. | Longmeadow | 19.7% | 22.5%(-2.82)#74 | 20.4%(-0.668)#17,571 |
| 75. | North Eastham | 19.7% | 22.5%(-2.81)#75 | 20.4%(-0.656)#17,590 |
| 76. | Holland | 19.7% | 22.5%(-2.80)#76 | 20.4%(-0.646)#17,606 |
| 77. | Newburyport | 19.7% | 22.5%(-2.79)#77 | 20.4%(-0.637)#17,620 |
| 78. | Woods Hole | 19.7% | 22.5%(-2.79)#78 | 20.4%(-0.634)#17,628 |
| 79. | Whitinsville | 19.8% | 22.5%(-2.71)#79 | 20.4%(-0.554)#17,791 |
| 80. | Melrose | 19.9% | 22.5%(-2.67)#80 | 20.4%(-0.509)#17,884 |
| 81. | Sagamore | 19.9% | 22.5%(-2.66)#81 | 20.4%(-0.504)#17,892 |
| 82. | East Dennis | 20.0% | 22.5%(-2.53)#82 | 20.4%(-0.376)#18,121 |
| 83. | Agawam Town | 20.0% | 22.5%(-2.50)#83 | 20.4%(-0.343)#18,180 |
| 84. | Burlington | 20.1% | 22.5%(-2.48)#84 | 20.4%(-0.324)#18,218 |
| 85. | Hudson | 20.3% | 22.5%(-2.27)#85 | 20.4%(-0.114)#18,607 |
| 86. | Bliss Corner | 20.3% | 22.5%(-2.25)#86 | 20.4%(-0.098)#18,642 |
| 87. | South Lancaster | 20.4% | 22.5%(-2.17)#87 | 20.4%(-0.014)#18,791 |
| 88. | White Island Shores | 20.4% | 22.5%(-2.16)#88 | 20.4%(-0.002)#18,809 |
| 89. | South Deerfield | 20.5% | 22.5%(-2.07)#89 | 20.4%(+0.086)#18,972 |
| 90. | Sturbridge | 20.5% | 22.5%(-2.00)#90 | 20.4%(+0.157)#19,100 |
| 91. | Braintree Town | 20.6% | 22.5%(-1.97)#91 | 20.4%(+0.183)#19,145 |
| 92. | Ocean Bluff Brant Rock | 20.6% | 22.5%(-1.96)#92 | 20.4%(+0.194)#19,160 |
| 93. | Palmer Town | 20.6% | 22.5%(-1.90)#93 | 20.4%(+0.258)#19,284 |
| 94. | Lunenburg | 20.7% | 22.5%(-1.87)#94 | 20.4%(+0.281)#19,332 |
| 95. | Lynnfield | 20.7% | 22.5%(-1.83)#95 | 20.4%(+0.324)#19,411 |
| 96. | Blandford | 20.7% | 22.5%(-1.81)#96 | 20.4%(+0.345)#19,453 |
| 97. | Chatham | 20.8% | 22.5%(-1.73)#97 | 20.4%(+0.430)#19,586 |
| 98. | Pittsfield | 20.9% | 22.5%(-1.66)#98 | 20.4%(+0.498)#19,683 |
| 99. | East Brookfield | 20.9% | 22.5%(-1.61)#99 | 20.4%(+0.544)#19,756 |
| 100. | Bridgewater Town | 21.1% | 22.5%(-1.46)#100 | 20.4%(+0.698)#20,030 |
Common Questions
What are the Top 10 Cities with the Lowest Costs of Housing as Percentage of Income in Massachusetts?
Top 10 Cities with the Lowest Costs of Housing as Percentage of Income in Massachusetts are:
#1
10.4%
#2
10.6%
#3
12.6%
#4
13.5%
#5
14.7%
#6
15.2%
#7
15.2%
#8
15.5%
#9
15.5%
#10
15.7%
What city has the Lowest Costs of Housing as Percentage of Income in Massachusetts?
New Seabury has the Lowest Costs of Housing as Percentage of Income in Massachusetts with 10.4%.
What is the Average Housing Costs as Percentage of Income in the State of Massachusetts?
Average Housing Costs as Percentage of Income in Massachusetts is 22.5%.
What is the Average Housing Costs as Percentage of Income in the United States?
Average Housing Costs as Percentage of Income in the United States is 20.4%.