Cities with the Lowest Costs of Housing as Percentage of Income in South Dakota
RELATED REPORTS & OPTIONS
Lowest Housing Costs / Income
South Dakota
Compare Cities
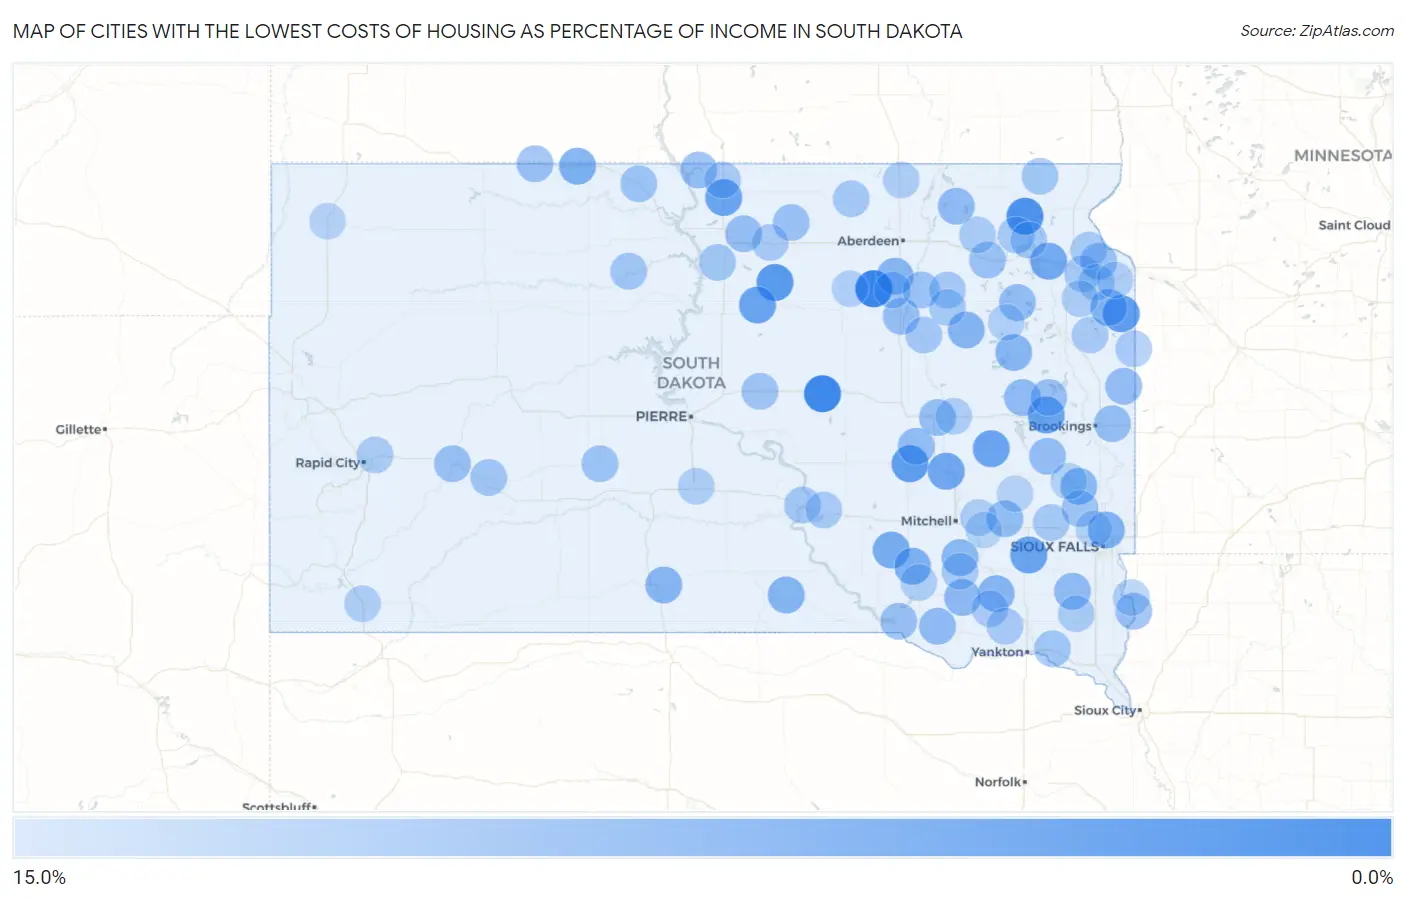
Map of Cities with the Lowest Costs of Housing as Percentage of Income in South Dakota
15.0%
0.0%
Cities with the Lowest Costs of Housing as Percentage of Income in South Dakota
| City | Housing Costs / Income | vs State | vs National | |
| 1. | Chelsea | 3.3% | 16.4%(-13.1)#1 | 20.4%(-17.1)#18 |
| 2. | Ree Heights | 3.8% | 16.4%(-12.7)#2 | 20.4%(-16.6)#27 |
| 3. | Eden | 5.0% | 16.4%(-11.4)#3 | 20.4%(-15.4)#75 |
| 4. | Tolstoy | 5.7% | 16.4%(-10.7)#4 | 20.4%(-14.7)#129 |
| 5. | Revillo | 6.2% | 16.4%(-10.3)#5 | 20.4%(-14.2)#185 |
| 6. | Lane | 6.3% | 16.4%(-10.2)#6 | 20.4%(-14.1)#205 |
| 7. | Mound City | 6.9% | 16.4%(-9.54)#7 | 20.4%(-13.5)#316 |
| 8. | Carthage | 6.9% | 16.4%(-9.54)#8 | 20.4%(-13.5)#317 |
| 9. | Dolton | 6.9% | 16.4%(-9.53)#9 | 20.4%(-13.5)#318 |
| 10. | Hetland | 6.9% | 16.4%(-9.50)#10 | 20.4%(-13.4)#327 |
| 11. | Lebanon | 7.0% | 16.4%(-9.46)#11 | 20.4%(-13.4)#331 |
| 12. | Forestburg | 7.4% | 16.4%(-9.01)#12 | 20.4%(-12.9)#418 |
| 13. | Ortley | 7.6% | 16.4%(-8.80)#13 | 20.4%(-12.7)#475 |
| 14. | Aurora Center | 8.1% | 16.4%(-8.36)#14 | 20.4%(-12.3)#598 |
| 15. | Mcintosh | 8.4% | 16.4%(-8.05)#15 | 20.4%(-12.0)#690 |
| 16. | Corsica | 8.4% | 16.4%(-8.01)#16 | 20.4%(-11.9)#700 |
| 17. | Renner Corner | 8.5% | 16.4%(-7.92)#17 | 20.4%(-11.8)#740 |
| 18. | La Bolt | 8.7% | 16.4%(-7.80)#18 | 20.4%(-11.7)#778 |
| 19. | Raymond | 8.9% | 16.4%(-7.51)#19 | 20.4%(-11.4)#865 |
| 20. | Dallas | 9.0% | 16.4%(-7.46)#20 | 20.4%(-11.4)#887 |
| 21. | White Horse | 9.1% | 16.4%(-7.39)#21 | 20.4%(-11.3)#918 |
| 22. | Olivet | 9.1% | 16.4%(-7.36)#22 | 20.4%(-11.3)#932 |
| 23. | Mansfield | 9.1% | 16.4%(-7.35)#23 | 20.4%(-11.3)#937 |
| 24. | Naples | 9.2% | 16.4%(-7.29)#24 | 20.4%(-11.2)#958 |
| 25. | Brant Lake | 9.2% | 16.4%(-7.26)#25 | 20.4%(-11.2)#973 |
| 26. | Dimock | 9.2% | 16.4%(-7.22)#26 | 20.4%(-11.1)#986 |
| 27. | Tripp | 9.5% | 16.4%(-6.93)#27 | 20.4%(-10.9)#1,140 |
| 28. | Dante | 9.7% | 16.4%(-6.78)#28 | 20.4%(-10.7)#1,214 |
| 29. | Davis | 9.7% | 16.4%(-6.78)#29 | 20.4%(-10.7)#1,216 |
| 30. | Claremont | 9.7% | 16.4%(-6.78)#30 | 20.4%(-10.7)#1,220 |
| 31. | Erwin | 9.7% | 16.4%(-6.72)#31 | 20.4%(-10.6)#1,256 |
| 32. | Wallace | 9.8% | 16.4%(-6.62)#32 | 20.4%(-10.5)#1,323 |
| 33. | Spencer | 9.9% | 16.4%(-6.58)#33 | 20.4%(-10.5)#1,338 |
| 34. | Alpena | 9.9% | 16.4%(-6.55)#34 | 20.4%(-10.5)#1,353 |
| 35. | Astoria | 9.9% | 16.4%(-6.50)#35 | 20.4%(-10.4)#1,379 |
| 36. | Ramona | 10.0% | 16.4%(-6.47)#36 | 20.4%(-10.4)#1,403 |
| 37. | Bushnell | 10.1% | 16.4%(-6.37)#37 | 20.4%(-10.3)#1,464 |
| 38. | Morningside | 10.1% | 16.4%(-6.30)#38 | 20.4%(-10.2)#1,496 |
| 39. | Ashton | 10.2% | 16.4%(-6.27)#39 | 20.4%(-10.2)#1,508 |
| 40. | Pollock | 10.2% | 16.4%(-6.25)#40 | 20.4%(-10.2)#1,525 |
| 41. | Java | 10.2% | 16.4%(-6.23)#41 | 20.4%(-10.2)#1,535 |
| 42. | Pickstown | 10.2% | 16.4%(-6.22)#42 | 20.4%(-10.1)#1,542 |
| 43. | Corona | 10.3% | 16.4%(-6.14)#43 | 20.4%(-10.1)#1,587 |
| 44. | Wasta | 10.3% | 16.4%(-6.13)#44 | 20.4%(-10.1)#1,590 |
| 45. | Hudson | 10.3% | 16.4%(-6.10)#45 | 20.4%(-10.0)#1,615 |
| 46. | Morristown | 10.4% | 16.4%(-6.09)#46 | 20.4%(-10.0)#1,619 |
| 47. | Hosmer | 10.4% | 16.4%(-6.05)#47 | 20.4%(-9.98)#1,648 |
| 48. | Bristol | 10.5% | 16.4%(-5.96)#48 | 20.4%(-9.88)#1,718 |
| 49. | Badger | 10.5% | 16.4%(-5.95)#49 | 20.4%(-9.88)#1,721 |
| 50. | Stephan | 10.5% | 16.4%(-5.90)#50 | 20.4%(-9.83)#1,760 |
| 51. | Brentford | 10.6% | 16.4%(-5.83)#51 | 20.4%(-9.76)#1,815 |
| 52. | Mclaughlin | 10.6% | 16.4%(-5.80)#52 | 20.4%(-9.73)#1,839 |
| 53. | Midland | 10.7% | 16.4%(-5.77)#53 | 20.4%(-9.69)#1,856 |
| 54. | Colton | 10.7% | 16.4%(-5.73)#54 | 20.4%(-9.66)#1,883 |
| 55. | Harrold | 10.8% | 16.4%(-5.61)#55 | 20.4%(-9.54)#1,968 |
| 56. | Quinn | 10.9% | 16.4%(-5.59)#56 | 20.4%(-9.52)#1,986 |
| 57. | Northville | 10.9% | 16.4%(-5.57)#57 | 20.4%(-9.50)#2,000 |
| 58. | Whitehorse | 11.0% | 16.4%(-5.48)#58 | 20.4%(-9.41)#2,067 |
| 59. | Gayville | 11.0% | 16.4%(-5.46)#59 | 20.4%(-9.39)#2,088 |
| 60. | Veblen | 11.0% | 16.4%(-5.43)#60 | 20.4%(-9.36)#2,115 |
| 61. | Akaska | 11.1% | 16.4%(-5.33)#61 | 20.4%(-9.25)#2,183 |
| 62. | Leola | 11.2% | 16.4%(-5.27)#62 | 20.4%(-9.20)#2,221 |
| 63. | Oacoma | 11.2% | 16.4%(-5.27)#63 | 20.4%(-9.20)#2,229 |
| 64. | Roslyn | 11.2% | 16.4%(-5.21)#64 | 20.4%(-9.14)#2,272 |
| 65. | Conde | 11.2% | 16.4%(-5.21)#65 | 20.4%(-9.14)#2,273 |
| 66. | Frankfort | 11.3% | 16.4%(-5.16)#66 | 20.4%(-9.09)#2,323 |
| 67. | Marvin | 11.3% | 16.4%(-5.15)#67 | 20.4%(-9.08)#2,327 |
| 68. | Grenville | 11.3% | 16.4%(-5.12)#68 | 20.4%(-9.05)#2,346 |
| 69. | Turton | 11.4% | 16.4%(-5.05)#69 | 20.4%(-8.98)#2,415 |
| 70. | Montrose | 11.4% | 16.4%(-5.03)#70 | 20.4%(-8.96)#2,436 |
| 71. | Parkston | 11.5% | 16.4%(-4.99)#71 | 20.4%(-8.91)#2,477 |
| 72. | Scotland | 11.5% | 16.4%(-4.97)#72 | 20.4%(-8.90)#2,499 |
| 73. | Pukwana | 11.5% | 16.4%(-4.96)#73 | 20.4%(-8.89)#2,506 |
| 74. | Goodwin | 11.5% | 16.4%(-4.94)#74 | 20.4%(-8.86)#2,523 |
| 75. | Bowdle | 11.5% | 16.4%(-4.93)#75 | 20.4%(-8.86)#2,527 |
| 76. | Herreid | 11.5% | 16.4%(-4.92)#76 | 20.4%(-8.85)#2,540 |
| 77. | Lesterville | 11.5% | 16.4%(-4.90)#77 | 20.4%(-8.83)#2,557 |
| 78. | Wilmot | 11.6% | 16.4%(-4.86)#78 | 20.4%(-8.79)#2,591 |
| 79. | Gary | 11.6% | 16.4%(-4.86)#79 | 20.4%(-8.78)#2,603 |
| 80. | Ashland Heights | 11.7% | 16.4%(-4.77)#80 | 20.4%(-8.70)#2,686 |
| 81. | Centerville | 11.7% | 16.4%(-4.76)#81 | 20.4%(-8.69)#2,697 |
| 82. | Twin Brooks | 11.7% | 16.4%(-4.73)#82 | 20.4%(-8.66)#2,723 |
| 83. | Pierpont | 11.7% | 16.4%(-4.72)#83 | 20.4%(-8.65)#2,738 |
| 84. | Cavour | 11.8% | 16.4%(-4.69)#84 | 20.4%(-8.62)#2,768 |
| 85. | Vivian | 11.8% | 16.4%(-4.69)#85 | 20.4%(-8.61)#2,781 |
| 86. | Fulton | 11.8% | 16.4%(-4.66)#86 | 20.4%(-8.59)#2,808 |
| 87. | Armour | 11.8% | 16.4%(-4.63)#87 | 20.4%(-8.56)#2,842 |
| 88. | Frederick | 11.8% | 16.4%(-4.61)#88 | 20.4%(-8.54)#2,864 |
| 89. | South Shore | 11.9% | 16.4%(-4.56)#89 | 20.4%(-8.49)#2,920 |
| 90. | Oelrichs | 11.9% | 16.4%(-4.52)#90 | 20.4%(-8.45)#2,962 |
| 91. | Garden City | 12.0% | 16.4%(-4.45)#91 | 20.4%(-8.38)#3,033 |
| 92. | Fairview | 12.0% | 16.4%(-4.42)#92 | 20.4%(-8.35)#3,057 |
| 93. | Milbank | 12.0% | 16.4%(-4.40)#93 | 20.4%(-8.33)#3,069 |
| 94. | Cresbard | 12.1% | 16.4%(-4.36)#94 | 20.4%(-8.29)#3,107 |
| 95. | Lake Madison | 12.2% | 16.4%(-4.23)#95 | 20.4%(-8.16)#3,264 |
| 96. | Crooks | 12.3% | 16.4%(-4.15)#96 | 20.4%(-8.08)#3,347 |
| 97. | Alexandria | 12.4% | 16.4%(-4.04)#97 | 20.4%(-7.97)#3,473 |
| 98. | Horse Creek | 12.4% | 16.4%(-4.03)#98 | 20.4%(-7.95)#3,490 |
| 99. | Buffalo | 12.4% | 16.4%(-4.02)#99 | 20.4%(-7.94)#3,500 |
| 100. | Canova | 12.4% | 16.4%(-4.02)#100 | 20.4%(-7.94)#3,502 |
Common Questions
What are the Top 10 Cities with the Lowest Costs of Housing as Percentage of Income in South Dakota?
Top 10 Cities with the Lowest Costs of Housing as Percentage of Income in South Dakota are:
#1
3.3%
#2
3.8%
#3
5.0%
#4
5.7%
#5
6.2%
#6
6.3%
#7
6.9%
#8
6.9%
#9
6.9%
#10
6.9%
What city has the Lowest Costs of Housing as Percentage of Income in South Dakota?
Chelsea has the Lowest Costs of Housing as Percentage of Income in South Dakota with 3.3%.
What is the Average Housing Costs as Percentage of Income in the State of South Dakota?
Average Housing Costs as Percentage of Income in South Dakota is 16.4%.
What is the Average Housing Costs as Percentage of Income in the United States?
Average Housing Costs as Percentage of Income in the United States is 20.4%.