Cities with the Lowest Costs of Housing as Percentage of Income in West Virginia
RELATED REPORTS & OPTIONS
Lowest Housing Costs / Income
West Virginia
Compare Cities
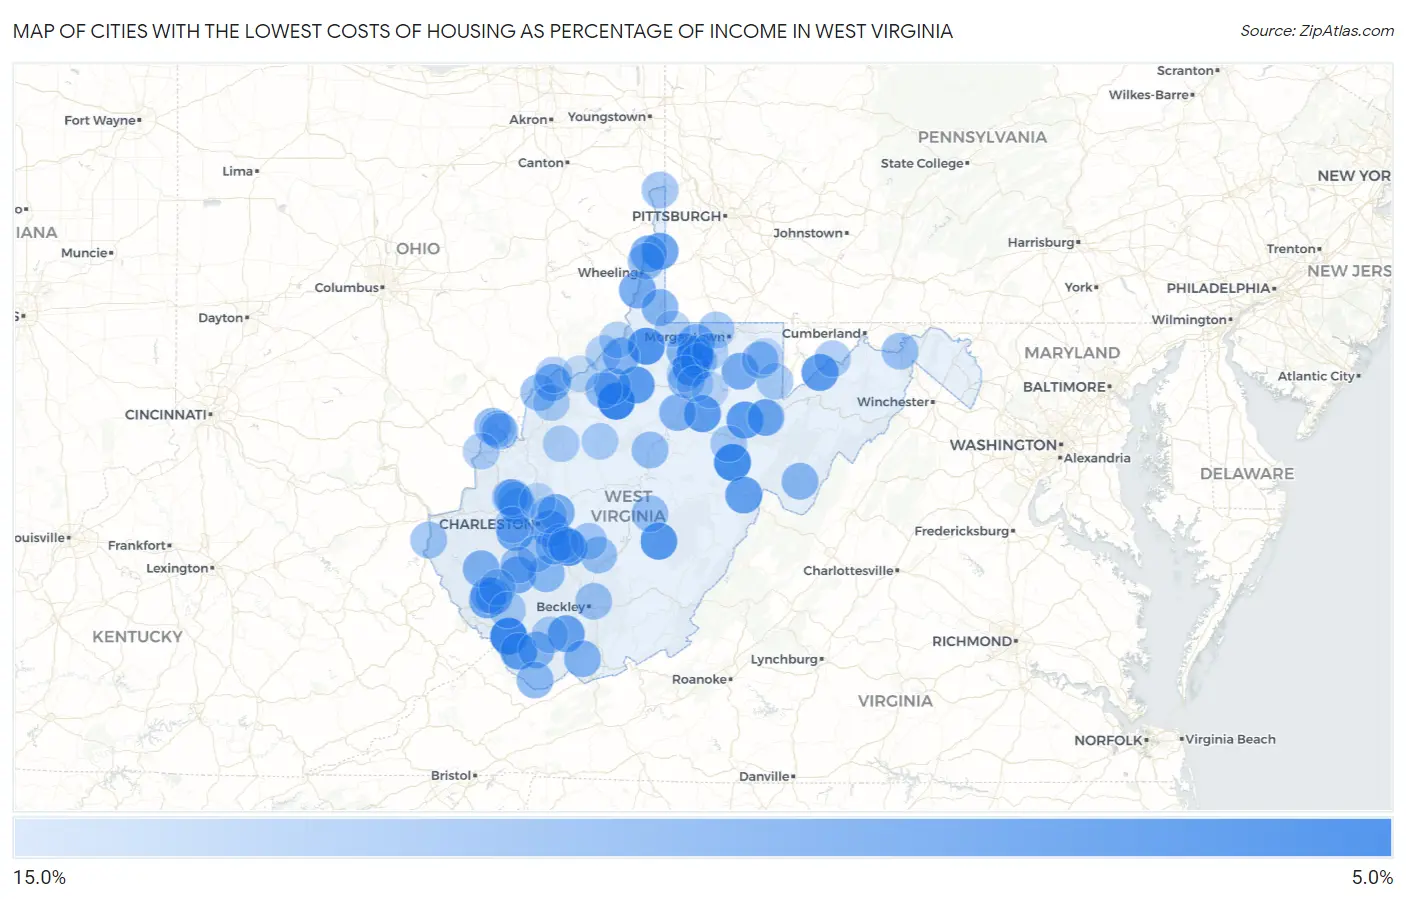
Map of Cities with the Lowest Costs of Housing as Percentage of Income in West Virginia
15.0%
0.0%
Cities with the Lowest Costs of Housing as Percentage of Income in West Virginia
| City | Housing Costs / Income | vs State | vs National | |
| 1. | Pullman | 5.1% | 15.3%(-10.3)#1 | 20.4%(-15.3)#81 |
| 2. | Greenville | 5.2% | 15.3%(-10.1)#2 | 20.4%(-15.2)#96 |
| 3. | Gilbert Creek | 5.4% | 15.3%(-9.97)#3 | 20.4%(-15.0)#102 |
| 4. | Idamay | 5.8% | 15.3%(-9.56)#4 | 20.4%(-14.6)#140 |
| 5. | Valley Bend | 5.9% | 15.3%(-9.42)#5 | 20.4%(-14.4)#158 |
| 6. | Pine Grove | 6.6% | 15.3%(-8.73)#6 | 20.4%(-13.8)#260 |
| 7. | Clifton | 7.1% | 15.3%(-8.27)#7 | 20.4%(-13.3)#347 |
| 8. | Enterprise | 7.1% | 15.3%(-8.25)#8 | 20.4%(-13.3)#357 |
| 9. | Handley | 7.1% | 15.3%(-8.23)#9 | 20.4%(-13.3)#361 |
| 10. | Fenwick | 7.2% | 15.3%(-8.14)#10 | 20.4%(-13.2)#374 |
| 11. | Montrose | 7.5% | 15.3%(-7.84)#11 | 20.4%(-12.9)#435 |
| 12. | West Union | 7.5% | 15.3%(-7.83)#12 | 20.4%(-12.9)#438 |
| 13. | Century | 7.7% | 15.3%(-7.68)#13 | 20.4%(-12.7)#478 |
| 14. | Iaeger | 7.7% | 15.3%(-7.67)#14 | 20.4%(-12.7)#480 |
| 15. | Elk Garden | 7.7% | 15.3%(-7.60)#15 | 20.4%(-12.6)#501 |
| 16. | Coal Fork | 8.2% | 15.3%(-7.18)#16 | 20.4%(-12.2)#615 |
| 17. | Durbin | 8.2% | 15.3%(-7.17)#17 | 20.4%(-12.2)#616 |
| 18. | Mullens | 8.3% | 15.3%(-7.02)#18 | 20.4%(-12.1)#659 |
| 19. | Bethany | 8.5% | 15.3%(-6.88)#19 | 20.4%(-11.9)#713 |
| 20. | Holden | 8.9% | 15.3%(-6.41)#20 | 20.4%(-11.4)#860 |
| 21. | Alum Creek | 8.9% | 15.3%(-6.40)#21 | 20.4%(-11.4)#872 |
| 22. | Glen Dale | 9.3% | 15.3%(-6.07)#22 | 20.4%(-11.1)#1,007 |
| 23. | Greenview | 9.3% | 15.3%(-6.02)#23 | 20.4%(-11.1)#1,039 |
| 24. | Mount Gay Shamrock | 9.4% | 15.3%(-5.99)#24 | 20.4%(-11.0)#1,050 |
| 25. | Reynoldsville | 9.4% | 15.3%(-5.96)#25 | 20.4%(-11.0)#1,067 |
| 26. | Newburg | 9.4% | 15.3%(-5.96)#26 | 20.4%(-11.0)#1,069 |
| 27. | Elkview | 9.6% | 15.3%(-5.71)#27 | 20.4%(-10.7)#1,202 |
| 28. | Pennsboro | 9.7% | 15.3%(-5.66)#28 | 20.4%(-10.7)#1,227 |
| 29. | Windsor Heights | 9.7% | 15.3%(-5.65)#29 | 20.4%(-10.7)#1,232 |
| 30. | Fairview | 9.9% | 15.3%(-5.46)#30 | 20.4%(-10.5)#1,344 |
| 31. | Hometown | 9.9% | 15.3%(-5.45)#31 | 20.4%(-10.5)#1,348 |
| 32. | North Hills | 10.0% | 15.3%(-5.35)#32 | 20.4%(-10.4)#1,409 |
| 33. | Harts | 10.0% | 15.3%(-5.34)#33 | 20.4%(-10.4)#1,417 |
| 34. | Jane Lew | 10.2% | 15.3%(-5.14)#34 | 20.4%(-10.2)#1,529 |
| 35. | Matoaka | 10.3% | 15.3%(-5.06)#35 | 20.4%(-10.1)#1,574 |
| 36. | Mannington | 10.3% | 15.3%(-5.00)#36 | 20.4%(-10.0)#1,613 |
| 37. | Middlebourne | 10.4% | 15.3%(-4.99)#37 | 20.4%(-10.0)#1,616 |
| 38. | Cameron | 10.5% | 15.3%(-4.88)#38 | 20.4%(-9.92)#1,697 |
| 39. | Hendricks | 10.5% | 15.3%(-4.82)#39 | 20.4%(-9.85)#1,744 |
| 40. | Franklin | 10.6% | 15.3%(-4.76)#40 | 20.4%(-9.79)#1,790 |
| 41. | Davy | 10.6% | 15.3%(-4.75)#41 | 20.4%(-9.78)#1,796 |
| 42. | Sylvester | 10.7% | 15.3%(-4.64)#42 | 20.4%(-9.67)#1,871 |
| 43. | Berwind | 10.9% | 15.3%(-4.47)#43 | 20.4%(-9.51)#1,997 |
| 44. | Ellenboro | 11.1% | 15.3%(-4.26)#44 | 20.4%(-9.29)#2,160 |
| 45. | Mason | 11.1% | 15.3%(-4.25)#45 | 20.4%(-9.28)#2,165 |
| 46. | Kingwood | 11.1% | 15.3%(-4.20)#46 | 20.4%(-9.23)#2,200 |
| 47. | Hepzibah | 11.2% | 15.3%(-4.15)#47 | 20.4%(-9.18)#2,238 |
| 48. | Burnsville | 11.3% | 15.3%(-4.06)#48 | 20.4%(-9.09)#2,320 |
| 49. | Poca | 11.3% | 15.3%(-4.00)#49 | 20.4%(-9.03)#2,374 |
| 50. | Clearview | 11.4% | 15.3%(-3.90)#50 | 20.4%(-8.93)#2,461 |
| 51. | Hollygrove | 11.4% | 15.3%(-3.89)#51 | 20.4%(-8.93)#2,462 |
| 52. | Racine | 11.5% | 15.3%(-3.82)#52 | 20.4%(-8.85)#2,539 |
| 53. | Crooked Creek | 11.5% | 15.3%(-3.80)#53 | 20.4%(-8.83)#2,554 |
| 54. | Ansted | 11.5% | 15.3%(-3.80)#54 | 20.4%(-8.83)#2,559 |
| 55. | Tioga | 11.5% | 15.3%(-3.80)#55 | 20.4%(-8.83)#2,563 |
| 56. | Blennerhassett | 11.6% | 15.3%(-3.76)#56 | 20.4%(-8.79)#2,593 |
| 57. | Verdunville | 11.6% | 15.3%(-3.71)#57 | 20.4%(-8.74)#2,644 |
| 58. | Chelyan | 11.7% | 15.3%(-3.67)#58 | 20.4%(-8.70)#2,681 |
| 59. | Paw Paw | 11.7% | 15.3%(-3.64)#59 | 20.4%(-8.67)#2,708 |
| 60. | Madison | 11.7% | 15.3%(-3.60)#60 | 20.4%(-8.63)#2,757 |
| 61. | Stanaford | 11.8% | 15.3%(-3.58)#61 | 20.4%(-8.61)#2,787 |
| 62. | Prichard | 11.8% | 15.3%(-3.56)#62 | 20.4%(-8.59)#2,812 |
| 63. | Farmington | 11.9% | 15.3%(-3.40)#63 | 20.4%(-8.43)#2,979 |
| 64. | Chester | 12.1% | 15.3%(-3.22)#64 | 20.4%(-8.25)#3,145 |
| 65. | Cedar Grove | 12.1% | 15.3%(-3.21)#65 | 20.4%(-8.25)#3,153 |
| 66. | Belva | 12.1% | 15.3%(-3.20)#66 | 20.4%(-8.23)#3,182 |
| 67. | Monongah | 12.2% | 15.3%(-3.19)#67 | 20.4%(-8.22)#3,192 |
| 68. | Hartford City | 12.2% | 15.3%(-3.15)#68 | 20.4%(-8.19)#3,237 |
| 69. | New Haven | 12.2% | 15.3%(-3.14)#69 | 20.4%(-8.18)#3,246 |
| 70. | Cassville | 12.3% | 15.3%(-3.09)#70 | 20.4%(-8.12)#3,298 |
| 71. | Mitchell Heights | 12.3% | 15.3%(-3.09)#71 | 20.4%(-8.12)#3,302 |
| 72. | Newark | 12.3% | 15.3%(-3.00)#72 | 20.4%(-8.03)#3,400 |
| 73. | Man | 12.3% | 15.3%(-3.00)#73 | 20.4%(-8.03)#3,401 |
| 74. | Bancroft | 12.4% | 15.3%(-2.93)#74 | 20.4%(-7.96)#3,482 |
| 75. | Womelsdorf Coalton | 12.5% | 15.3%(-2.86)#75 | 20.4%(-7.90)#3,565 |
| 76. | Pineville | 12.5% | 15.3%(-2.81)#76 | 20.4%(-7.84)#3,629 |
| 77. | Aurora | 12.5% | 15.3%(-2.79)#77 | 20.4%(-7.83)#3,646 |
| 78. | Piedmont | 12.6% | 15.3%(-2.71)#78 | 20.4%(-7.75)#3,747 |
| 79. | Grantsville | 12.7% | 15.3%(-2.68)#79 | 20.4%(-7.71)#3,790 |
| 80. | Mineralwells | 12.7% | 15.3%(-2.66)#80 | 20.4%(-7.69)#3,810 |
| 81. | Big Chimney | 12.8% | 15.3%(-2.54)#81 | 20.4%(-7.57)#3,947 |
| 82. | Point Pleasant | 12.8% | 15.3%(-2.53)#82 | 20.4%(-7.57)#3,960 |
| 83. | Friendly | 12.9% | 15.3%(-2.48)#83 | 20.4%(-7.51)#4,031 |
| 84. | Boaz | 12.9% | 15.3%(-2.48)#84 | 20.4%(-7.51)#4,034 |
| 85. | Reedy | 12.9% | 15.3%(-2.45)#85 | 20.4%(-7.48)#4,061 |
| 86. | Paden City | 12.9% | 15.3%(-2.41)#86 | 20.4%(-7.45)#4,099 |
| 87. | Malden | 13.1% | 15.3%(-2.23)#87 | 20.4%(-7.27)#4,329 |
| 88. | Winfield | 13.1% | 15.3%(-2.21)#88 | 20.4%(-7.24)#4,363 |
| 89. | Lumberport | 13.2% | 15.3%(-2.16)#89 | 20.4%(-7.19)#4,441 |
| 90. | Hundred | 13.3% | 15.3%(-2.07)#90 | 20.4%(-7.10)#4,579 |
| 91. | Bridgeport | 13.3% | 15.3%(-2.05)#91 | 20.4%(-7.08)#4,598 |
| 92. | Pratt | 13.3% | 15.3%(-2.01)#92 | 20.4%(-7.04)#4,657 |
| 93. | Tornado | 13.4% | 15.3%(-1.99)#93 | 20.4%(-7.02)#4,694 |
| 94. | Rivesville | 13.5% | 15.3%(-1.89)#94 | 20.4%(-6.92)#4,828 |
| 95. | Belmont | 13.5% | 15.3%(-1.83)#95 | 20.4%(-6.86)#4,911 |
| 96. | Sissonville | 13.5% | 15.3%(-1.80)#96 | 20.4%(-6.83)#4,954 |
| 97. | Arthurdale | 13.6% | 15.3%(-1.75)#97 | 20.4%(-6.78)#5,034 |
| 98. | Flemington | 13.7% | 15.3%(-1.66)#98 | 20.4%(-6.69)#5,174 |
| 99. | Albright | 13.7% | 15.3%(-1.63)#99 | 20.4%(-6.66)#5,223 |
| 100. | Hambleton | 13.7% | 15.3%(-1.62)#100 | 20.4%(-6.66)#5,237 |
Common Questions
What are the Top 10 Cities with the Lowest Costs of Housing as Percentage of Income in West Virginia?
Top 10 Cities with the Lowest Costs of Housing as Percentage of Income in West Virginia are:
#1
5.1%
#2
5.4%
#3
5.8%
#4
5.9%
#5
6.6%
#6
7.1%
#7
7.1%
#8
7.2%
#9
7.5%
#10
7.5%
What city has the Lowest Costs of Housing as Percentage of Income in West Virginia?
Pullman has the Lowest Costs of Housing as Percentage of Income in West Virginia with 5.1%.
What is the Average Housing Costs as Percentage of Income in the State of West Virginia?
Average Housing Costs as Percentage of Income in West Virginia is 15.3%.
What is the Average Housing Costs as Percentage of Income in the United States?
Average Housing Costs as Percentage of Income in the United States is 20.4%.