Cities with the Highest Percentage of Native / Alaskan Population in Illinois
RELATED REPORTS & OPTIONS
Native / Alaskan
Illinois
Compare Cities
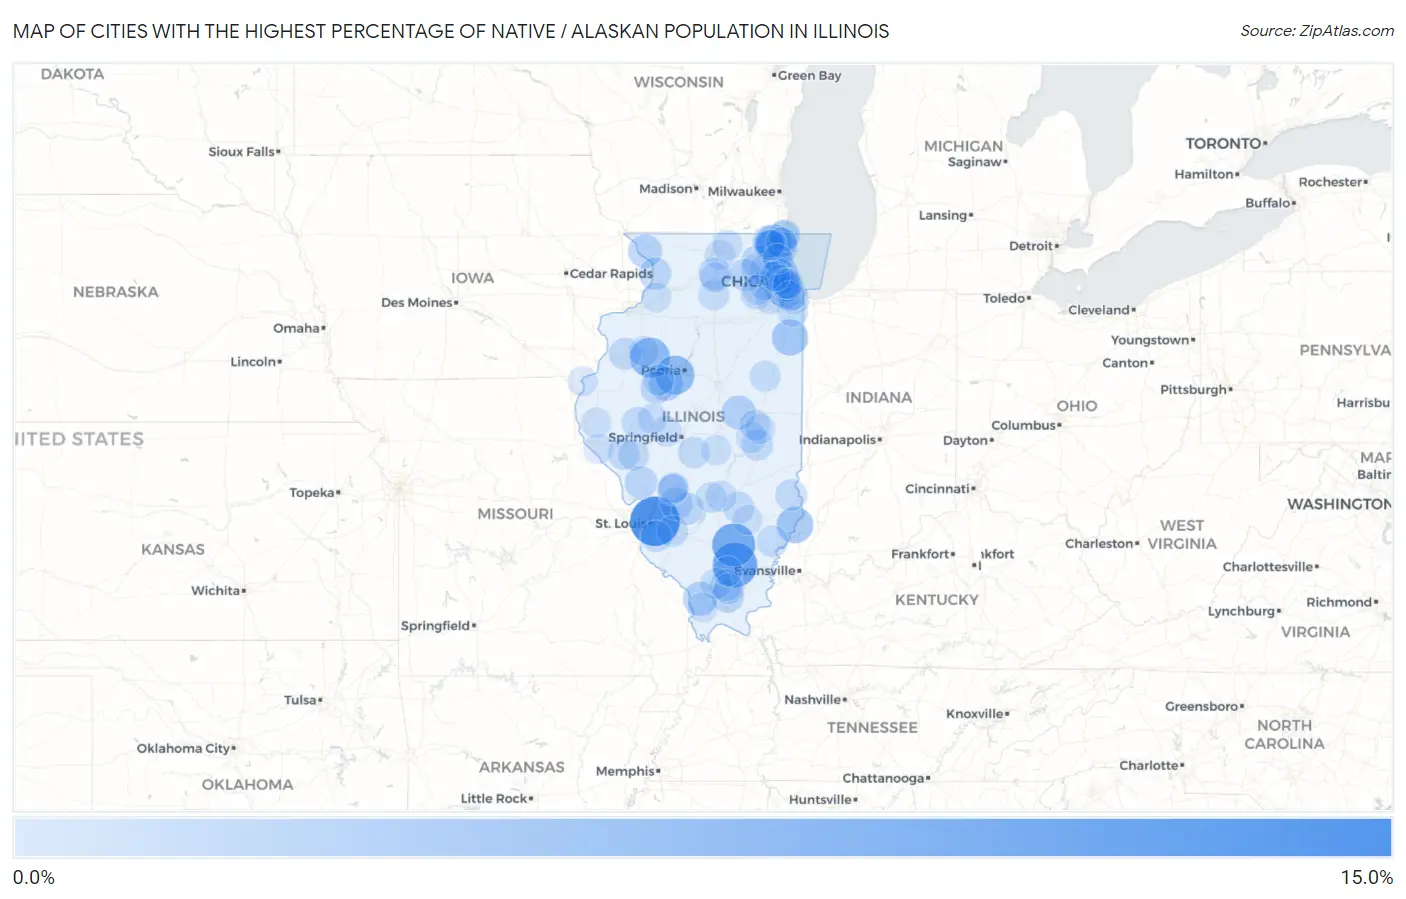
Map of Cities with the Highest Percentage of Native / Alaskan Population in Illinois
0.0%
15.0%
Cities with the Highest Percentage of Native / Alaskan Population in Illinois
| City | Native / Alaskan | vs State | vs National | |
| 1. | Fairmont City | 12.7% | 0.44%(+12.2)#1 | 0.84%(+11.8)#1,228 |
| 2. | Macedonia | 9.5% | 0.44%(+9.09)#2 | 0.84%(+8.68)#1,421 |
| 3. | Ridgewood | 8.7% | 0.44%(+8.23)#3 | 0.84%(+7.83)#1,480 |
| 4. | Bluford | 8.6% | 0.44%(+8.21)#4 | 0.84%(+7.81)#1,481 |
| 5. | Gilson | 6.6% | 0.44%(+6.17)#5 | 0.84%(+5.77)#1,708 |
| 6. | Lake Camelot | 6.1% | 0.44%(+5.63)#6 | 0.84%(+5.23)#1,786 |
| 7. | St Francisville | 4.6% | 0.44%(+4.20)#7 | 0.84%(+3.79)#2,070 |
| 8. | Sun River Terrace | 4.4% | 0.44%(+3.97)#8 | 0.84%(+3.56)#2,123 |
| 9. | Third Lake | 4.3% | 0.44%(+3.85)#9 | 0.84%(+3.44)#2,170 |
| 10. | Banner | 3.3% | 0.44%(+2.85)#10 | 0.84%(+2.45)#2,525 |
| 11. | Alto Pass | 3.1% | 0.44%(+2.71)#11 | 0.84%(+2.31)#2,588 |
| 12. | De Land | 3.1% | 0.44%(+2.71)#12 | 0.84%(+2.30)#2,593 |
| 13. | Indian Head Park | 3.0% | 0.44%(+2.60)#13 | 0.84%(+2.19)#2,651 |
| 14. | Hanover | 2.9% | 0.44%(+2.51)#14 | 0.84%(+2.10)#2,681 |
| 15. | Round Lake Park | 2.7% | 0.44%(+2.26)#15 | 0.84%(+1.86)#2,822 |
| 16. | Gulfport | 2.5% | 0.44%(+2.03)#16 | 0.84%(+1.63)#2,957 |
| 17. | Creal Springs | 2.4% | 0.44%(+1.92)#17 | 0.84%(+1.51)#3,059 |
| 18. | Thomson | 2.3% | 0.44%(+1.82)#18 | 0.84%(+1.42)#3,142 |
| 19. | Alhambra | 2.3% | 0.44%(+1.81)#19 | 0.84%(+1.41)#3,151 |
| 20. | Bryant | 2.2% | 0.44%(+1.78)#20 | 0.84%(+1.38)#3,179 |
| 21. | Kane | 2.2% | 0.44%(+1.77)#21 | 0.84%(+1.36)#3,199 |
| 22. | Hillcrest | 2.2% | 0.44%(+1.75)#22 | 0.84%(+1.34)#3,215 |
| 23. | Carpentersville | 2.1% | 0.44%(+1.71)#23 | 0.84%(+1.30)#3,262 |
| 24. | Franklin Park | 2.0% | 0.44%(+1.58)#24 | 0.84%(+1.18)#3,400 |
| 25. | Hickory Hills | 2.0% | 0.44%(+1.58)#25 | 0.84%(+1.18)#3,403 |
| 26. | Pocahontas | 2.0% | 0.44%(+1.55)#26 | 0.84%(+1.15)#3,426 |
| 27. | Virgil | 1.9% | 0.44%(+1.51)#27 | 0.84%(+1.11)#3,460 |
| 28. | Mundelein | 1.9% | 0.44%(+1.50)#28 | 0.84%(+1.10)#3,475 |
| 29. | Round Lake Heights | 1.9% | 0.44%(+1.50)#29 | 0.84%(+1.09)#3,481 |
| 30. | Monmouth | 1.9% | 0.44%(+1.47)#30 | 0.84%(+1.06)#3,508 |
| 31. | Park City | 1.9% | 0.44%(+1.46)#31 | 0.84%(+1.05)#3,518 |
| 32. | Pittsburg | 1.9% | 0.44%(+1.46)#32 | 0.84%(+1.05)#3,521 |
| 33. | River Grove | 1.9% | 0.44%(+1.43)#33 | 0.84%(+1.03)#3,548 |
| 34. | Milton | 1.9% | 0.44%(+1.42)#34 | 0.84%(+1.02)#3,571 |
| 35. | Robinson | 1.8% | 0.44%(+1.38)#35 | 0.84%(+0.978)#3,618 |
| 36. | Rosemont | 1.7% | 0.44%(+1.30)#36 | 0.84%(+0.892)#3,734 |
| 37. | Iola | 1.7% | 0.44%(+1.29)#37 | 0.84%(+0.883)#3,748 |
| 38. | Beardstown | 1.7% | 0.44%(+1.26)#38 | 0.84%(+0.858)#3,778 |
| 39. | Albion | 1.7% | 0.44%(+1.25)#39 | 0.84%(+0.844)#3,795 |
| 40. | Bulpitt | 1.7% | 0.44%(+1.24)#40 | 0.84%(+0.839)#3,801 |
| 41. | Mascoutah | 1.7% | 0.44%(+1.23)#41 | 0.84%(+0.825)#3,831 |
| 42. | Boulder Hill | 1.7% | 0.44%(+1.22)#42 | 0.84%(+0.813)#3,852 |
| 43. | Millstadt | 1.6% | 0.44%(+1.20)#43 | 0.84%(+0.794)#3,884 |
| 44. | Arcola | 1.6% | 0.44%(+1.18)#44 | 0.84%(+0.773)#3,920 |
| 45. | Wheeling | 1.5% | 0.44%(+1.11)#45 | 0.84%(+0.704)#4,015 |
| 46. | Herrin | 1.5% | 0.44%(+1.10)#46 | 0.84%(+0.698)#4,028 |
| 47. | North Chicago | 1.5% | 0.44%(+1.07)#47 | 0.84%(+0.664)#4,083 |
| 48. | Winthrop Harbor | 1.5% | 0.44%(+1.03)#48 | 0.84%(+0.623)#4,142 |
| 49. | Glasgow | 1.4% | 0.44%(+1.00)#49 | 0.84%(+0.597)#4,183 |
| 50. | Roberts | 1.4% | 0.44%(+0.979)#50 | 0.84%(+0.575)#4,220 |
| 51. | Canton | 1.4% | 0.44%(+0.975)#51 | 0.84%(+0.571)#4,225 |
| 52. | Zion | 1.4% | 0.44%(+0.963)#52 | 0.84%(+0.559)#4,247 |
| 53. | Park Forest | 1.4% | 0.44%(+0.926)#53 | 0.84%(+0.522)#4,319 |
| 54. | Bensenville | 1.4% | 0.44%(+0.923)#54 | 0.84%(+0.519)#4,328 |
| 55. | Summit | 1.4% | 0.44%(+0.922)#55 | 0.84%(+0.518)#4,333 |
| 56. | Dixmoor | 1.4% | 0.44%(+0.921)#56 | 0.84%(+0.517)#4,334 |
| 57. | Glendale Heights | 1.4% | 0.44%(+0.919)#57 | 0.84%(+0.515)#4,339 |
| 58. | Brownstown | 1.3% | 0.44%(+0.898)#58 | 0.84%(+0.494)#4,376 |
| 59. | Romeoville | 1.3% | 0.44%(+0.881)#59 | 0.84%(+0.477)#4,400 |
| 60. | Streamwood | 1.3% | 0.44%(+0.869)#60 | 0.84%(+0.465)#4,424 |
| 61. | Vandalia | 1.3% | 0.44%(+0.817)#61 | 0.84%(+0.413)#4,528 |
| 62. | Garrett | 1.3% | 0.44%(+0.812)#62 | 0.84%(+0.408)#4,538 |
| 63. | Warrenville | 1.2% | 0.44%(+0.810)#63 | 0.84%(+0.406)#4,540 |
| 64. | Compton | 1.2% | 0.44%(+0.777)#64 | 0.84%(+0.373)#4,615 |
| 65. | Elgin | 1.2% | 0.44%(+0.767)#65 | 0.84%(+0.363)#4,631 |
| 66. | Pleasant Plains | 1.2% | 0.44%(+0.767)#66 | 0.84%(+0.363)#4,632 |
| 67. | Sadorus | 1.2% | 0.44%(+0.760)#67 | 0.84%(+0.356)#4,649 |
| 68. | Cicero | 1.2% | 0.44%(+0.760)#68 | 0.84%(+0.356)#4,651 |
| 69. | Round Lake Beach | 1.2% | 0.44%(+0.741)#69 | 0.84%(+0.337)#4,687 |
| 70. | Waukegan | 1.2% | 0.44%(+0.740)#70 | 0.84%(+0.336)#4,692 |
| 71. | Crab Orchard | 1.2% | 0.44%(+0.721)#71 | 0.84%(+0.317)#4,746 |
| 72. | Round Lake | 1.1% | 0.44%(+0.708)#72 | 0.84%(+0.304)#4,782 |
| 73. | Merrionette Park | 1.1% | 0.44%(+0.704)#73 | 0.84%(+0.300)#4,797 |
| 74. | Pesotum | 1.1% | 0.44%(+0.697)#74 | 0.84%(+0.293)#4,810 |
| 75. | East Galesburg | 1.1% | 0.44%(+0.695)#75 | 0.84%(+0.291)#4,814 |
| 76. | Bonnie Brae | 1.1% | 0.44%(+0.684)#76 | 0.84%(+0.280)#4,840 |
| 77. | Forest View | 1.1% | 0.44%(+0.676)#77 | 0.84%(+0.272)#4,856 |
| 78. | Hainesville | 1.1% | 0.44%(+0.662)#78 | 0.84%(+0.258)#4,889 |
| 79. | Cherry Valley | 1.1% | 0.44%(+0.647)#79 | 0.84%(+0.243)#4,948 |
| 80. | Rochelle | 1.1% | 0.44%(+0.635)#80 | 0.84%(+0.231)#4,983 |
| 81. | Aurora | 1.1% | 0.44%(+0.632)#81 | 0.84%(+0.228)#4,990 |
| 82. | Benld | 1.0% | 0.44%(+0.608)#82 | 0.84%(+0.203)#5,044 |
| 83. | Poplar Grove | 1.0% | 0.44%(+0.599)#83 | 0.84%(+0.195)#5,076 |
| 84. | Sawyerville | 1.0% | 0.44%(+0.567)#84 | 0.84%(+0.163)#5,177 |
| 85. | Chandlerville | 0.99% | 0.44%(+0.554)#85 | 0.84%(+0.150)#5,214 |
| 86. | Eagarville | 0.98% | 0.44%(+0.543)#86 | 0.84%(+0.139)#5,250 |
| 87. | Moweaqua | 0.98% | 0.44%(+0.538)#87 | 0.84%(+0.134)#5,267 |
| 88. | Flora | 0.96% | 0.44%(+0.520)#88 | 0.84%(+0.116)#5,333 |
| 89. | Berkeley | 0.95% | 0.44%(+0.509)#89 | 0.84%(+0.105)#5,373 |
| 90. | Columbus | 0.94% | 0.44%(+0.506)#90 | 0.84%(+0.102)#5,384 |
| 91. | Riverside | 0.94% | 0.44%(+0.506)#91 | 0.84%(+0.102)#5,387 |
| 92. | Erie | 0.94% | 0.44%(+0.502)#92 | 0.84%(+0.098)#5,396 |
| 93. | Nauvoo | 0.93% | 0.44%(+0.492)#93 | 0.84%(+0.088)#5,426 |
| 94. | Alsip | 0.91% | 0.44%(+0.474)#94 | 0.84%(+0.070)#5,480 |
| 95. | Jonesboro | 0.88% | 0.44%(+0.443)#95 | 0.84%(+0.039)#5,611 |
| 96. | New Canton | 0.88% | 0.44%(+0.440)#96 | 0.84%(+0.036)#5,621 |
| 97. | Buffalo Grove | 0.87% | 0.44%(+0.429)#97 | 0.84%(+0.025)#5,661 |
| 98. | Berwyn | 0.86% | 0.44%(+0.420)#98 | 0.84%(+0.016)#5,697 |
| 99. | Hanaford | 0.85% | 0.44%(+0.417)#99 | 0.84%(+0.013)#5,715 |
| 100. | Addison | 0.85% | 0.44%(+0.414)#100 | 0.84%(+0.010)#5,722 |
Common Questions
What are the Top 10 Cities with the Highest Percentage of Native / Alaskan Population in Illinois?
Top 10 Cities with the Highest Percentage of Native / Alaskan Population in Illinois are:
#1
12.7%
#2
9.5%
#3
8.6%
#4
6.6%
#5
6.1%
#6
4.6%
#7
4.4%
#8
4.3%
#9
3.3%
#10
3.1%
What city has the Highest Percentage of Native / Alaskan Population in Illinois?
Fairmont City has the Highest Percentage of Native / Alaskan Population in Illinois with 12.7%.
What is the Percentage of Native / Alaskan Population in the State of Illinois?
Percentage of Native / Alaskan Population in Illinois is 0.44%.
What is the Percentage of Native / Alaskan Population in the United States?
Percentage of Native / Alaskan Population in the United States is 0.84%.