Cities with the Highest Percentage of Native / Alaskan Population in Tennessee
RELATED REPORTS & OPTIONS
Native / Alaskan
Tennessee
Compare Cities
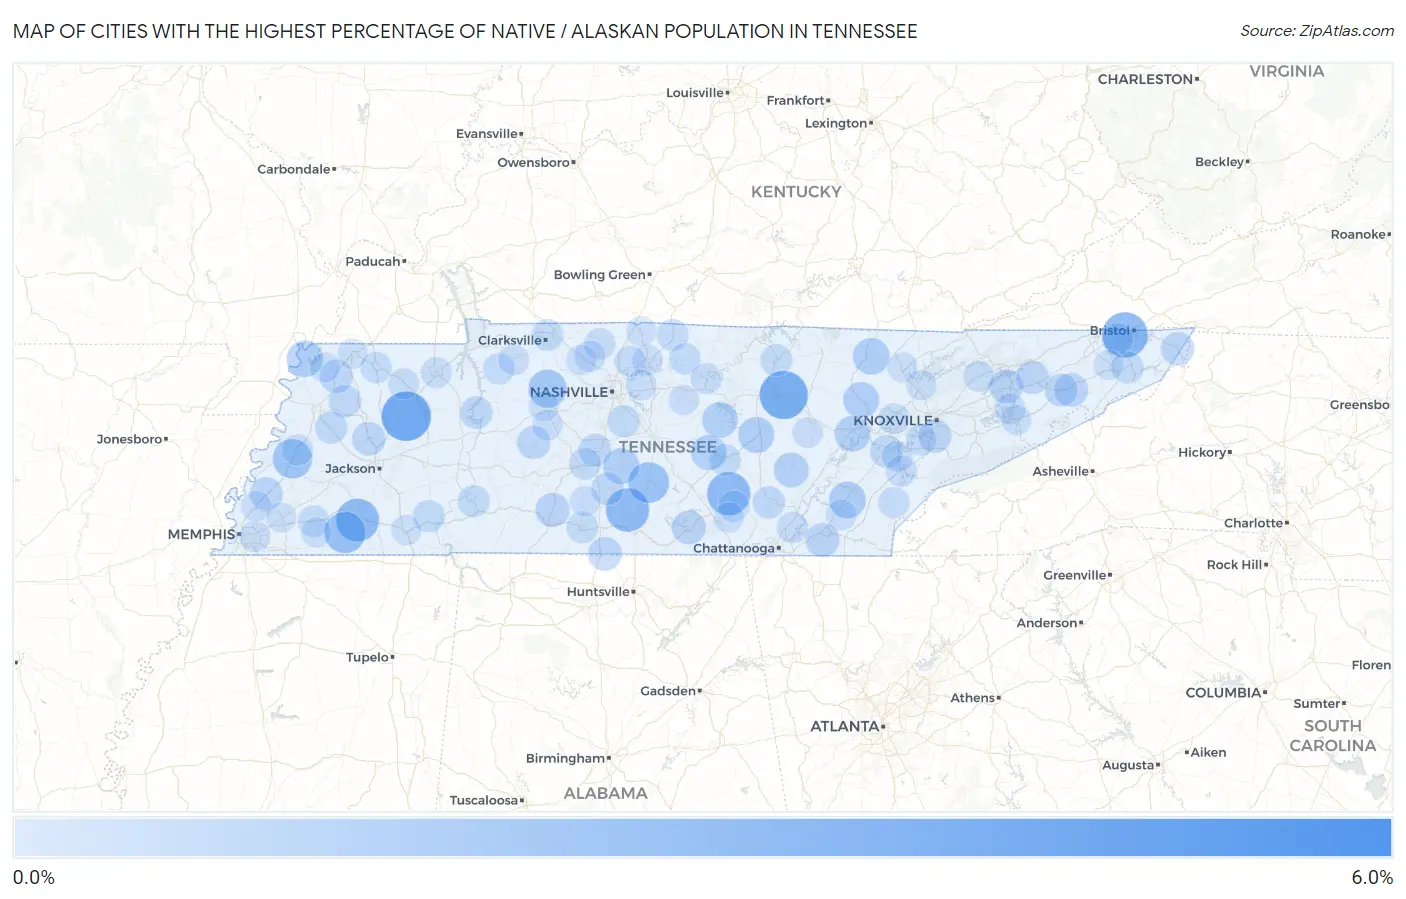
Map of Cities with the Highest Percentage of Native / Alaskan Population in Tennessee
0.0%
6.0%
Cities with the Highest Percentage of Native / Alaskan Population in Tennessee
| City | Native / Alaskan | vs State | vs National | |
| 1. | Nixon | 5.2% | 0.20%(+5.04)#1 | 0.84%(+4.40)#1,932 |
| 2. | Mclemoresville | 3.7% | 0.20%(+3.45)#2 | 0.84%(+2.81)#2,385 |
| 3. | Monterey | 3.4% | 0.20%(+3.21)#3 | 0.84%(+2.58)#2,467 |
| 4. | Walnut Hill | 2.9% | 0.20%(+2.70)#4 | 0.84%(+2.07)#2,703 |
| 5. | Altamont | 2.5% | 0.20%(+2.34)#5 | 0.84%(+1.70)#2,900 |
| 6. | Petersburg | 2.5% | 0.20%(+2.31)#6 | 0.84%(+1.68)#2,918 |
| 7. | Bolivar | 2.5% | 0.20%(+2.26)#7 | 0.84%(+1.62)#2,962 |
| 8. | Hickory Valley | 2.2% | 0.20%(+1.95)#8 | 0.84%(+1.32)#3,243 |
| 9. | Shelbyville | 2.1% | 0.20%(+1.86)#9 | 0.84%(+1.22)#3,350 |
| 10. | Henning | 1.8% | 0.20%(+1.61)#10 | 0.84%(+0.977)#3,621 |
| 11. | Charlotte | 1.6% | 0.20%(+1.40)#11 | 0.84%(+0.761)#3,933 |
| 12. | Riceville | 1.3% | 0.20%(+1.14)#12 | 0.84%(+0.507)#4,357 |
| 13. | Huntsville | 1.3% | 0.20%(+1.12)#13 | 0.84%(+0.482)#4,389 |
| 14. | Tiptonville | 1.3% | 0.20%(+1.07)#14 | 0.84%(+0.437)#4,482 |
| 15. | Chapel Hill | 1.2% | 0.20%(+1.03)#15 | 0.84%(+0.388)#4,576 |
| 16. | Doyle | 1.2% | 0.20%(+1.01)#16 | 0.84%(+0.367)#4,626 |
| 17. | Wartburg | 1.2% | 0.20%(+0.999)#17 | 0.84%(+0.361)#4,634 |
| 18. | Rockwood | 1.2% | 0.20%(+0.948)#18 | 0.84%(+0.311)#4,763 |
| 19. | Smithville | 1.1% | 0.20%(+0.943)#19 | 0.84%(+0.305)#4,778 |
| 20. | Centertown | 1.1% | 0.20%(+0.879)#20 | 0.84%(+0.241)#4,951 |
| 21. | Prospect | 1.1% | 0.20%(+0.871)#21 | 0.84%(+0.234)#4,978 |
| 22. | Pikeville | 1.0% | 0.20%(+0.819)#22 | 0.84%(+0.182)#5,120 |
| 23. | Oak Grove Cdp Washington County | 1.00% | 0.20%(+0.791)#23 | 0.84%(+0.153)#5,201 |
| 24. | South Cleveland | 0.88% | 0.20%(+0.673)#24 | 0.84%(+0.035)#5,626 |
| 25. | Ethridge | 0.87% | 0.20%(+0.670)#25 | 0.84%(+0.033)#5,637 |
| 26. | Morristown | 0.85% | 0.20%(+0.643)#26 | 0.84%(+0.006)#5,736 |
| 27. | Winchester | 0.84% | 0.20%(+0.632)#27 | 0.84%(-0.006)#5,786 |
| 28. | Ardmore | 0.81% | 0.20%(+0.609)#28 | 0.84%(-0.029)#5,878 |
| 29. | Tusculum | 0.80% | 0.20%(+0.593)#29 | 0.84%(-0.044)#5,926 |
| 30. | Humboldt | 0.79% | 0.20%(+0.586)#30 | 0.84%(-0.052)#5,962 |
| 31. | Mountain City | 0.75% | 0.20%(+0.547)#31 | 0.84%(-0.090)#6,129 |
| 32. | Obion | 0.75% | 0.20%(+0.547)#32 | 0.84%(-0.091)#6,131 |
| 33. | Centerville | 0.74% | 0.20%(+0.536)#33 | 0.84%(-0.102)#6,171 |
| 34. | Rockford | 0.71% | 0.20%(+0.503)#34 | 0.84%(-0.135)#6,296 |
| 35. | Bulls Gap | 0.69% | 0.20%(+0.482)#35 | 0.84%(-0.156)#6,398 |
| 36. | Munford | 0.68% | 0.20%(+0.473)#36 | 0.84%(-0.165)#6,434 |
| 37. | Greeneville | 0.67% | 0.20%(+0.462)#37 | 0.84%(-0.175)#6,481 |
| 38. | New Johnsonville | 0.65% | 0.20%(+0.447)#38 | 0.84%(-0.191)#6,561 |
| 39. | Yorkville | 0.64% | 0.20%(+0.439)#39 | 0.84%(-0.198)#6,602 |
| 40. | Lewisburg | 0.63% | 0.20%(+0.426)#40 | 0.84%(-0.211)#6,671 |
| 41. | Spring Hill | 0.63% | 0.20%(+0.424)#41 | 0.84%(-0.214)#6,686 |
| 42. | Dunlap | 0.62% | 0.20%(+0.421)#42 | 0.84%(-0.217)#6,697 |
| 43. | Loudon | 0.61% | 0.20%(+0.406)#43 | 0.84%(-0.232)#6,780 |
| 44. | Friendship | 0.60% | 0.20%(+0.391)#44 | 0.84%(-0.246)#6,857 |
| 45. | Adamsville | 0.56% | 0.20%(+0.353)#45 | 0.84%(-0.285)#7,092 |
| 46. | Nolensville | 0.55% | 0.20%(+0.350)#46 | 0.84%(-0.288)#7,110 |
| 47. | Elizabethton | 0.55% | 0.20%(+0.346)#47 | 0.84%(-0.292)#7,140 |
| 48. | Clifton | 0.53% | 0.20%(+0.330)#48 | 0.84%(-0.308)#7,228 |
| 49. | Livingston | 0.51% | 0.20%(+0.306)#49 | 0.84%(-0.331)#7,363 |
| 50. | Lynchburg | 0.50% | 0.20%(+0.299)#50 | 0.84%(-0.338)#7,411 |
| 51. | Columbia | 0.49% | 0.20%(+0.283)#51 | 0.84%(-0.354)#7,514 |
| 52. | Mcminnville | 0.49% | 0.20%(+0.283)#52 | 0.84%(-0.355)#7,515 |
| 53. | Westmoreland | 0.48% | 0.20%(+0.276)#53 | 0.84%(-0.362)#7,565 |
| 54. | Pulaski | 0.47% | 0.20%(+0.266)#54 | 0.84%(-0.372)#7,634 |
| 55. | Clarksville | 0.46% | 0.20%(+0.255)#55 | 0.84%(-0.382)#7,718 |
| 56. | Somerville | 0.44% | 0.20%(+0.239)#56 | 0.84%(-0.398)#7,821 |
| 57. | Blountville | 0.43% | 0.20%(+0.225)#57 | 0.84%(-0.413)#7,920 |
| 58. | Tennessee Ridge | 0.43% | 0.20%(+0.225)#58 | 0.84%(-0.413)#7,921 |
| 59. | Martin | 0.42% | 0.20%(+0.212)#59 | 0.84%(-0.426)#8,020 |
| 60. | Hartsville Trousdale County | 0.41% | 0.20%(+0.201)#60 | 0.84%(-0.436)#8,098 |
| 61. | Ripley | 0.40% | 0.20%(+0.194)#61 | 0.84%(-0.444)#8,162 |
| 62. | Middle Valley | 0.40% | 0.20%(+0.192)#62 | 0.84%(-0.446)#8,182 |
| 63. | Tellico Plains | 0.39% | 0.20%(+0.188)#63 | 0.84%(-0.449)#8,210 |
| 64. | Springfield | 0.38% | 0.20%(+0.174)#64 | 0.84%(-0.463)#8,332 |
| 65. | Paris | 0.37% | 0.20%(+0.165)#65 | 0.84%(-0.473)#8,421 |
| 66. | Vonore | 0.35% | 0.20%(+0.143)#66 | 0.84%(-0.495)#8,600 |
| 67. | Gleason | 0.33% | 0.20%(+0.131)#67 | 0.84%(-0.507)#8,740 |
| 68. | Coopertown | 0.33% | 0.20%(+0.127)#68 | 0.84%(-0.511)#8,787 |
| 69. | Oak Ridge | 0.33% | 0.20%(+0.123)#69 | 0.84%(-0.515)#8,823 |
| 70. | Carthage | 0.33% | 0.20%(+0.122)#70 | 0.84%(-0.516)#8,827 |
| 71. | Coalmont | 0.33% | 0.20%(+0.122)#71 | 0.84%(-0.516)#8,829 |
| 72. | Rutledge | 0.32% | 0.20%(+0.119)#72 | 0.84%(-0.519)#8,858 |
| 73. | Baneberry | 0.32% | 0.20%(+0.119)#73 | 0.84%(-0.519)#8,860 |
| 74. | Tellico Village | 0.32% | 0.20%(+0.117)#74 | 0.84%(-0.520)#8,871 |
| 75. | Louisville | 0.32% | 0.20%(+0.117)#75 | 0.84%(-0.520)#8,875 |
| 76. | Shackle Island | 0.32% | 0.20%(+0.116)#76 | 0.84%(-0.522)#8,889 |
| 77. | Charleston | 0.31% | 0.20%(+0.108)#77 | 0.84%(-0.530)#8,976 |
| 78. | Memphis | 0.31% | 0.20%(+0.102)#78 | 0.84%(-0.536)#9,040 |
| 79. | Gallatin | 0.30% | 0.20%(+0.101)#79 | 0.84%(-0.537)#9,052 |
| 80. | Mount Juliet | 0.29% | 0.20%(+0.087)#80 | 0.84%(-0.551)#9,209 |
| 81. | Lyles | 0.28% | 0.20%(+0.079)#81 | 0.84%(-0.559)#9,306 |
| 82. | Cumberland City | 0.28% | 0.20%(+0.072)#82 | 0.84%(-0.566)#9,386 |
| 83. | Millington | 0.27% | 0.20%(+0.061)#83 | 0.84%(-0.576)#9,488 |
| 84. | Lake Tansi | 0.26% | 0.20%(+0.060)#84 | 0.84%(-0.578)#9,512 |
| 85. | Lynnville | 0.26% | 0.20%(+0.058)#85 | 0.84%(-0.580)#9,537 |
| 86. | Norris | 0.25% | 0.20%(+0.047)#86 | 0.84%(-0.590)#9,632 |
| 87. | Watertown | 0.24% | 0.20%(+0.040)#87 | 0.84%(-0.597)#9,707 |
| 88. | Caryville | 0.23% | 0.20%(+0.025)#88 | 0.84%(-0.612)#9,913 |
| 89. | Union City | 0.23% | 0.20%(+0.022)#89 | 0.84%(-0.616)#9,958 |
| 90. | Pleasant View | 0.22% | 0.20%(+0.019)#90 | 0.84%(-0.619)#10,012 |
| 91. | Newport | 0.22% | 0.20%(+0.015)#91 | 0.84%(-0.623)#10,055 |
| 92. | Portland | 0.21% | 0.20%(+0.009)#92 | 0.84%(-0.629)#10,120 |
| 93. | Hampton | 0.21% | 0.20%(+0.008)#93 | 0.84%(-0.630)#10,133 |
| 94. | Selmer | 0.20% | 0.20%(-0.001)#94 | 0.84%(-0.639)#10,225 |
| 95. | Arlington | 0.20% | 0.20%(-0.002)#95 | 0.84%(-0.639)#10,234 |
| 96. | Tracy City | 0.20% | 0.20%(-0.005)#96 | 0.84%(-0.642)#10,288 |
| 97. | Hornbeak | 0.20% | 0.20%(-0.005)#97 | 0.84%(-0.642)#10,290 |
| 98. | Johnson City | 0.20% | 0.20%(-0.007)#98 | 0.84%(-0.645)#10,327 |
| 99. | Dickson | 0.19% | 0.20%(-0.011)#99 | 0.84%(-0.648)#10,376 |
| 100. | Williston | 0.19% | 0.20%(-0.015)#100 | 0.84%(-0.653)#10,433 |
Common Questions
What are the Top 10 Cities with the Highest Percentage of Native / Alaskan Population in Tennessee?
Top 10 Cities with the Highest Percentage of Native / Alaskan Population in Tennessee are:
#1
3.7%
#2
3.4%
#3
2.9%
#4
2.5%
#5
2.5%
#6
2.5%
#7
2.2%
#8
2.1%
#9
1.8%
#10
1.6%
What city has the Highest Percentage of Native / Alaskan Population in Tennessee?
McLemoresville has the Highest Percentage of Native / Alaskan Population in Tennessee with 3.7%.
What is the Percentage of Native / Alaskan Population in the State of Tennessee?
Percentage of Native / Alaskan Population in Tennessee is 0.20%.
What is the Percentage of Native / Alaskan Population in the United States?
Percentage of Native / Alaskan Population in the United States is 0.84%.