Cities with the Highest Percentage of Japanese Population in Georgia

RELATED REPORTS & OPTIONS

Japanese
Population
Families and Households
Female Fertility
Female Fertility (Unmarried)
Race (Community Size)
Race (Percentage)
Ancestry (Community Size)
AfghanAfricanAlaska NativeAlaskan AthabascanAlbanianAleutAlsatianAmericanApacheArabArapahoArgentineanArmenianAssyrian / Chaldean / SyriacAustralianAustrianBahamianBangladeshiBarbadianBasqueBelgianBelizeanBermudanBhutaneseBlackfeetBolivianBrazilianBritishBritish West IndianBulgarianBurmeseCajunCambodianCanadianCape VerdeanCarpatho RusynCelticCentral AmericanCentral American IndianCherokeeCheyenneChickasawChileanChineseChippewaChoctawColombianColvilleComancheCosta RicanCreeCreekCroatianCrowCubanCypriotCzechCzechoslovakianDanishDelawareDominicanDutchDutch West IndianEastern EuropeanEcuadorianEgyptianEnglishEstonianEthiopianEuropeanFijianFilipinoFinnishFrenchFrench American IndianFrench CanadianGermanGerman RussianGhanaianGreekGuamanian / ChamorroGuatemalanGuyaneseHaitianHmongHonduranHopiHoumaHungarianIcelanderIndian (Asian)IndonesianInupiatIranianIraqiIrishIroquoisIsraeliItalianJamaicanJapaneseJordanianKenyanKiowaKoreanLaotianLatvianLebaneseLiberianLithuanianLumbeeLuxembourgerMacedonianMalaysianMalteseMarshalleseMenomineeMexicanMexican American IndianMongolianMoroccanNative HawaiianNavajoNepaleseNew ZealanderNicaraguanNigerianNorthern EuropeanNorwegianOkinawanOsageOttawaPaiutePakistaniPalestinianPanamanianParaguayanPennsylvania GermanPeruvianPimaPolishPortuguesePotawatomiPuebloPuerto RicanPuget Sound SalishRomanianRussianSalvadoranSamoanScandinavianScotch-IrishScottishSeminoleSenegaleseSerbianShoshoneSierra LeoneanSiouxSlavicSlovakSloveneSomaliSouth AfricanSouth AmericanSouth American IndianSoviet UnionSpaniardSpanishSpanish AmericanSpanish American IndianSri LankanSubsaharan AfricanSudaneseSwedishSwissSyrianTaiwaneseThaiTlingit-HaidaTohono O'OdhamTonganTrinidadian and TobagonianTsimshianTurkishU.S. Virgin IslanderUgandanUkrainianUruguayanUteVenezuelanVietnameseWelshWest IndianYakamaYaquiYugoslavianYumanYup'ikZimbabwean
Ancestry (Percentage)
AfghanAfricanAlaska NativeAlaskan AthabascanAlbanianAleutAlsatianAmericanApacheArabArapahoArgentineanArmenianAssyrian / Chaldean / SyriacAustralianAustrianBahamianBangladeshiBarbadianBasqueBelgianBelizeanBermudanBhutaneseBlackfeetBolivianBrazilianBritishBritish West IndianBulgarianBurmeseCajunCambodianCanadianCape VerdeanCarpatho RusynCelticCentral AmericanCentral American IndianCherokeeCheyenneChickasawChileanChineseChippewaChoctawColombianColvilleComancheCosta RicanCreeCreekCroatianCrowCubanCypriotCzechCzechoslovakianDanishDelawareDominicanDutchDutch West IndianEastern EuropeanEcuadorianEgyptianEnglishEstonianEthiopianEuropeanFijianFilipinoFinnishFrenchFrench American IndianFrench CanadianGermanGerman RussianGhanaianGreekGuamanian / ChamorroGuatemalanGuyaneseHaitianHmongHonduranHopiHoumaHungarianIcelanderIndian (Asian)IndonesianInupiatIranianIraqiIrishIroquoisIsraeliItalianJamaicanJapaneseJordanianKenyanKiowaKoreanLaotianLatvianLebaneseLiberianLithuanianLumbeeLuxembourgerMacedonianMalaysianMalteseMarshalleseMenomineeMexicanMexican American IndianMongolianMoroccanNative HawaiianNavajoNepaleseNew ZealanderNicaraguanNigerianNorthern EuropeanNorwegianOkinawanOsageOttawaPaiutePakistaniPalestinianPanamanianParaguayanPennsylvania GermanPeruvianPimaPolishPortuguesePotawatomiPuebloPuerto RicanPuget Sound SalishRomanianRussianSalvadoranSamoanScandinavianScotch-IrishScottishSeminoleSenegaleseSerbianShoshoneSierra LeoneanSiouxSlavicSlovakSloveneSomaliSouth AfricanSouth AmericanSouth American IndianSoviet UnionSpaniardSpanishSpanish AmericanSpanish American IndianSri LankanSubsaharan AfricanSudaneseSwedishSwissSyrianTaiwaneseThaiTlingit-HaidaTohono O'OdhamTonganTrinidadian and TobagonianTsimshianTurkishU.S. Virgin IslanderUgandanUkrainianUruguayanUteVenezuelanVietnameseWelshWest IndianYakamaYaquiYugoslavianYumanYup'ikZimbabwean
Immigrant Origin (Total)
AfghanistanAfricaAlbaniaArgentinaArmeniaAsiaAustraliaAustriaAzoresBahamasBangladeshBarbadosBelarusBelgiumBelizeBoliviaBosnia and HerzegovinaBrazilBulgariaBurma / MyanmarCabo VerdeCambodiaCameroonCanadaCaribbeanCentral AmericaChileChinaColombiaCongoCosta RicaCroatiaCubaCzechoslovakiaDenmarkDominicaDominican RepublicEastern AfricaEastern AsiaEastern EuropeEcuadorEgyptEl SalvadorEnglandEritreaEthiopiaEuropeFijiFranceGermanyGhanaGreeceGrenadaGuatemalaGuyanaHaitiHondurasHong KongHungaryIndiaIndonesiaIranIraqIrelandIsraelItalyJamaicaJapanJordanKazakhstanKenyaKoreaKuwaitLaosLatin AmericaLatviaLebanonLiberiaLithuaniaMalaysiaMexicoMicronesiaMiddle AfricaMoldovaMoroccoNepalNetherlandsNicaraguaNigeriaNorth MacedoniaNorthern AfricaNorthern EuropeNorwayOceaniaPakistanPanamaPeruPhilippinesPolandPortugalRomaniaRussiaSaudi ArabiaScotlandSenegalSerbiaSierra LeoneSingaporeSomaliaSouth AfricaSouth AmericaSouth Central AsiaSouth Eastern AsiaSouthern EuropeSpainSri LankaSt. Vincent and the GrenadinesSudanSwedenSwitzerlandSyriaTaiwanThailandTrinidad and TobagoTurkeyUgandaUkraineUruguayUzbekistanVenezuelaVietnamWest IndiesWestern AfricaWestern AsiaWestern EuropeYemenZaireZimbabwe
Immigrant Origin (Percentage)
AfghanistanAfricaAlbaniaArgentinaArmeniaAsiaAustraliaAustriaAzoresBahamasBangladeshBarbadosBelarusBelgiumBelizeBoliviaBosnia and HerzegovinaBrazilBulgariaBurma / MyanmarCabo VerdeCambodiaCameroonCanadaCaribbeanCentral AmericaChileChinaColombiaCongoCosta RicaCroatiaCubaCzechoslovakiaDenmarkDominicaDominican RepublicEastern AfricaEastern AsiaEastern EuropeEcuadorEgyptEl SalvadorEnglandEritreaEthiopiaEuropeFijiFranceGermanyGhanaGreeceGrenadaGuatemalaGuyanaHaitiHondurasHong KongHungaryIndiaIndonesiaIranIraqIrelandIsraelItalyJamaicaJapanJordanKazakhstanKenyaKoreaKuwaitLaosLatin AmericaLatviaLebanonLiberiaLithuaniaMalaysiaMexicoMicronesiaMiddle AfricaMoldovaMoroccoNepalNetherlandsNicaraguaNigeriaNorth MacedoniaNorthern AfricaNorthern EuropeNorwayOceaniaPakistanPanamaPeruPhilippinesPolandPortugalRomaniaRussiaSaudi ArabiaScotlandSenegalSerbiaSierra LeoneSingaporeSomaliaSouth AfricaSouth AmericaSouth Central AsiaSouth Eastern AsiaSouthern EuropeSpainSri LankaSt. Vincent and the GrenadinesSudanSwedenSwitzerlandSyriaTaiwanThailandTrinidad and TobagoTurkeyUgandaUkraineUruguayUzbekistanVenezuelaVietnamWest IndiesWestern AfricaWestern AsiaWestern EuropeYemenZaireZimbabwe
Income
Income (Families)
Income (Households)
Poverty
Poverty (Families)
Unemployment
Employment Occupations
Employment Industries
Employer Class
Commute Time
Commute Means
School Enrollment
Education by Degree Field
Occupancy
Finances
Physical Characteristics
Georgia
Compare Cities
Comparison Subject

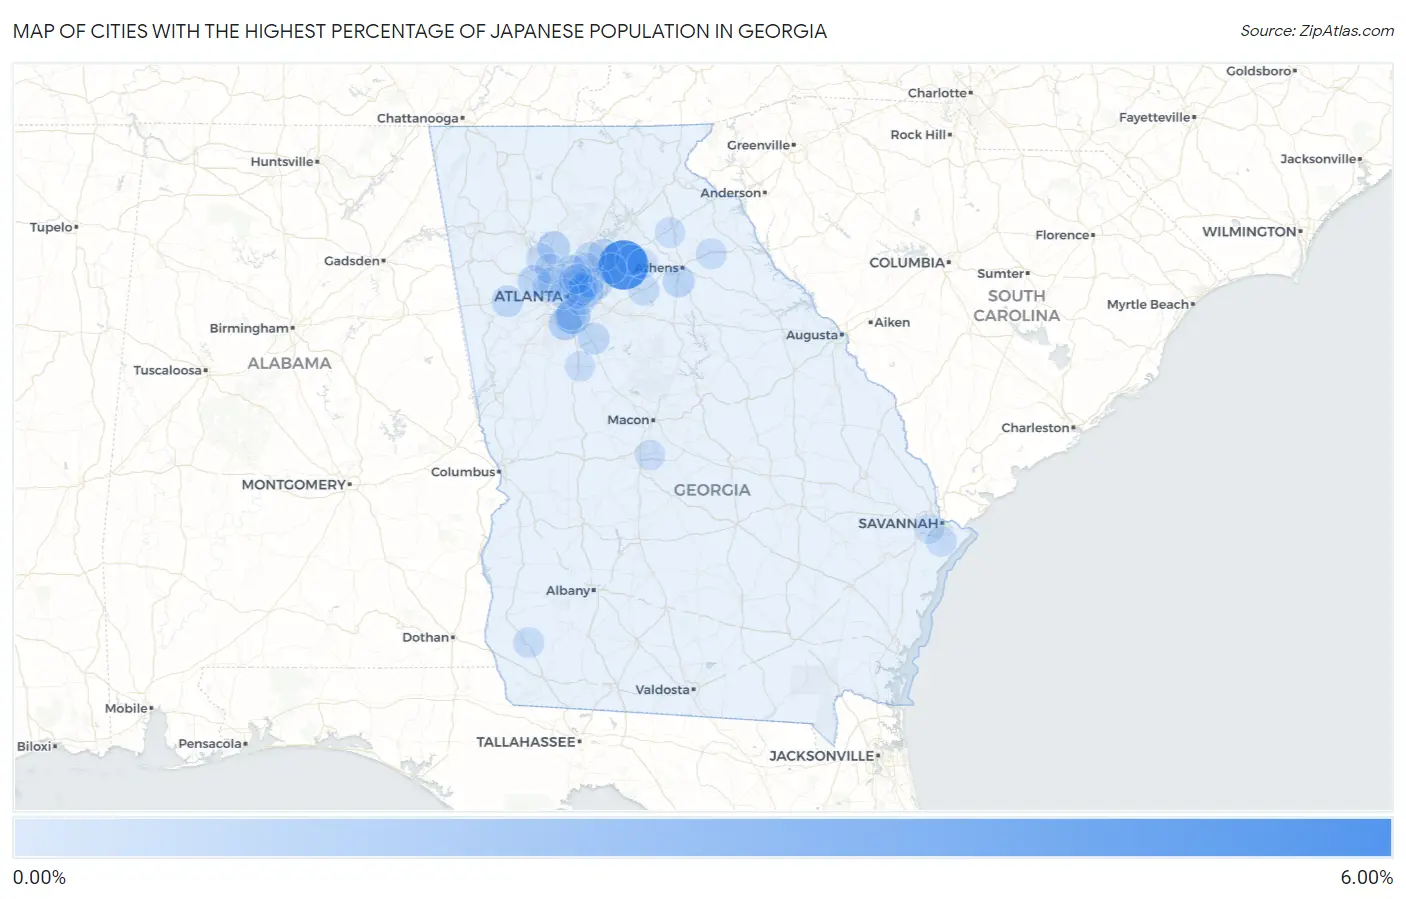
Map of Cities with the Highest Percentage of Japanese Population in Georgia

0.00%
6.00%
Cities with the Highest Percentage of Japanese Population in Georgia Map

Cities with the Highest Percentage of Japanese Population in Georgia

City Japanese vs State vs National
1.Dacula5.57%0.066%(+5.51)#10.11%(+5.47)#21
2.Lake City1.51%0.066%(+1.44)#20.11%(+1.40)#135
3.Riverdale0.81%0.066%(+0.744)#30.11%(+0.704)#311
4.Woodstock0.69%0.066%(+0.625)#40.11%(+0.585)#371
5.Powder Springs0.62%0.066%(+0.554)#50.11%(+0.514)#413
6.Suwanee0.59%0.066%(+0.527)#60.11%(+0.487)#425
7.Mountain Park0.57%0.066%(+0.504)#70.11%(+0.464)#439
8.Pine Lake0.56%0.066%(+0.497)#80.11%(+0.457)#442
9.Watkinsville0.53%0.066%(+0.468)#90.11%(+0.427)#459
10.Cusseta Chattahoochee County Unified Government0.51%0.066%(+0.445)#100.11%(+0.404)#480
11.Villa Rica0.46%0.066%(+0.395)#110.11%(+0.355)#516
12.Mcdonough0.43%0.066%(+0.367)#120.11%(+0.326)#544
13.North Druid Hills0.30%0.066%(+0.230)#130.11%(+0.190)#749
14.Scottdale0.28%0.066%(+0.218)#140.11%(+0.178)#773
15.Auburn0.27%0.066%(+0.204)#150.11%(+0.163)#806
16.Monroe0.27%0.066%(+0.200)#160.11%(+0.160)#813
17.Comer0.22%0.066%(+0.155)#170.11%(+0.115)#918
18.Johns Creek0.21%0.066%(+0.142)#180.11%(+0.102)#949
19.Montgomery0.20%0.066%(+0.129)#190.11%(+0.089)#977
20.Colquitt0.19%0.066%(+0.122)#200.11%(+0.081)#989
21.Lawrenceville0.14%0.066%(+0.075)#210.11%(+0.035)#1,126
22.Dunwoody0.12%0.066%(+0.057)#220.11%(+0.016)#1,200
23.Commerce0.11%0.066%(+0.042)#230.11%(+0.002)#1,265
24.Mableton0.098%0.066%(+0.033)#240.11%(-0.008)#1,308
25.Warner Robins0.097%0.066%(+0.031)#250.11%(-0.009)#1,316
26.Kennesaw0.096%0.066%(+0.030)#260.11%(-0.010)#1,322
27.Tucker0.086%0.066%(+0.021)#270.11%(-0.020)#1,370
28.Forest Park0.082%0.066%(+0.016)#280.11%(-0.025)#1,392
29.Smyrna0.077%0.066%(+0.011)#290.11%(-0.029)#1,416
30.Griffin0.068%0.066%(+0.002)#300.11%(-0.038)#1,467
31.Decatur0.057%0.066%(-0.009)#310.11%(-0.049)#1,536
32.Clarkston0.055%0.066%(-0.011)#320.11%(-0.051)#1,548
33.Peachtree Corners0.052%0.066%(-0.014)#330.11%(-0.054)#1,563
34.Marietta0.050%0.066%(-0.015)#340.11%(-0.056)#1,574
35.Savannah0.047%0.066%(-0.019)#350.11%(-0.060)#1,595
36.Sandy Springs0.035%0.066%(-0.031)#360.11%(-0.072)#1,688
37.Winder0.033%0.066%(-0.033)#370.11%(-0.074)#1,695
38.Brookhaven0.032%0.066%(-0.034)#380.11%(-0.075)#1,698
39.Augusta-Richmond County Consolidated Government (Balance)0.027%0.066%(-0.039)#390.11%(-0.079)#1,745
40.Candler Mcafee0.026%0.066%(-0.039)#400.11%(-0.080)#1,754
41.Atlanta0.020%0.066%(-0.046)#410.11%(-0.086)#1,810
42.Athens-Clarke County Unified Government (Balance)0.010%0.066%(-0.056)#420.11%(-0.096)#1,886
43.Chamblee0.010%0.066%(-0.056)#430.11%(-0.096)#1,888

Common Questions

What are the Top 10 Cities with the Highest Percentage of Japanese Population in Georgia?
Top 10 Cities with the Highest Percentage of Japanese Population in Georgia are:
#1
5.57%
#2
1.51%
#3
0.81%
#4
0.69%
#5
0.62%
#6
0.59%
#7
0.57%
#8
0.56%
#9
0.53%
#10
0.46%
What city has the Highest Percentage of Japanese Population in Georgia?
Dacula has the Highest Percentage of Japanese Population in Georgia with 5.57%.
What is the Percentage of Japanese Population in the State of Georgia?
Percentage of Japanese Population in Georgia is 0.066%.
What is the Percentage of Japanese Population in the United States?
Percentage of Japanese Population in the United States is 0.11%.