Cities with the Highest Percentage of Japanese Population in Illinois
RELATED REPORTS & OPTIONS
Japanese
Illinois
Compare Cities
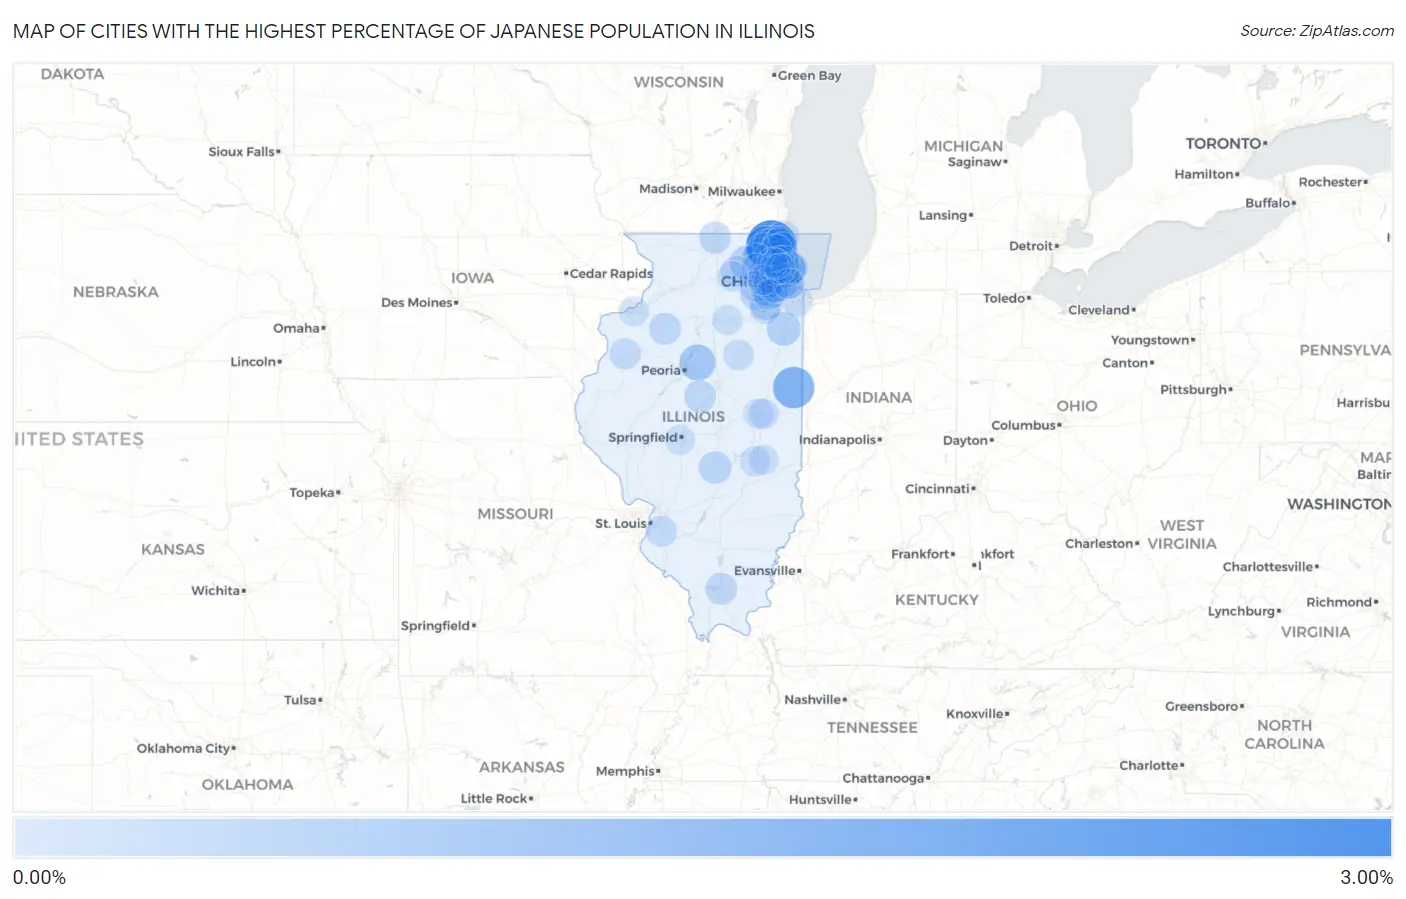
Map of Cities with the Highest Percentage of Japanese Population in Illinois
0.00%
3.00%
Cities with the Highest Percentage of Japanese Population in Illinois
| City | Japanese | vs State | vs National | |
| 1. | Hainesville | 2.82% | 0.043%(+2.78)#1 | 0.11%(+2.71)#62 |
| 2. | Hoopeston | 1.62% | 0.043%(+1.58)#2 | 0.11%(+1.51)#123 |
| 3. | Volo | 1.55% | 0.043%(+1.51)#3 | 0.11%(+1.45)#130 |
| 4. | Morton Grove | 1.08% | 0.043%(+1.04)#4 | 0.11%(+0.974)#222 |
| 5. | Metamora | 0.84% | 0.043%(+0.793)#5 | 0.11%(+0.730)#304 |
| 6. | Gages Lake | 0.79% | 0.043%(+0.746)#6 | 0.11%(+0.683)#320 |
| 7. | Cary | 0.63% | 0.043%(+0.589)#7 | 0.11%(+0.526)#400 |
| 8. | Mundelein | 0.63% | 0.043%(+0.587)#8 | 0.11%(+0.524)#401 |
| 9. | Hanover Park | 0.57% | 0.043%(+0.529)#9 | 0.11%(+0.466)#436 |
| 10. | Bloomingdale | 0.54% | 0.043%(+0.500)#10 | 0.11%(+0.437)#451 |
| 11. | Manteno | 0.53% | 0.043%(+0.489)#11 | 0.11%(+0.427)#461 |
| 12. | Island Lake | 0.52% | 0.043%(+0.479)#12 | 0.11%(+0.416)#473 |
| 13. | Hampshire | 0.44% | 0.043%(+0.400)#13 | 0.11%(+0.337)#528 |
| 14. | Deer Park | 0.43% | 0.043%(+0.390)#14 | 0.11%(+0.327)#543 |
| 15. | Crystal Lawns | 0.38% | 0.043%(+0.335)#15 | 0.11%(+0.272)#613 |
| 16. | Bannockburn | 0.38% | 0.043%(+0.332)#16 | 0.11%(+0.269)#620 |
| 17. | Pana | 0.33% | 0.043%(+0.286)#17 | 0.11%(+0.223)#684 |
| 18. | Boulder Hill | 0.30% | 0.043%(+0.260)#18 | 0.11%(+0.197)#725 |
| 19. | River Forest | 0.28% | 0.043%(+0.233)#19 | 0.11%(+0.170)#786 |
| 20. | Waukegan | 0.27% | 0.043%(+0.228)#20 | 0.11%(+0.165)#800 |
| 21. | Armington | 0.26% | 0.043%(+0.216)#21 | 0.11%(+0.153)#831 |
| 22. | Kewanee | 0.25% | 0.043%(+0.211)#22 | 0.11%(+0.148)#839 |
| 23. | Marion | 0.24% | 0.043%(+0.200)#23 | 0.11%(+0.137)#865 |
| 24. | Skokie | 0.23% | 0.043%(+0.191)#24 | 0.11%(+0.128)#882 |
| 25. | Rockton | 0.23% | 0.043%(+0.187)#25 | 0.11%(+0.124)#895 |
| 26. | Round Lake | 0.19% | 0.043%(+0.144)#26 | 0.11%(+0.081)#990 |
| 27. | Glendale Heights | 0.19% | 0.043%(+0.144)#27 | 0.11%(+0.081)#991 |
| 28. | Warrenville | 0.18% | 0.043%(+0.136)#28 | 0.11%(+0.073)#1,009 |
| 29. | Monmouth | 0.17% | 0.043%(+0.128)#29 | 0.11%(+0.065)#1,033 |
| 30. | Addison | 0.17% | 0.043%(+0.127)#30 | 0.11%(+0.065)#1,034 |
| 31. | Wood Dale | 0.17% | 0.043%(+0.122)#31 | 0.11%(+0.059)#1,054 |
| 32. | Park Ridge | 0.16% | 0.043%(+0.114)#32 | 0.11%(+0.051)#1,078 |
| 33. | Evanston | 0.13% | 0.043%(+0.091)#33 | 0.11%(+0.028)#1,143 |
| 34. | Belleville | 0.13% | 0.043%(+0.089)#34 | 0.11%(+0.027)#1,152 |
| 35. | Schaumburg | 0.11% | 0.043%(+0.071)#35 | 0.11%(+0.008)#1,231 |
| 36. | Streamwood | 0.11% | 0.043%(+0.068)#36 | 0.11%(+0.005)#1,251 |
| 37. | Gurnee | 0.11% | 0.043%(+0.068)#37 | 0.11%(+0.005)#1,253 |
| 38. | South Holland | 0.099% | 0.043%(+0.055)#38 | 0.11%(-0.008)#1,307 |
| 39. | Carol Stream | 0.098% | 0.043%(+0.055)#39 | 0.11%(-0.008)#1,310 |
| 40. | Libertyville | 0.097% | 0.043%(+0.054)#40 | 0.11%(-0.009)#1,314 |
| 41. | Winfield | 0.090% | 0.043%(+0.047)#41 | 0.11%(-0.016)#1,349 |
| 42. | Zion | 0.090% | 0.043%(+0.046)#42 | 0.11%(-0.017)#1,353 |
| 43. | Roselle | 0.088% | 0.043%(+0.044)#43 | 0.11%(-0.019)#1,360 |
| 44. | Pontiac | 0.087% | 0.043%(+0.044)#44 | 0.11%(-0.019)#1,362 |
| 45. | Northbrook | 0.083% | 0.043%(+0.040)#45 | 0.11%(-0.023)#1,389 |
| 46. | Algonquin | 0.080% | 0.043%(+0.037)#46 | 0.11%(-0.026)#1,399 |
| 47. | Sycamore | 0.077% | 0.043%(+0.034)#47 | 0.11%(-0.029)#1,415 |
| 48. | Lombard | 0.073% | 0.043%(+0.029)#48 | 0.11%(-0.034)#1,437 |
| 49. | Chicago | 0.072% | 0.043%(+0.028)#49 | 0.11%(-0.035)#1,443 |
| 50. | North Aurora | 0.068% | 0.043%(+0.024)#50 | 0.11%(-0.039)#1,471 |
| 51. | Mattoon | 0.065% | 0.043%(+0.022)#51 | 0.11%(-0.041)#1,481 |
| 52. | Woodridge | 0.065% | 0.043%(+0.021)#52 | 0.11%(-0.042)#1,485 |
| 53. | Wheeling | 0.064% | 0.043%(+0.021)#53 | 0.11%(-0.042)#1,488 |
| 54. | Joliet | 0.062% | 0.043%(+0.018)#54 | 0.11%(-0.044)#1,505 |
| 55. | Naperville | 0.060% | 0.043%(+0.016)#55 | 0.11%(-0.047)#1,518 |
| 56. | Elgin | 0.059% | 0.043%(+0.015)#56 | 0.11%(-0.048)#1,525 |
| 57. | Champaign | 0.058% | 0.043%(+0.014)#57 | 0.11%(-0.049)#1,531 |
| 58. | Wheaton | 0.052% | 0.043%(+0.009)#58 | 0.11%(-0.054)#1,564 |
| 59. | Downers Grove | 0.048% | 0.043%(+0.005)#59 | 0.11%(-0.058)#1,587 |
| 60. | Dekalb | 0.047% | 0.043%(+0.003)#60 | 0.11%(-0.060)#1,596 |
| 61. | Ottawa | 0.037% | 0.043%(-0.006)#61 | 0.11%(-0.069)#1,669 |
| 62. | Westmont | 0.037% | 0.043%(-0.006)#62 | 0.11%(-0.069)#1,672 |
| 63. | Western Springs | 0.030% | 0.043%(-0.014)#63 | 0.11%(-0.077)#1,717 |
| 64. | North Chicago | 0.029% | 0.043%(-0.014)#64 | 0.11%(-0.077)#1,724 |
| 65. | Elk Grove Village | 0.028% | 0.043%(-0.016)#65 | 0.11%(-0.079)#1,741 |
| 66. | Niles | 0.026% | 0.043%(-0.017)#66 | 0.11%(-0.080)#1,757 |
| 67. | Urbana | 0.023% | 0.043%(-0.020)#67 | 0.11%(-0.083)#1,782 |
| 68. | Bolingbrook | 0.020% | 0.043%(-0.023)#68 | 0.11%(-0.086)#1,806 |
| 69. | Moline | 0.019% | 0.043%(-0.025)#69 | 0.11%(-0.087)#1,818 |
| 70. | Charleston | 0.017% | 0.043%(-0.027)#70 | 0.11%(-0.089)#1,832 |
| 71. | Springfield | 0.017% | 0.043%(-0.027)#71 | 0.11%(-0.090)#1,834 |
| 72. | West Chicago | 0.016% | 0.043%(-0.028)#72 | 0.11%(-0.091)#1,843 |
| 73. | Cicero | 0.013% | 0.043%(-0.030)#73 | 0.11%(-0.093)#1,864 |
| 74. | Arlington Heights | 0.0091% | 0.043%(-0.034)#74 | 0.11%(-0.097)#1,900 |
| 75. | Palatine | 0.0089% | 0.043%(-0.035)#75 | 0.11%(-0.097)#1,902 |
| 76. | Des Plaines | 0.0083% | 0.043%(-0.035)#76 | 0.11%(-0.098)#1,904 |
Common Questions
What are the Top 10 Cities with the Highest Percentage of Japanese Population in Illinois?
Top 10 Cities with the Highest Percentage of Japanese Population in Illinois are:
#1
2.82%
#2
1.62%
#3
1.55%
#4
1.08%
#5
0.84%
#6
0.79%
#7
0.63%
#8
0.63%
#9
0.57%
#10
0.54%
What city has the Highest Percentage of Japanese Population in Illinois?
Hainesville has the Highest Percentage of Japanese Population in Illinois with 2.82%.
What is the Percentage of Japanese Population in the State of Illinois?
Percentage of Japanese Population in Illinois is 0.043%.
What is the Percentage of Japanese Population in the United States?
Percentage of Japanese Population in the United States is 0.11%.