Zip Codes with the Largest Mexican Community in Washington
RELATED REPORTS & OPTIONS
Mexican
Washington
Compare Zip Codes
Map of Zip Codes with the Largest Mexican Community in Washington
0
50,000
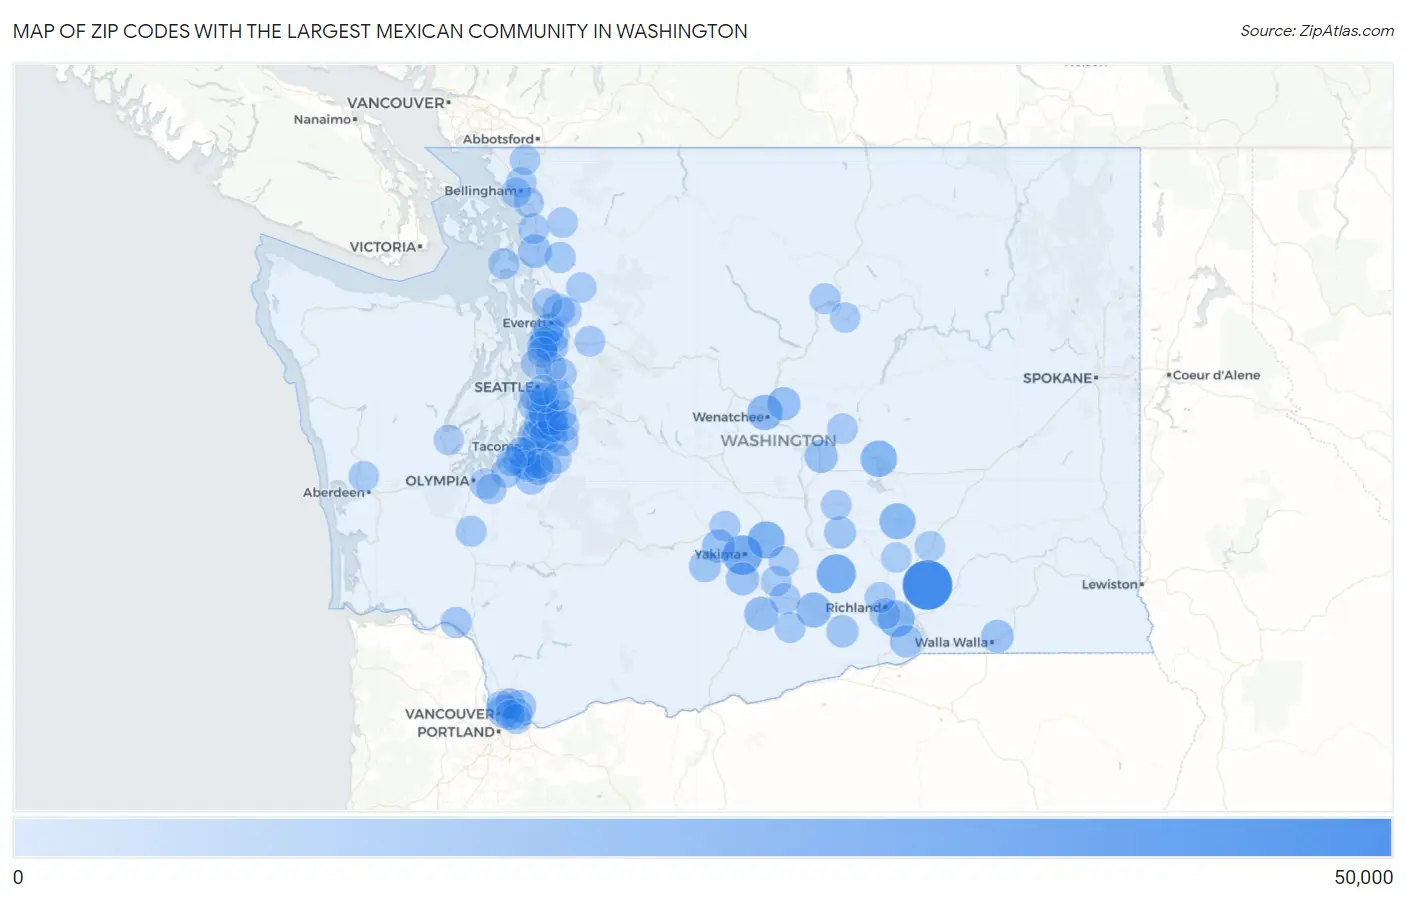
Zip Codes with the Largest Mexican Community in Washington
| Zip Code | Mexican | vs State | vs National | |
| 1. | 99301 | 41,655 | 793,289 (5.25%)#1 | 37,145,956 (0.11%)#77 |
| 2. | 98902 | 21,020 | 793,289 (2.65%)#2 | 37,145,956 (0.06%)#346 |
| 3. | 98944 | 20,192 | 793,289 (2.55%)#3 | 37,145,956 (0.05%)#368 |
| 4. | 98901 | 16,363 | 793,289 (2.06%)#4 | 37,145,956 (0.04%)#509 |
| 5. | 99336 | 15,323 | 793,289 (1.93%)#5 | 37,145,956 (0.04%)#559 |
| 6. | 98837 | 14,681 | 793,289 (1.85%)#6 | 37,145,956 (0.04%)#590 |
| 7. | 99344 | 13,880 | 793,289 (1.75%)#7 | 37,145,956 (0.04%)#641 |
| 8. | 98801 | 12,550 | 793,289 (1.58%)#8 | 37,145,956 (0.03%)#722 |
| 9. | 98930 | 11,608 | 793,289 (1.46%)#9 | 37,145,956 (0.03%)#784 |
| 10. | 98948 | 9,954 | 793,289 (1.25%)#10 | 37,145,956 (0.03%)#945 |
| 11. | 98273 | 8,831 | 793,289 (1.11%)#11 | 37,145,956 (0.02%)#1,051 |
| 12. | 98802 | 8,822 | 793,289 (1.11%)#12 | 37,145,956 (0.02%)#1,052 |
| 13. | 98003 | 8,592 | 793,289 (1.08%)#13 | 37,145,956 (0.02%)#1,071 |
| 14. | 98848 | 8,394 | 793,289 (1.06%)#14 | 37,145,956 (0.02%)#1,105 |
| 15. | 98661 | 8,331 | 793,289 (1.05%)#15 | 37,145,956 (0.02%)#1,112 |
| 16. | 98908 | 8,311 | 793,289 (1.05%)#16 | 37,145,956 (0.02%)#1,115 |
| 17. | 98951 | 8,034 | 793,289 (1.01%)#17 | 37,145,956 (0.02%)#1,145 |
| 18. | 98002 | 7,475 | 793,289 (0.94%)#18 | 37,145,956 (0.02%)#1,218 |
| 19. | 99362 | 7,230 | 793,289 (0.91%)#19 | 37,145,956 (0.02%)#1,264 |
| 20. | 99337 | 6,836 | 793,289 (0.86%)#20 | 37,145,956 (0.02%)#1,337 |
| 21. | 98032 | 6,596 | 793,289 (0.83%)#21 | 37,145,956 (0.02%)#1,384 |
| 22. | 98682 | 6,402 | 793,289 (0.81%)#22 | 37,145,956 (0.02%)#1,418 |
| 23. | 98204 | 6,391 | 793,289 (0.81%)#23 | 37,145,956 (0.02%)#1,420 |
| 24. | 99350 | 6,231 | 793,289 (0.79%)#24 | 37,145,956 (0.02%)#1,450 |
| 25. | 98092 | 6,215 | 793,289 (0.78%)#25 | 37,145,956 (0.02%)#1,452 |
| 26. | 98168 | 6,213 | 793,289 (0.78%)#26 | 37,145,956 (0.02%)#1,453 |
| 27. | 98270 | 6,126 | 793,289 (0.77%)#27 | 37,145,956 (0.02%)#1,474 |
| 28. | 99349 | 5,829 | 793,289 (0.73%)#28 | 37,145,956 (0.02%)#1,535 |
| 29. | 98903 | 5,734 | 793,289 (0.72%)#29 | 37,145,956 (0.02%)#1,554 |
| 30. | 98208 | 5,634 | 793,289 (0.71%)#30 | 37,145,956 (0.02%)#1,571 |
| 31. | 98499 | 5,554 | 793,289 (0.70%)#31 | 37,145,956 (0.01%)#1,594 |
| 32. | 98404 | 5,458 | 793,289 (0.69%)#32 | 37,145,956 (0.01%)#1,622 |
| 33. | 98023 | 5,332 | 793,289 (0.67%)#33 | 37,145,956 (0.01%)#1,652 |
| 34. | 98198 | 4,964 | 793,289 (0.63%)#34 | 37,145,956 (0.01%)#1,753 |
| 35. | 98012 | 4,871 | 793,289 (0.61%)#35 | 37,145,956 (0.01%)#1,787 |
| 36. | 98387 | 4,811 | 793,289 (0.61%)#36 | 37,145,956 (0.01%)#1,804 |
| 37. | 98056 | 4,626 | 793,289 (0.58%)#37 | 37,145,956 (0.01%)#1,863 |
| 38. | 98444 | 4,580 | 793,289 (0.58%)#38 | 37,145,956 (0.01%)#1,876 |
| 39. | 98632 | 4,498 | 793,289 (0.57%)#39 | 37,145,956 (0.01%)#1,911 |
| 40. | 98146 | 4,391 | 793,289 (0.55%)#40 | 37,145,956 (0.01%)#1,951 |
| 41. | 98030 | 4,309 | 793,289 (0.54%)#41 | 37,145,956 (0.01%)#1,990 |
| 42. | 98274 | 4,141 | 793,289 (0.52%)#42 | 37,145,956 (0.01%)#2,050 |
| 43. | 98445 | 4,033 | 793,289 (0.51%)#43 | 37,145,956 (0.01%)#2,091 |
| 44. | 98932 | 3,963 | 793,289 (0.50%)#44 | 37,145,956 (0.01%)#2,121 |
| 45. | 98277 | 3,920 | 793,289 (0.49%)#45 | 37,145,956 (0.01%)#2,134 |
| 46. | 98935 | 3,852 | 793,289 (0.49%)#46 | 37,145,956 (0.01%)#2,152 |
| 47. | 98188 | 3,840 | 793,289 (0.48%)#47 | 37,145,956 (0.01%)#2,157 |
| 48. | 98087 | 3,767 | 793,289 (0.47%)#48 | 37,145,956 (0.01%)#2,191 |
| 49. | 98037 | 3,751 | 793,289 (0.47%)#49 | 37,145,956 (0.01%)#2,200 |
| 50. | 98531 | 3,692 | 793,289 (0.47%)#50 | 37,145,956 (0.01%)#2,226 |
| 51. | 98001 | 3,676 | 793,289 (0.46%)#51 | 37,145,956 (0.01%)#2,230 |
| 52. | 98052 | 3,651 | 793,289 (0.46%)#52 | 37,145,956 (0.01%)#2,241 |
| 53. | 98031 | 3,609 | 793,289 (0.45%)#53 | 37,145,956 (0.01%)#2,257 |
| 54. | 98812 | 3,592 | 793,289 (0.45%)#54 | 37,145,956 (0.01%)#2,264 |
| 55. | 98203 | 3,589 | 793,289 (0.45%)#55 | 37,145,956 (0.01%)#2,266 |
| 56. | 98503 | 3,554 | 793,289 (0.45%)#56 | 37,145,956 (0.01%)#2,277 |
| 57. | 98374 | 3,506 | 793,289 (0.44%)#57 | 37,145,956 (0.01%)#2,294 |
| 58. | 98042 | 3,434 | 793,289 (0.43%)#58 | 37,145,956 (0.01%)#2,322 |
| 59. | 98284 | 3,392 | 793,289 (0.43%)#59 | 37,145,956 (0.01%)#2,341 |
| 60. | 98058 | 3,380 | 793,289 (0.43%)#60 | 37,145,956 (0.01%)#2,347 |
| 61. | 99352 | 3,380 | 793,289 (0.43%)#61 | 37,145,956 (0.01%)#2,348 |
| 62. | 98684 | 3,366 | 793,289 (0.42%)#62 | 37,145,956 (0.01%)#2,352 |
| 63. | 98034 | 3,322 | 793,289 (0.42%)#63 | 37,145,956 (0.01%)#2,372 |
| 64. | 98258 | 3,318 | 793,289 (0.42%)#64 | 37,145,956 (0.01%)#2,375 |
| 65. | 98942 | 3,299 | 793,289 (0.42%)#65 | 37,145,956 (0.01%)#2,389 |
| 66. | 98823 | 3,295 | 793,289 (0.42%)#66 | 37,145,956 (0.01%)#2,391 |
| 67. | 98375 | 3,271 | 793,289 (0.41%)#67 | 37,145,956 (0.01%)#2,405 |
| 68. | 98036 | 3,224 | 793,289 (0.41%)#68 | 37,145,956 (0.01%)#2,428 |
| 69. | 98953 | 3,211 | 793,289 (0.40%)#69 | 37,145,956 (0.01%)#2,434 |
| 70. | 99354 | 3,181 | 793,289 (0.40%)#70 | 37,145,956 (0.01%)#2,448 |
| 71. | 98272 | 3,177 | 793,289 (0.40%)#71 | 37,145,956 (0.01%)#2,451 |
| 72. | 98665 | 3,163 | 793,289 (0.40%)#72 | 37,145,956 (0.01%)#2,457 |
| 73. | 98433 | 3,160 | 793,289 (0.40%)#73 | 37,145,956 (0.01%)#2,458 |
| 74. | 99357 | 3,129 | 793,289 (0.39%)#74 | 37,145,956 (0.01%)#2,474 |
| 75. | 98226 | 3,105 | 793,289 (0.39%)#75 | 37,145,956 (0.01%)#2,482 |
| 76. | 98233 | 3,023 | 793,289 (0.38%)#76 | 37,145,956 (0.01%)#2,523 |
| 77. | 98271 | 2,973 | 793,289 (0.37%)#77 | 37,145,956 (0.01%)#2,560 |
| 78. | 98409 | 2,950 | 793,289 (0.37%)#78 | 37,145,956 (0.01%)#2,577 |
| 79. | 98662 | 2,903 | 793,289 (0.37%)#79 | 37,145,956 (0.01%)#2,600 |
| 80. | 98513 | 2,903 | 793,289 (0.37%)#80 | 37,145,956 (0.01%)#2,601 |
| 81. | 98683 | 2,891 | 793,289 (0.36%)#81 | 37,145,956 (0.01%)#2,611 |
| 82. | 98520 | 2,845 | 793,289 (0.36%)#82 | 37,145,956 (0.01%)#2,638 |
| 83. | 98264 | 2,793 | 793,289 (0.35%)#83 | 37,145,956 (0.01%)#2,679 |
| 84. | 98106 | 2,739 | 793,289 (0.35%)#84 | 37,145,956 (0.01%)#2,707 |
| 85. | 98118 | 2,733 | 793,289 (0.34%)#85 | 37,145,956 (0.01%)#2,709 |
| 86. | 98813 | 2,727 | 793,289 (0.34%)#86 | 37,145,956 (0.01%)#2,715 |
| 87. | 98391 | 2,719 | 793,289 (0.34%)#87 | 37,145,956 (0.01%)#2,721 |
| 88. | 98223 | 2,709 | 793,289 (0.34%)#88 | 37,145,956 (0.01%)#2,728 |
| 89. | 98229 | 2,634 | 793,289 (0.33%)#89 | 37,145,956 (0.01%)#2,778 |
| 90. | 99326 | 2,616 | 793,289 (0.33%)#90 | 37,145,956 (0.01%)#2,788 |
| 91. | 98133 | 2,600 | 793,289 (0.33%)#91 | 37,145,956 (0.01%)#2,798 |
| 92. | 98936 | 2,528 | 793,289 (0.32%)#92 | 37,145,956 (0.01%)#2,859 |
| 93. | 98373 | 2,509 | 793,289 (0.32%)#93 | 37,145,956 (0.01%)#2,878 |
| 94. | 99343 | 2,475 | 793,289 (0.31%)#94 | 37,145,956 (0.01%)#2,903 |
| 95. | 98498 | 2,456 | 793,289 (0.31%)#95 | 37,145,956 (0.01%)#2,916 |
| 96. | 98664 | 2,456 | 793,289 (0.31%)#96 | 37,145,956 (0.01%)#2,917 |
| 97. | 98006 | 2,455 | 793,289 (0.31%)#97 | 37,145,956 (0.01%)#2,918 |
| 98. | 98584 | 2,455 | 793,289 (0.31%)#98 | 37,145,956 (0.01%)#2,919 |
| 99. | 98225 | 2,442 | 793,289 (0.31%)#99 | 37,145,956 (0.01%)#2,928 |
| 100. | 98144 | 2,429 | 793,289 (0.31%)#100 | 37,145,956 (0.01%)#2,940 |
Common Questions
What are the Top 10 Zip Codes with the Largest Mexican Community in Washington?
Top 10 Zip Codes with the Largest Mexican Community in Washington are:
What zip code has the Largest Mexican Community in Washington?
99301 has the Largest Mexican Community in Washington with 41,655.
What is the Total Mexican Population in the State of Washington?
Total Mexican Population in Washington is 793,289.
What is the Total Mexican Population in the United States?
Total Mexican Population in the United States is 37,145,956.